

Introduction
Sample Preparation
Test Methods and Equipment
Rock Damage Stages
Acoustic Emission Measurement and Analysis
Acoustic Emission Source Location Analysis
AE Parameter Analysis
Analysis of Microcrack Type using RA Values
Conclusions and Discussion
Introduction
Understanding bedrock stability is important because bedrock is used for building foundations, underground repositories of petroleum or liquefied gases, underground nuclear waste disposal facilities, and landfill sites. However, bedrock excavation for the construction of such facilities may degrade the stability of the surrounding rock. In particular, when underground facilities are under high stress, damaged areas occur around the facilities, and the deformation and crack development in the surrounding rocks may differ from the original rock.
Rock damage is associated with microcrack development (Martin and Chandler, 1994). The number and characteristics of microcracks in a rock have a great effect on its physical–mechanical–engineering properties (Burdine, 1963). Therefore, understanding the development of microcracks in rocks under stress is important to assuring the stability of underground structures and, as such, numerous studies have been conducted on rock damage and crack development (Brace et al., 1966; Bieniawski, 1967; Martin and Chandler, 1994; Eberhardt et al., 1997; Diederichs et al., 2004; Ranjith et al., 2007; Jang et al., 2010).
Given that pores and microcracks are almost always present in rocks, when rocks are under stress the pores and microcracks are first closed and then elastic deformation takes place. When the stress increases further and exceeds the elastic limit of the rock, new microcracks begin to form, connect with each other, and finally the rock fractures. This process is progressively induced by the applied stress.
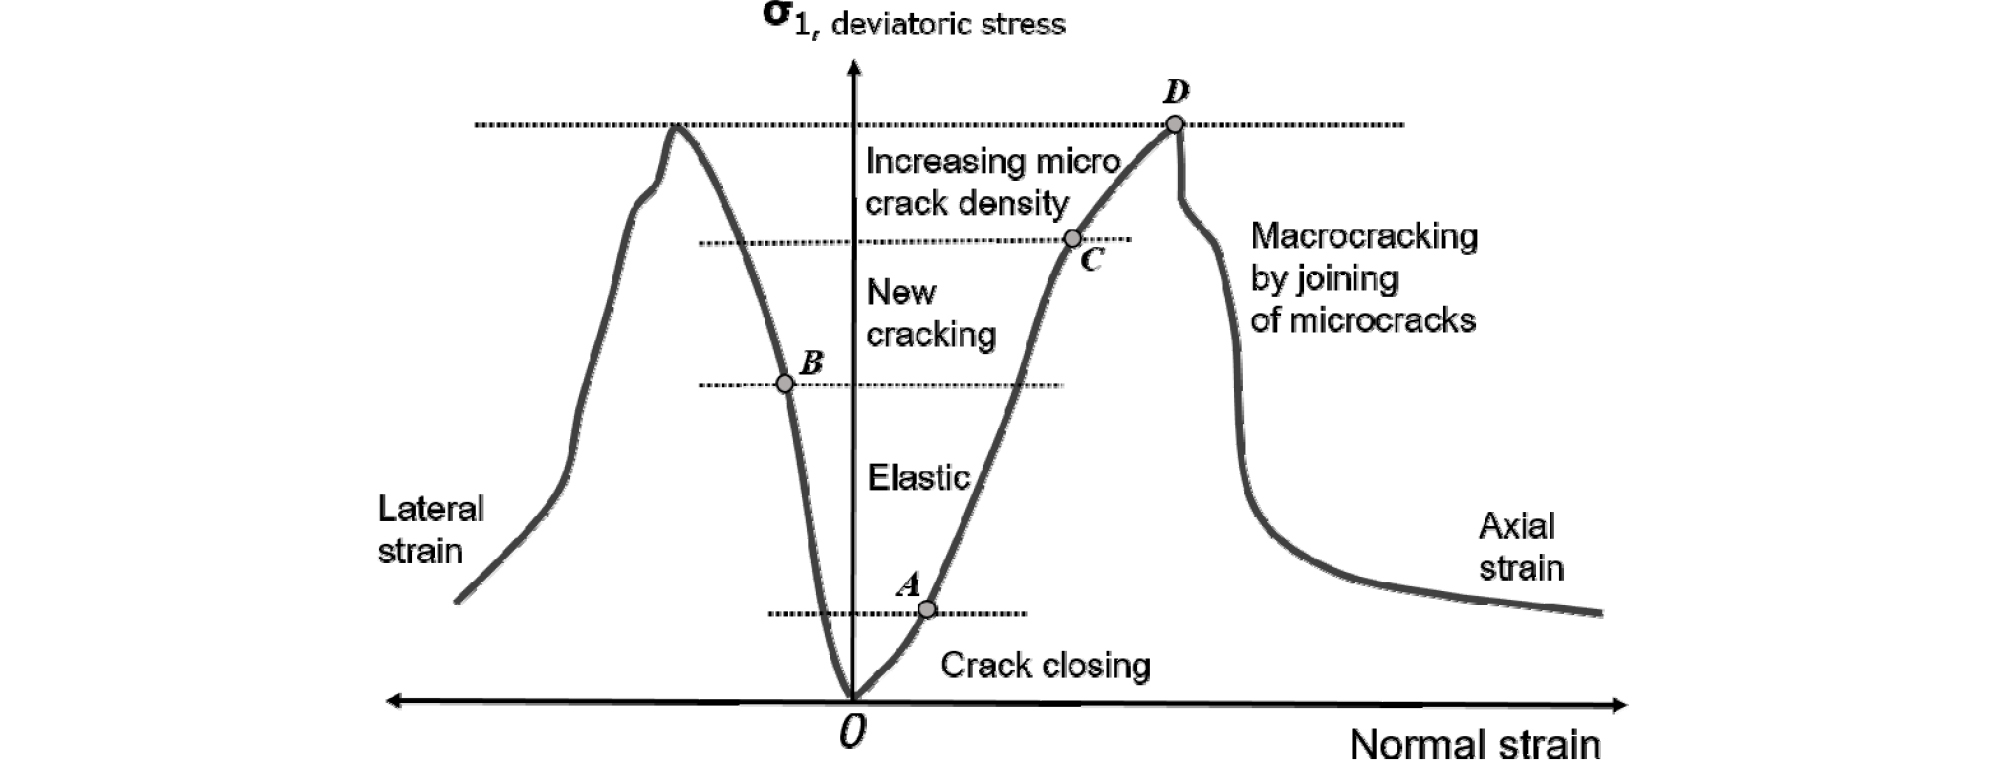
Using stress–strain curves obtained during compression tests, Brace et al. (1966) and Bieniawski (1967) divided the stress state of rock into the crack closure, linear elastic deformation, crack initiation, stable crack propagation, critical energy release (beginning of expansion), unstable crack growth, fracture, and residual strength stages (Fig. 1). The crack closure stage (section O–A in Fig. 1) occurs when existing cracks and pores close when stress is first applied, and the stress–strain curve for this stage shows nonlinear behavior and a concave-upward shape. The duration of this nonlinear stage is determined by the initial crack density and geometry. The stress at point A, where the nonlinear stage ends, is termed the crack closure stress (𝜎cc). After the crack closure stress, the stress–strain curve is linear, and this is termed the elastic stage (section A–B in Fig. 1). When the stress applied to the rock exceeds the elastic limit, new cracks begin to form, and the stress–strain curve begins to deviate from linearity. The stress level (point B) at this time is called the crack initiation stress (𝜎ci). The cracks formed in section B–C are stable cracks, and crack growth can be stopped by adjusting the applied stress. However, as the stress gradually increases, unstable cracks grow and connect with each other, causing damage to the rock. The stress level at this time (point C) is called the crack damage stress (𝜎cd). These threshold stresses for rock damage were first measured quantitatively by Martin and Chandler (1994) using volumetric and crack volumetric strains, and also measured by Eberhardt et al. (1997, 1998, 1999a, 1999b), Diederichs et al. (2004), and Ranjith et al. (2007) using volumetric stiffness.
Recently, acoustic emission (AE) techniques have also been used in studies of crack development and rock damage (Diederichs et al., 2004; Jang et al., 2010). AEs are minute sound waves that suddenly occur in brittle materials, such as rocks, due to local deformation or fracturing. These high-frequency elastic waves can be detected and measured using piezoelectric transducer sensors. When rocks are subjected to laboratory compression tests, stress is concentrated on existing microcracks or grain boundaries of minerals due to the applied stress, and cracks suddenly form or grow, thereby leading to AEs. In this case, the rock damage state or crack characteristics can be investigated by analyzing the number or characteristics of the AE signals. The most common AE parameters used to define the AE characteristics are the rise time, count, energy, duration, amplitude, and average frequency (Fig. 2). The rise time is the time taken for the AE signals to reach the maximum waveform amplitude from the first threshold crossover point after exceeding the detection threshold. The rise time is often used to distinguish between burst sound sources when microcracks form and continuous sound sources when crack surfaces are sheared. The rise time is also used to separate the AE signal from background noise. The count is the number of times the AE signals cross the detection threshold. Given that large signals generally exceed the detection threshold more frequently than small signals, the count can be used as a criterion for evaluation signal intensity. The energy is the time integration of the signal voltage and is proportional to signal intensity. The energy corresponds to the area under the AE waveform envelope during the period of observation, and is greatly affected by the duration and amplitude. Energy is more useful than count for the analysis of AE signal characteristics, because it is less affected by the arbitrarily set detection threshold value or frequency. The duration is the time from when the AE signals first cross the detection threshold to when the AE signals last cross the detection threshold—this parameter is used for noise filtering. The amplitude is the maximum amplitude of the AE signals, and is typically related to the strength of the source producing the AEs. The analysis of the amplitude should use the same amplification level and sensors, and it is useful for investigating the relative characteristics of AE signals at various load stages. The average frequency (in kHz) is obtained by dividing the count by the duration of observation. Given that the average frequency is calculated from the time domain rather than the spectrum domain, it may be different from that calculated in the spectrum domain. The RA (Rise time / Amplitude) value is obtained by dividing the rise time by the amplitude, and is used to identify the type of microcrack. Ohno and Ohtsu (2010) and Wang et al. (2016) reported that AE signals generated from tension cracks have low RA values and high average frequencies, whereas AE signals produced by shear cracks have high RA values and low average frequencies (Fig. 3).


In this study, uniaxial compression tests were conducted on Pocheon granite samples to measure the axial and transverse strains and AE signals of the samples at different stress levels. The damage threshold stresses of the rock were determined using the strain of the samples, and the degree of damage was divided into four stages. The characteristics of the AE signals in each damage stage were analyzed using AE parameters, such as rise time, count, energy, duration, amplitude, and average frequency. The AE parameters in each damage stage were analyzed to link the AE characteristics to the degree of damage, and investigate the development of microcracks from AE signals.
Sample Preparation
A granite from Pocheon, Gyeonggi-do, Korea, was used in the experiments. Pocheon granite is a medium- to coarse-grained Mesozoic leucocratic granite that contains quartz, plagioclase, microcline, orthoclase, and biotite.
Samples were cut into cylinders with diameters of ~54 mm and lengths of 114 to 118 mm for uniaxial compression tests. Both sides of the samples were precisely ground to have a flatness of <0.02 mm and perpendicularity of <0.001 radians, such that the International Society of Rock Mechanics (ISRM) test conditions could be met. The three prepared samples were completely dried at temperatures of ~105°C for 24 h to remove pore water. Pocheon granite has a specific gravity of ~2.61 g/cm3, porosity of ~0.75%, and absorption of ~0.29%. Therefore, Pocheon granite is a relatively dense rock with a low pore volume (Table 1). The samples used in the tests are physically almost identical to each other. However, the P-wave velocity of the granite was measured to be 3454–3659 m/s, which is slightly lower than that of a brittle rock with high strength, indicating that some microcracks are present in the samples. Microcracks in granite form due to the differences in the expansion coefficients of the constituent minerals when the granite cools. Preferred orientation of microcracks form when the stress that has been acting on the granite body is released (Dale, 1923; Plumb et al., 1984; Jang and Oh, 2001).
Table 1. Physical properties and dimensions of samples
Test Methods and Equipment
The uniaxial compression tests were conducted following the methods proposed by the International Society of Rock Mechanics (ISRM, 1979), and the axial and transverse strains and AE signals of the samples were measured during the tests. The compression tester was a UTM-97001 instrument manufactured by Myung-Do System (Korea), with a maximum compression capacity of 1960 kN, which is a rigid compression tester capable of controlling both load and displacement (Fig. 4a). The strain of the samples was measured using an axial extensometer (Model 3542RA) and a circumferential extensometer (Model 3544) from Epsilon, USA (Fig. 4b). These two extensometers are easier to install and capable of measuring strain over a wider range than strain gauges. The measured strains were recorded and stored in real time through a data logger embedded in the UTM-97001, along with the load data. The elastic constants (E, 𝜈), volumetric strains, and crack volumetric strains were calculated using the collected axial and circumferential strain data, thereby enabling the damage threshold stresses of each sample to be determined.
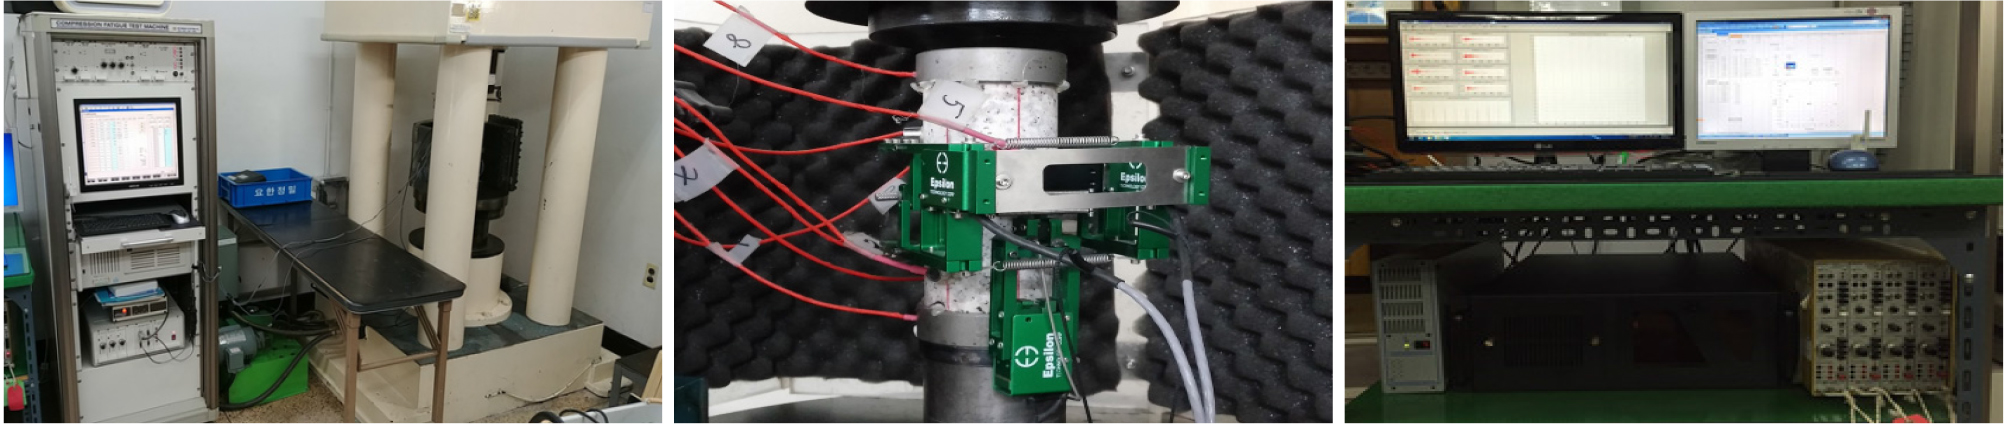
A µDiSP system from Physical Acoustic Corporation (PAC), USA, was used for AE measurements (Fig. 4c). NANO30 sensors, which are small sensors with a measuring frequency range of 125–750 kHz and a diameter of 5 mm, were used as AE sensors. To track the location of AE sources, eight sensors were evenly attached to the surface of each sample using a silicone adhesive (Fig. 4b). The µDiSP includes AEwin software that can run the system and collect and analyze data in real time. AEwin can also record and analyze diverse types of AE parameters and the locations of wave sources in real time. In this study, the rise time, count, energy, duration, amplitude, and average frequency were extracted to identify the AE signal characteristics at different stress levels.
Rock Damage Stages
The volumetric strain, crack volumetric strain, and volumetric stiffness proposed by Martin and Chandler (1994), Eberhardt et al. (1997, 1998, 1999a, 1999b), and Diederichs et al. (2004) were calculated from the measured data.
The volumetric strain (𝜀v) can be calculated from the axial strain (𝜀axial) and the transverse strain (𝜀transvers), which occur when uniaxial compressive stress (𝜎axial) is applied to cylindrical samples, as follows:
(1)
The volumetric strain measured in the experiments includes both elastic and non-elastic components, with the latter due to cracks. The elastic volumetric strain (𝜀velastic) can be calculated from Eq. (2), which is a theoretical equation, using Young’s modulus (E) and Poisson’s ratio (𝜈) as follows:
(2)
The crack volumetric strain (𝜀vcrack), which is the component of strain formed by cracks, can be obtained by subtracting the elastic volumetric strain from the volumetric strain:
(3)
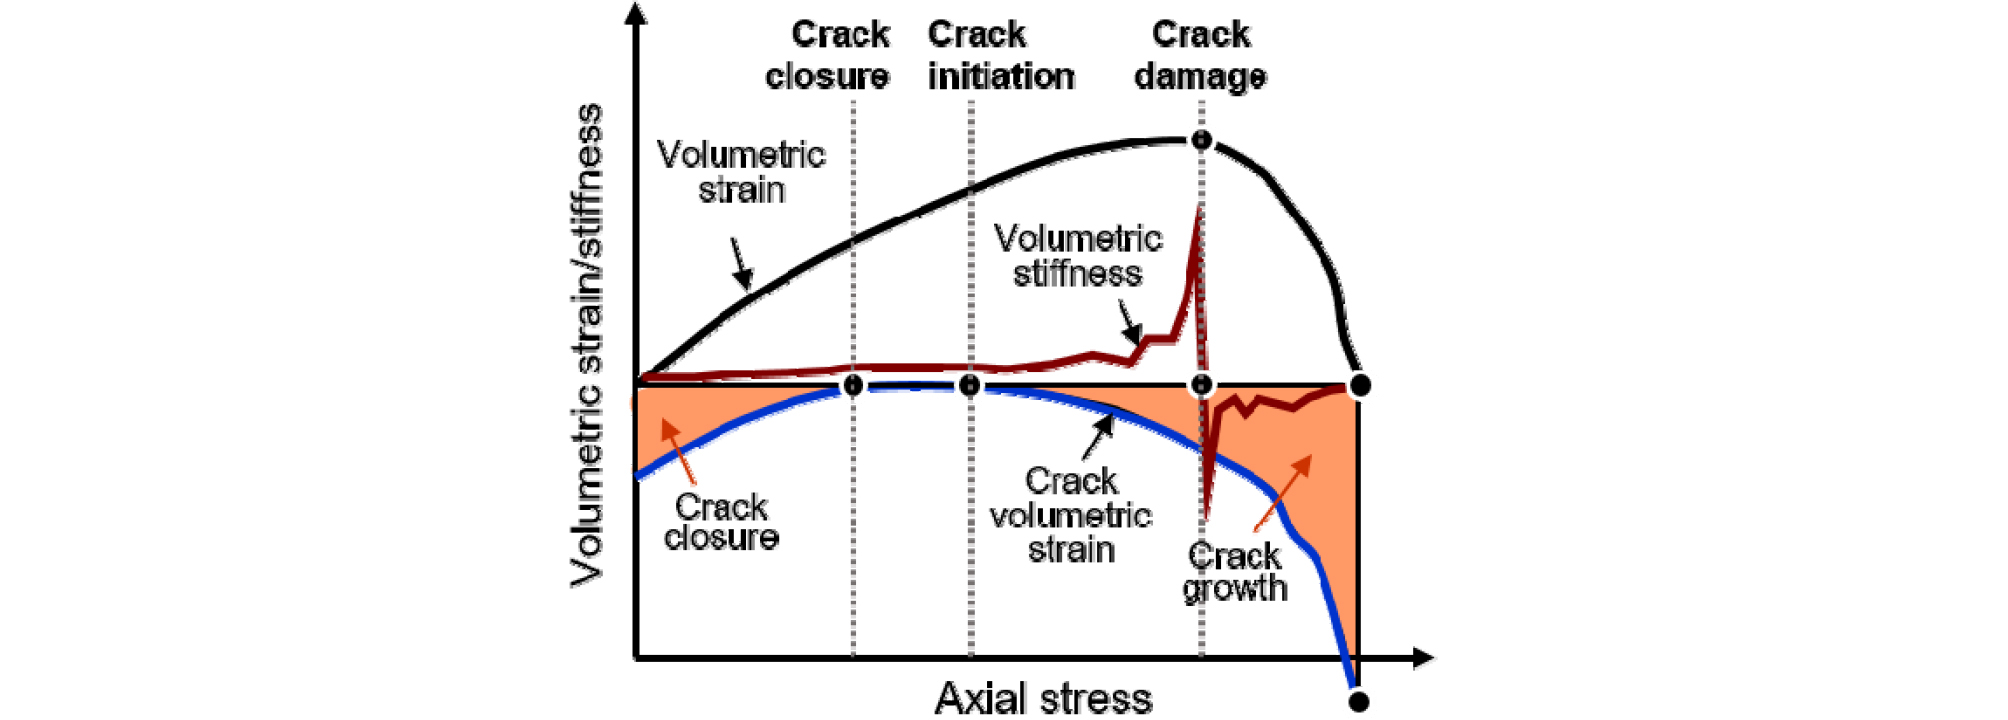
The volumetric stiffness is defined as the slope of the volumetric strain curve at a given stress. Eberhardt et al. (1998) calculated the slope of the strain curve using the moving point regression analysis method. In this method, the analyst sets a regression window and moves the window while continuously calculating the slope. When a uniaxial compressive stress is applied to a sample, the volumetric strain, crack volumetric strain, and volumetric stiffness of the rock vary with stress level, as shown in Fig. 5. In the initial stress stage, the crack volumetric strain curve has a positive slope. During this stage, the microcracks and pores inside the rock are closed, and the stress at which the slope of the crack volumetric strain curve becomes almost zero indicates that the microcracks and pores have been completely closed. This is called the crack closure stress. During the stage where the slope of the crack volumetric strain curve is horizontal, the rock is undergoing elastic deformation. As the stress increases further and new cracks begin to develop, the slope of the crack volumetric strain curve begins to change from horizontal to negative. The stress at the point where the slope begins to become negative is the crack initiation stress. As the stress increases, microcracks become connected and unstable cracks begin to grow, forming large crack surfaces. This causes the transverse strain to rapidly increase compared with the axial strain, so that the volumetric strain curve changes from a positive to negative slope. In addition, the volumetric stiffness curve rapidly changes from negative to positive at the point where the slope of the volumetric strain curve changes from positive to negative. Martin and Chandler (1994) defined the stress at this point as the crack damage stress.
Uniaxial compression tests were conducted to determine the mechanical characteristics of the samples in order to set the damage stages based on stress level. The uniaxial compressive strengths (UCS) of the three samples were 176.8, 190.9, and 198.5 MPa (Table 2). The Young’s modulus and Poisson’s ratios were determined in the range of 40–60% of the UCS. The Young’s moduli were 54.54, 60.26, and 57.05 GPa, and the Poisson’s ratios were 0.200, 0.252, and 0.268 (Table 2). The average strength of these samples was ~189 MPa and the average elastic modulus was 57 GPa. Therefore, the samples are typical brittle rocks and are categorized as having high strength/medium modulus ratios in the engineering classification of Deere and Miller (1966). Although the strength and Young’s modulus of sample GR-1 are slightly lower than those of the other samples, the mechanical properties of the three samples are relatively similar, as the differences between samples are at most 9–11%.
Table 2. Mechanical properties and damage threshold stresses measured on the granite samples by uniaxial compression tests
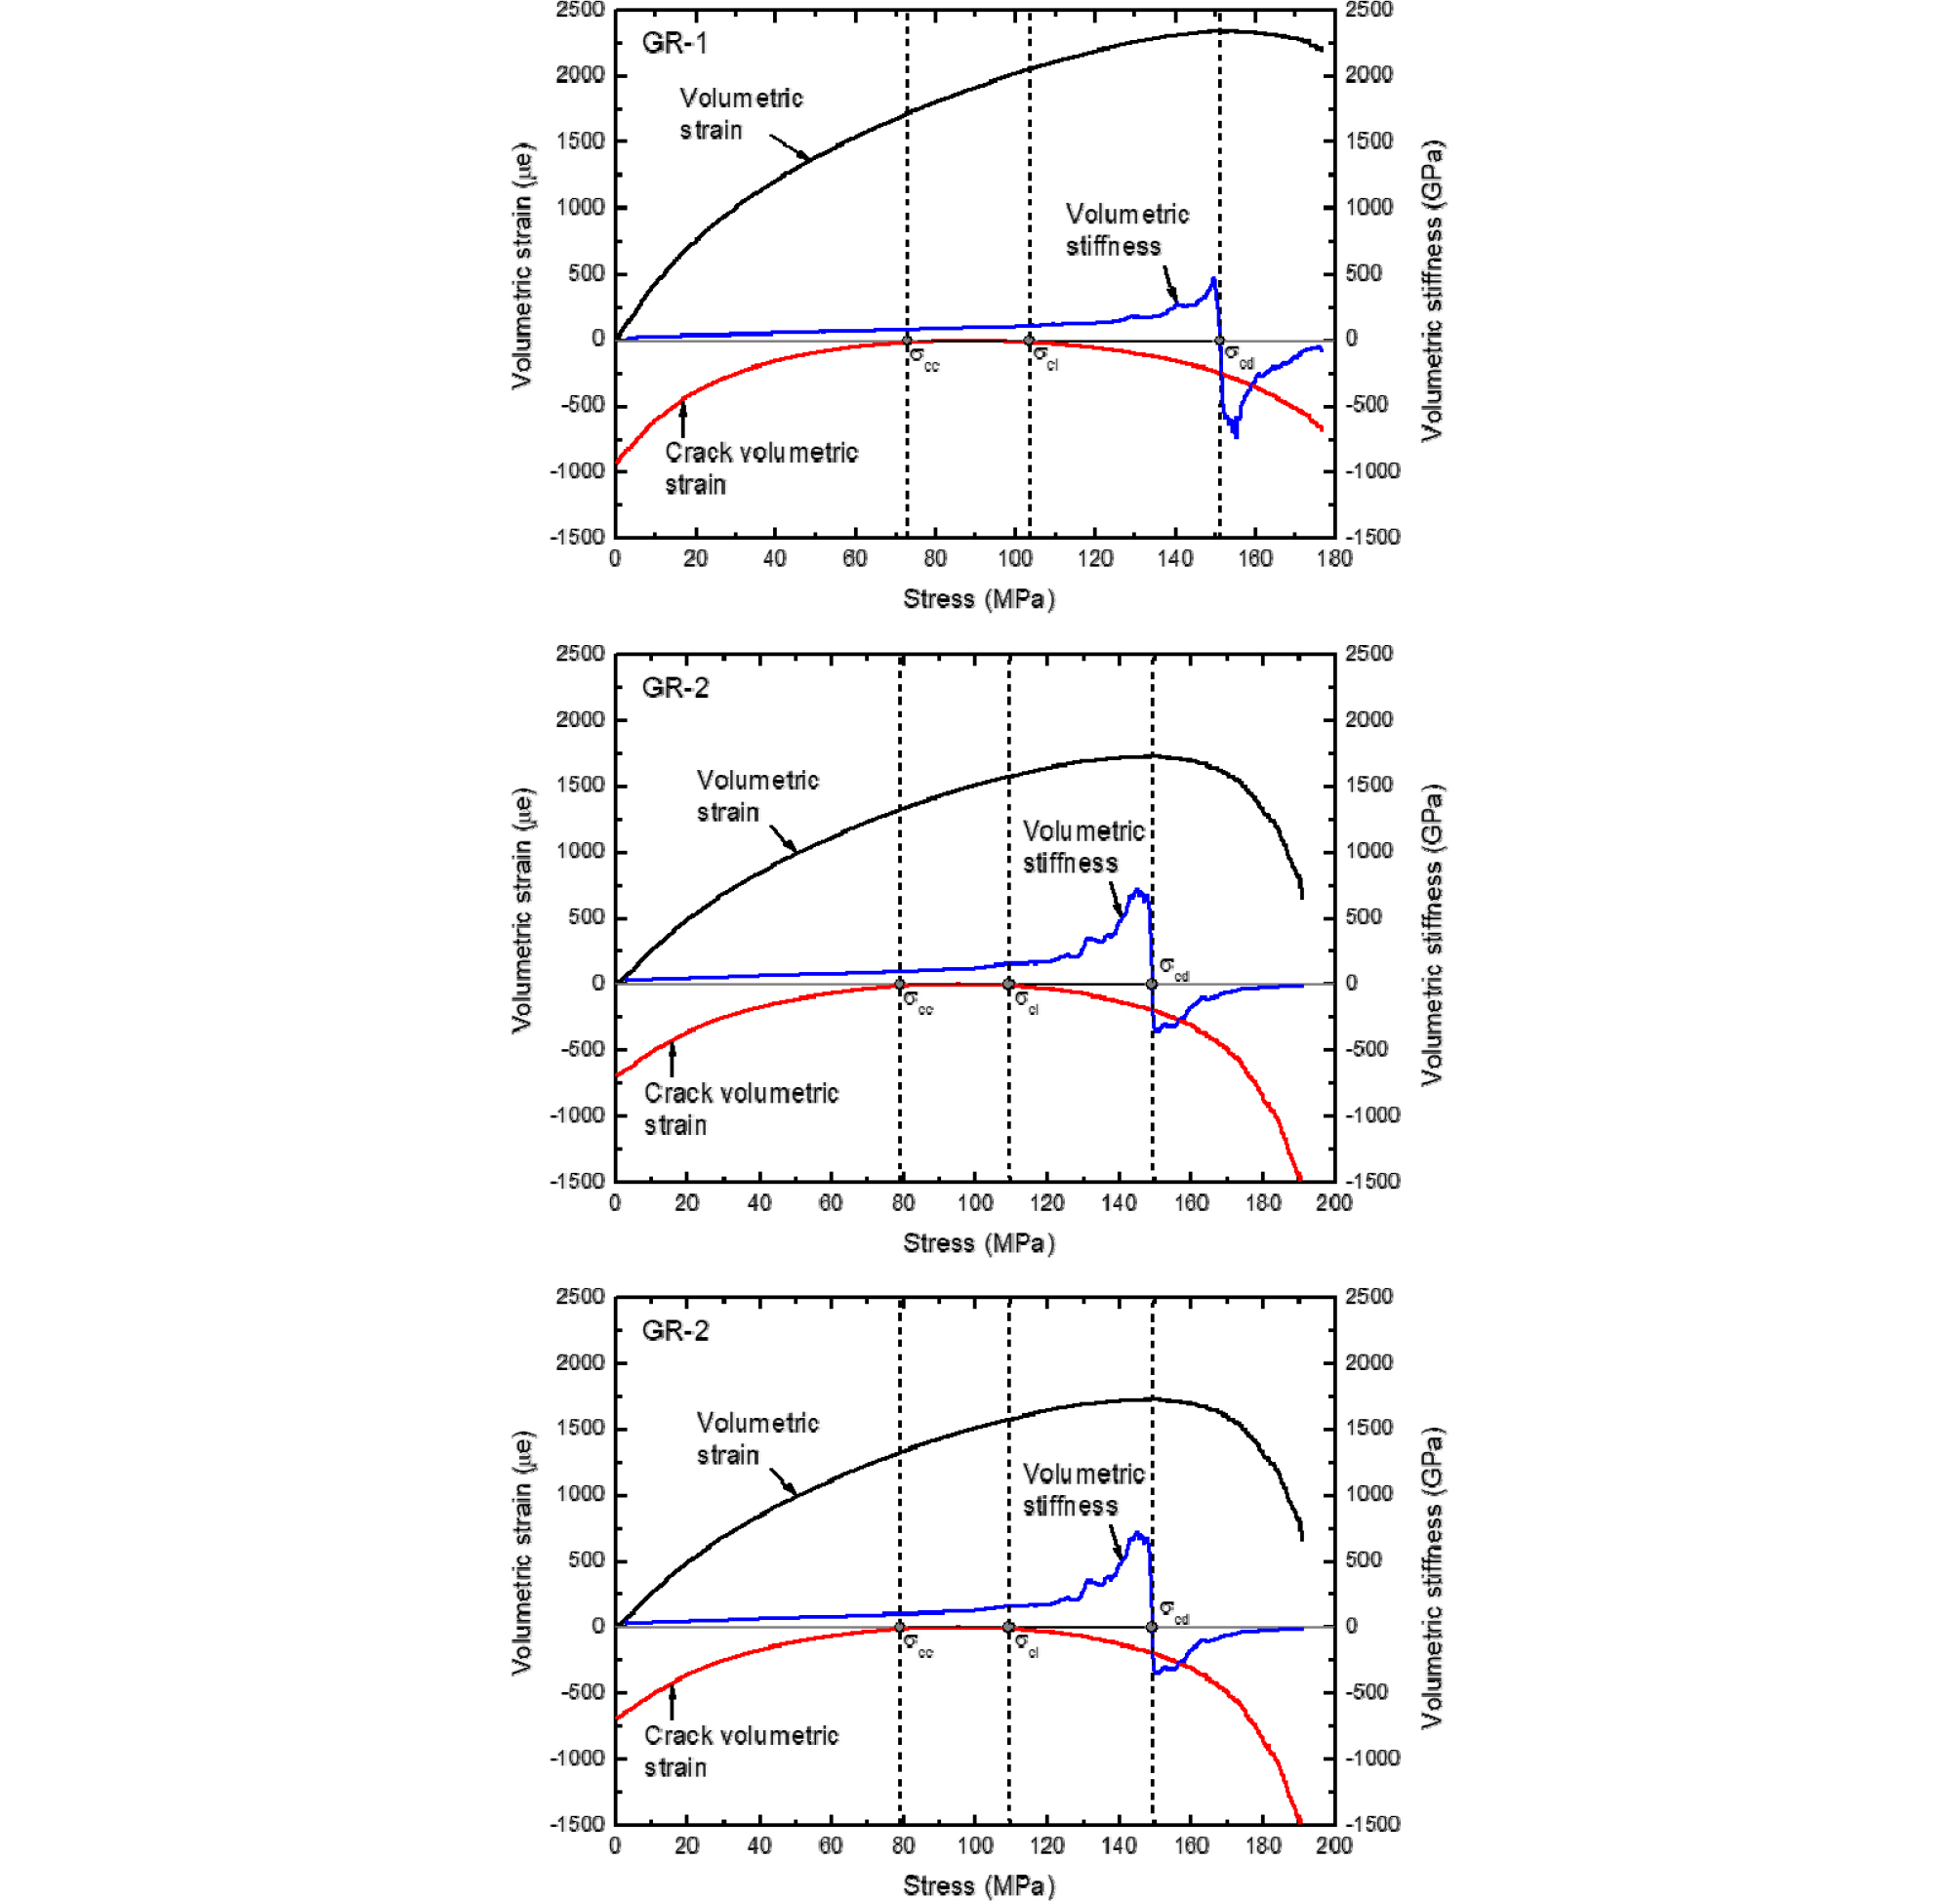
The volumetric strain, crack volumetric strain, and volumetric stiffness curves of each sample were determined using the axial and lateral strains and elastic constants measured in the uniaxial compression tests (Fig. 6). The damage threshold stresses were determined using the method described in Fig. 5. The crack closure (𝜎cc), crack initiation (𝜎ci), and crack damage (𝜎cd) stresses of sample GR-1 were 73.0, 103.5, and 151.2 MPa, those of sample GR-2 were 79.0, 109.4, and 149.0 MPa, and those of sample GR-3 were 80.7, 116.0, and 151.4 MPa, respectively. The crack closure stress levels of all the samples were 40.7–41.4% and the crack initiation stress levels were 57.3–58.5% of the UCS, indicating that the stress ratios of the three samples were similar. However, crack damage stress levels showed some differences among the samples and were 76.3–85.5% of the UCS (Table 2).
Based on the damage threshold stress, the sample damage state was divided into four stages according to the stress level: (1) stage 1 is an inelastic stage when the pores or cracks in the sample are closed and stress levels range from the initial stress to crack closure stress; (2) during stage 2, all pores have been closed and elastic deformation occurs and the stress levels range from the crack closure stress to crack initiation stress; (3) during stage 3, stable cracks begin to newly form and show inelastic characteristics, and stress levels range from the crack initiation stress to crack damage stress; (4) during stage 4, unstable cracks form and become connected to each other, causing damage to the sample that leads to fracturing, and the stress levels range from the crack damage stress to fracture stress.
Acoustic Emission Measurement and Analysis
Acoustic Emission Source Location Analysis
The most quantitative data obtained from the AE measurements are the AE source locations. The AE source locations are where the microcracks formed, and these data enable the growth and propagation of the microcracks to be quantitatively monitored (Hashida, 1993; Hashida and Takahashi, 1993; Lee, 1999). Eight AE sensors were used to analyze the AE source locations (Fig. 4b). The embedded software (AEwin E510) simultaneously determines the AE source locations during the AE measurements. The AE source locations were analyzed using the time-of-arrival method, which is generally used to determine earthquake epicenters. In an AE measurement, a single AE signal collected by each sensor is called an AE hit, a combination of six to eight AE hits is called an AE event, and the AE source location is determined from the AE event.
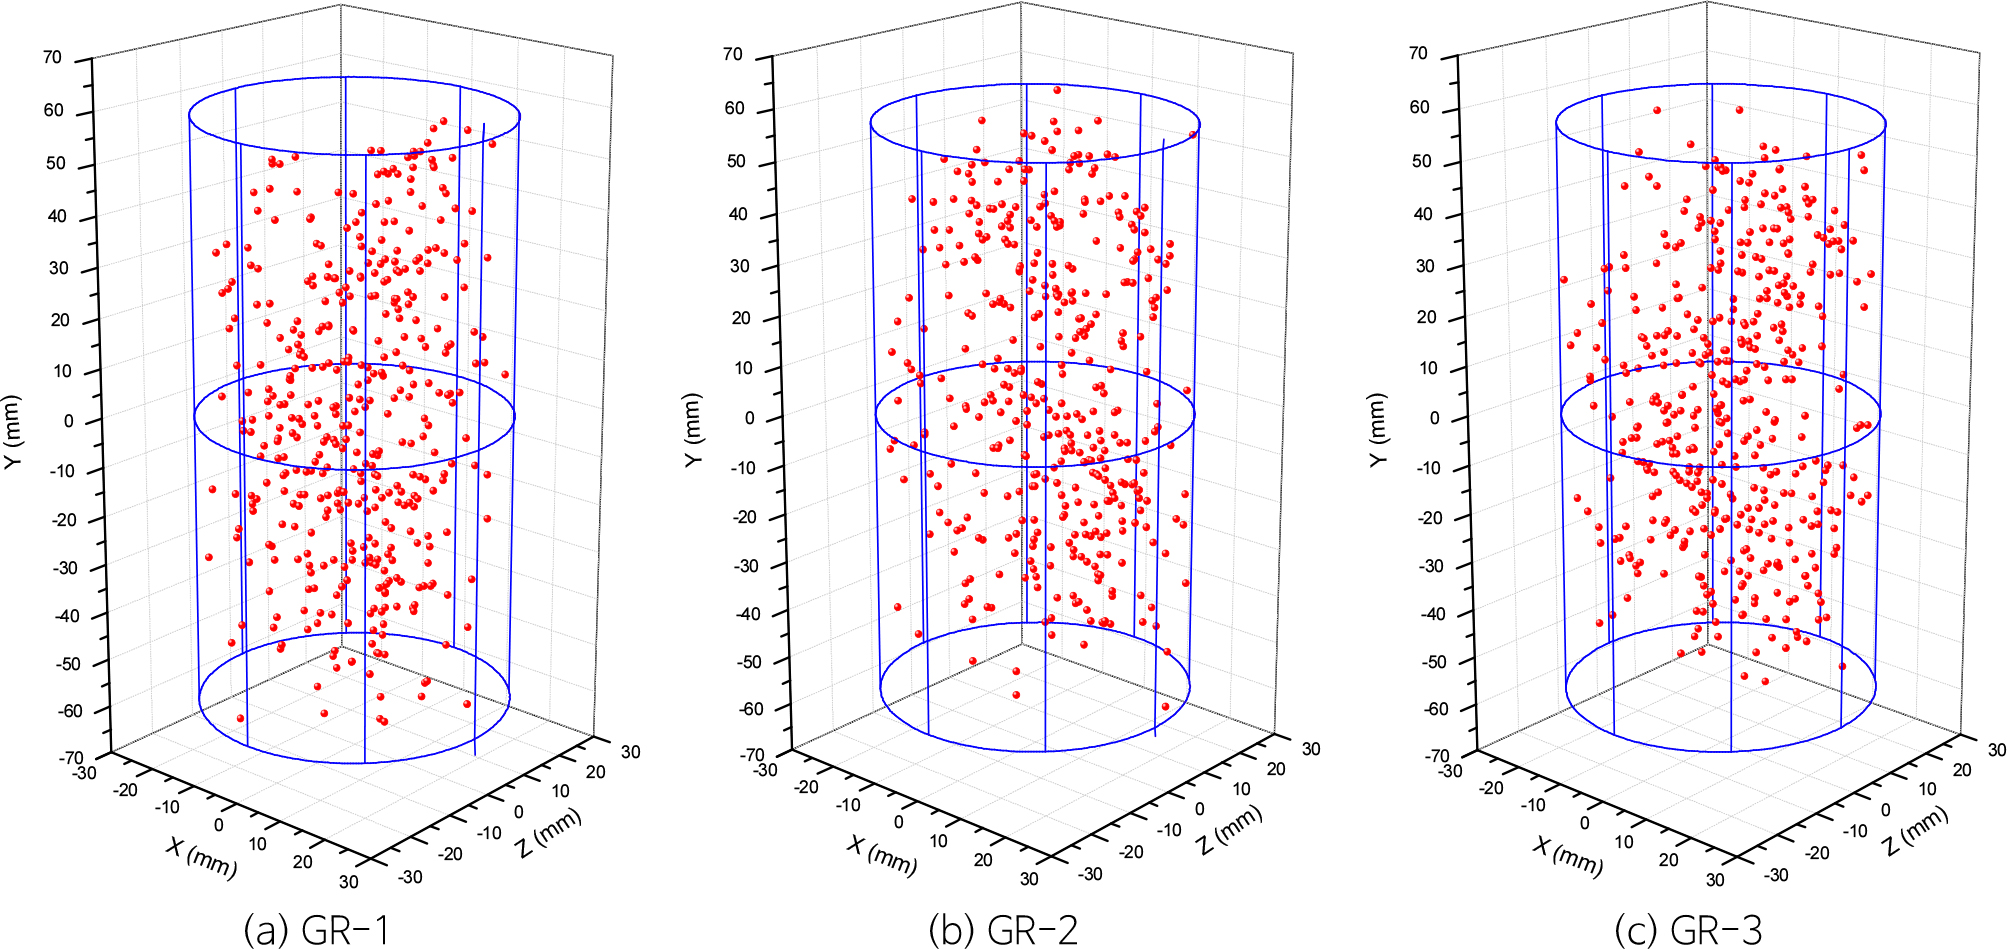
During the uniaxial compression tests, 2745–2853 AE hits were recorded and the number of AE events analyzed was 562–620 (Table 3). In sample GR-1, ~61% of the entire hits and events occurred during stage 3, and in sample GR-2 ~70% of the entire hits and events occurred during stage 4. In the case of sample GR-3, ~30% of the AE hits and events occurred during stages 3 and 4, respectively. Overall, ~75% of the entire AE hits and events occurred in and after stage 3, when new cracks began to form. The AE source locations and microcracks were evenly distributed throughout each sample (Fig. 7).
Table 3. Numbers of AE hits and events at each damage stage
| Sample ID | Stage 1 | Stage 2 | Stage 3 | Stage 4 | Total | |
| GR-1 | Hit | 254 | 534 | 1668 | 289 | 2745 |
| Event | 46 | 99 | 348 | 69 | 562 | |
| GR-2 | Hit | 41 | 205 | 630 | 1943 | 2819 |
| Event | 9 | 40 | 124 | 447 | 620 | |
| GR-3 | Hit | 297 | 831 | 913 | 812 | 2853 |
| Event | 54 | 150 | 188 | 194 | 586 | |
AE Parameter Analysis
Given that the AE signal characteristics vary with crack type and size, the characteristics of the medium, and the distance between the point where the signal occurred and the sensor, the crack type or size can be identified from the AE signal characteristics. To achieve this, the rise time, count, energy, duration, amplitude, and average frequency of the AE signals were analyzed. The AE signals that were generated when microcracks formed were almost simultaneously recorded in six to eight sensors, resulting in six to eight sets of hit data for one AE source. The AE signal characteristics were analyzed using two methods: one that used all six to eight hit data and another that used only the first hit data. The first hit data best record the wave source characteristics, because they are obtained from the location closest to the wave source, and have the least signal attenuation and lowest noise.
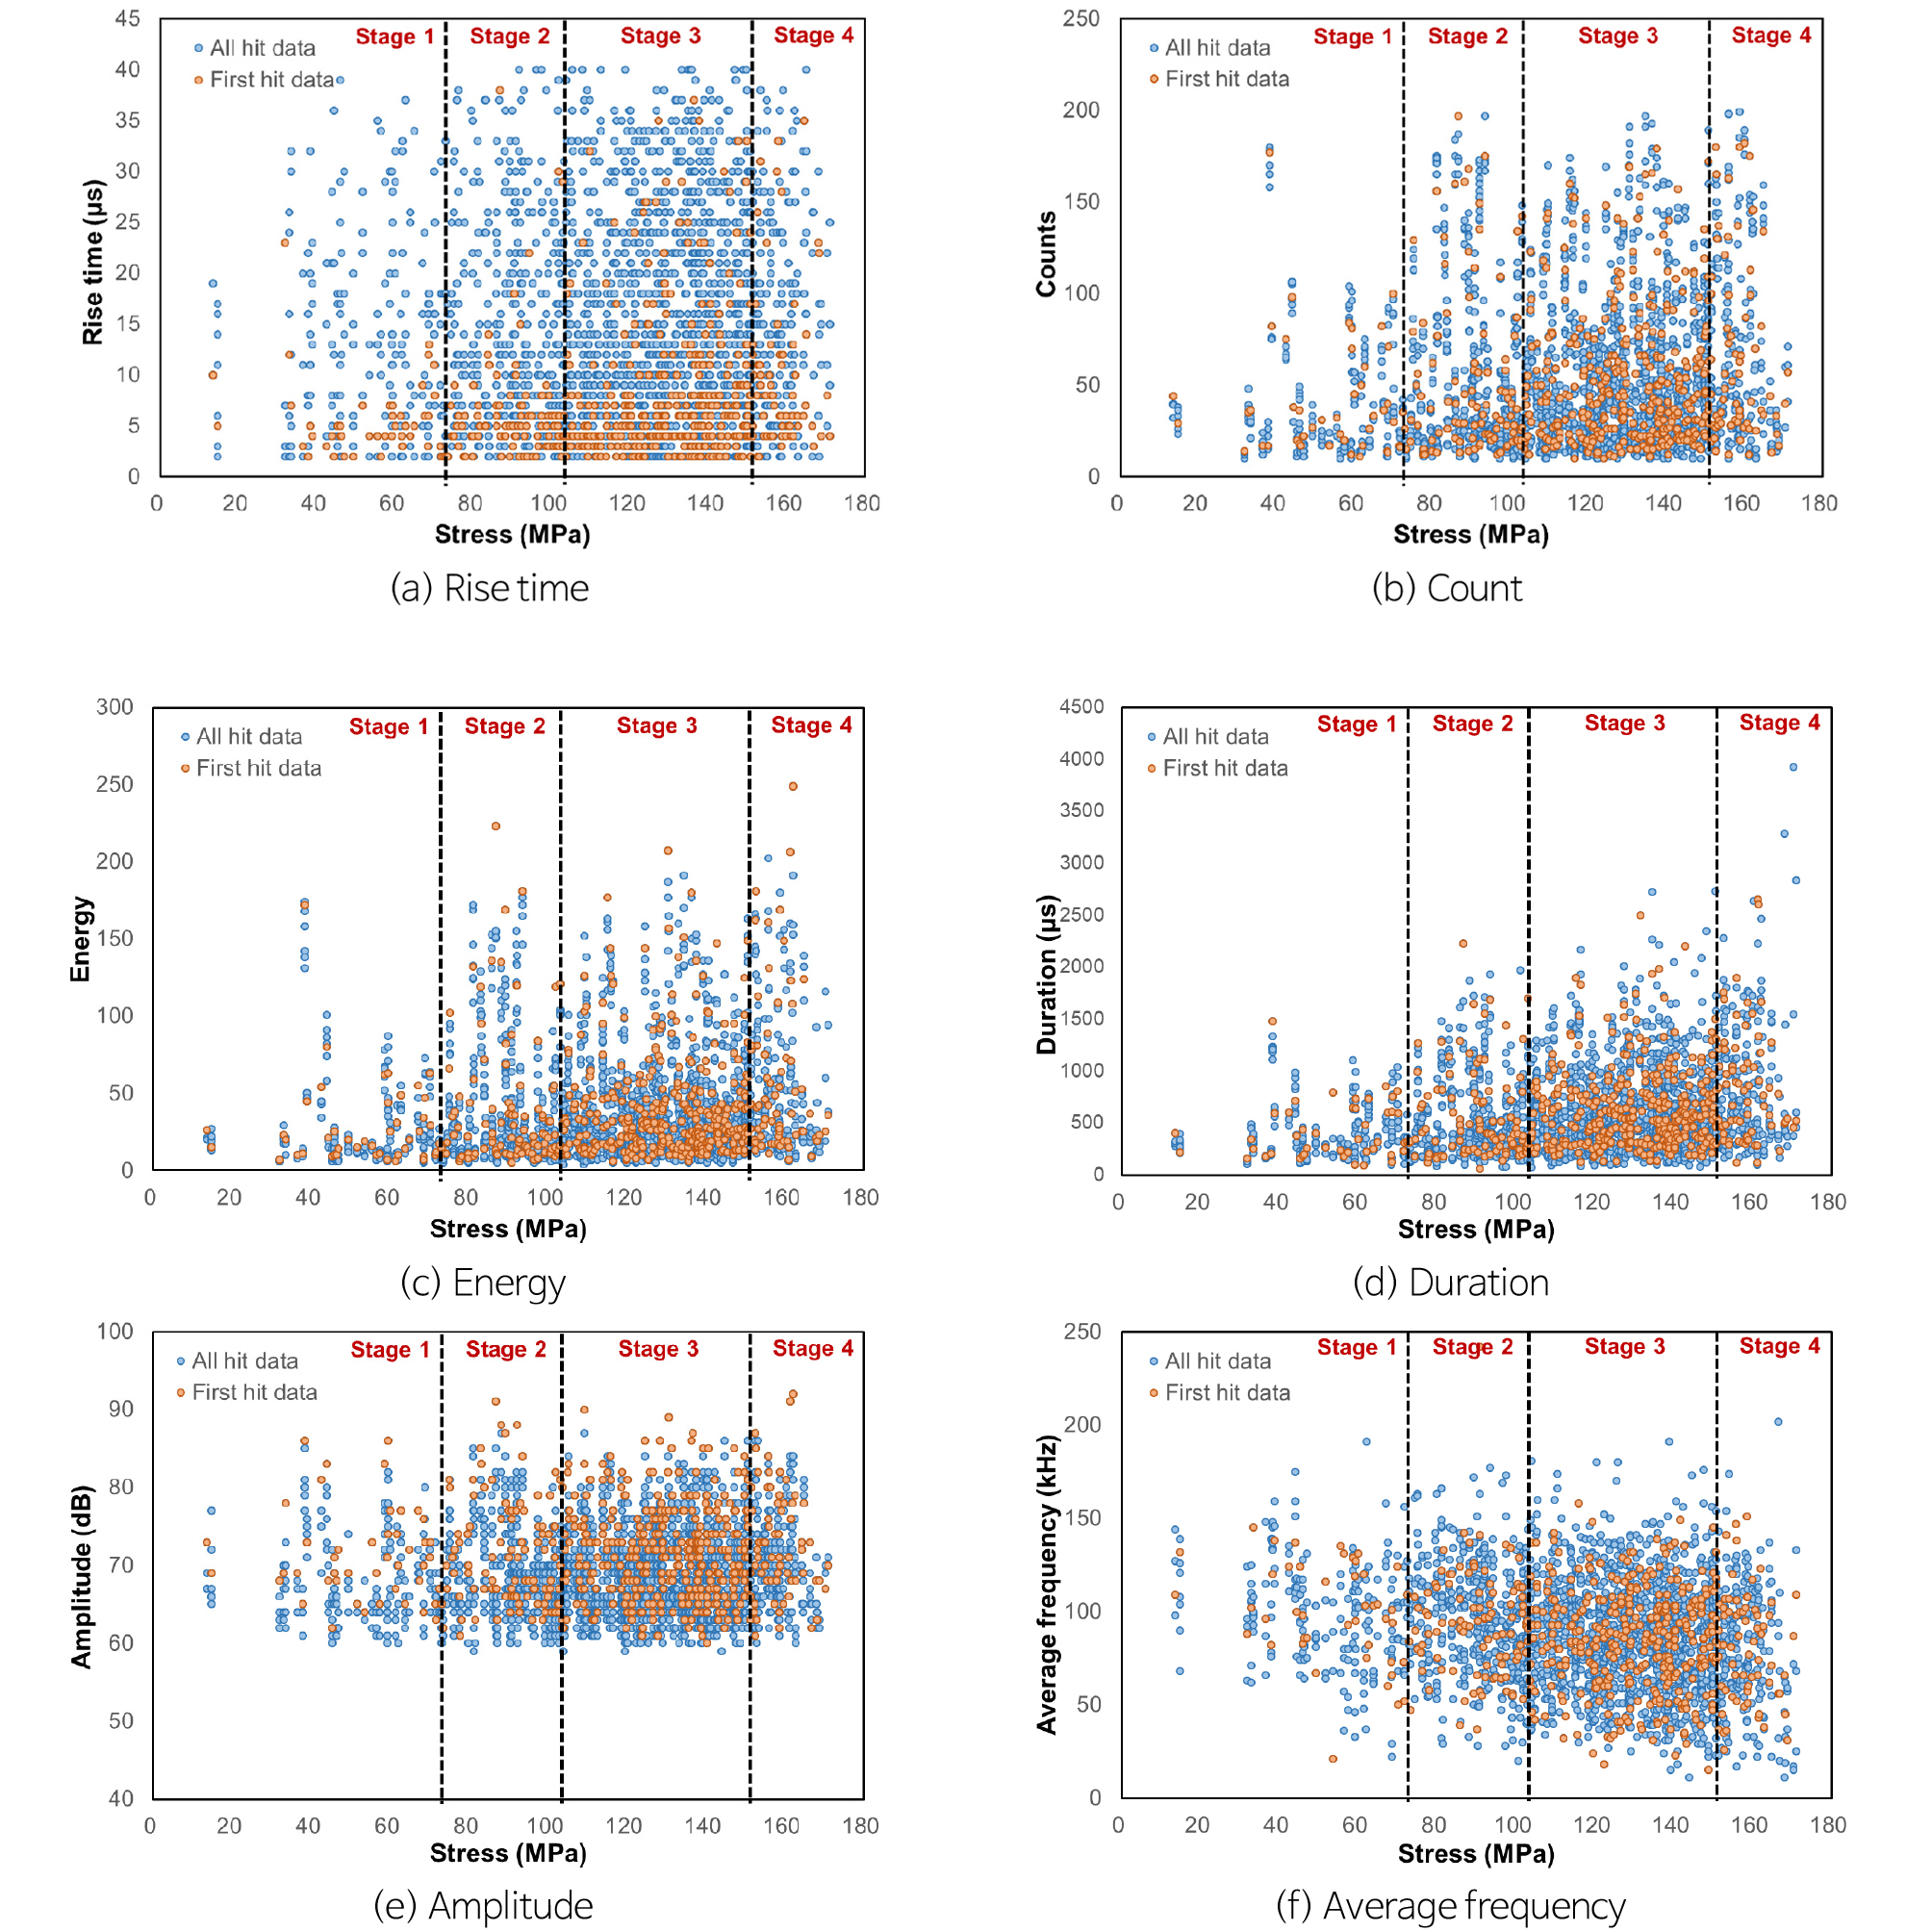
The AE parameters obtained for sample GR-1 are shown at the stresses where the AE signals were generated in Fig. 8. Although the AE parameter values are somewhat dispersed, all the parameters apart from the average frequency tend to have larger values when stress increased. This is evident from both the first hit and all hit data, although the dispersion is slightly larger for the all hit data. The rise time ranges from a minimum of 2 µs to a maximum of 40 µs. Although rise times of <20 µs are distributed at high density throughout the entire stress range, large rise times of >25 µs tend to gradually increase as the stress increases. These features are more evident in the first hit data than the all hit data (Fig. 8a). The count values range from 10 to 199 and show a clear increase as the stress increases in both the all hit and first hit data (Fig. 8b). The energy ranges from 4 to 249 and the duration varies from 62 to 3922 µs. The distribution characteristics of these two parameters by stress stage are similar to those of the count values (Fig. 8c–d). The amplitude ranges from 59 to 92 dB and shows a tendency to increase with the stress stage, but this trend is less clear than for the count, energy, and duration data (Fig. 8e). This likely reflects the fact that the unit of amplitude (dB) is expressed on a logarithmic scale. The average frequency ranges from 11 to 202 kHz and appears to decrease as the stress stage increases, unlike the other parameters. In addition, given that the average frequency is obtained by dividing the count by the duration, the frequency decrease with stress increase is mostly a function of the increase in duration.
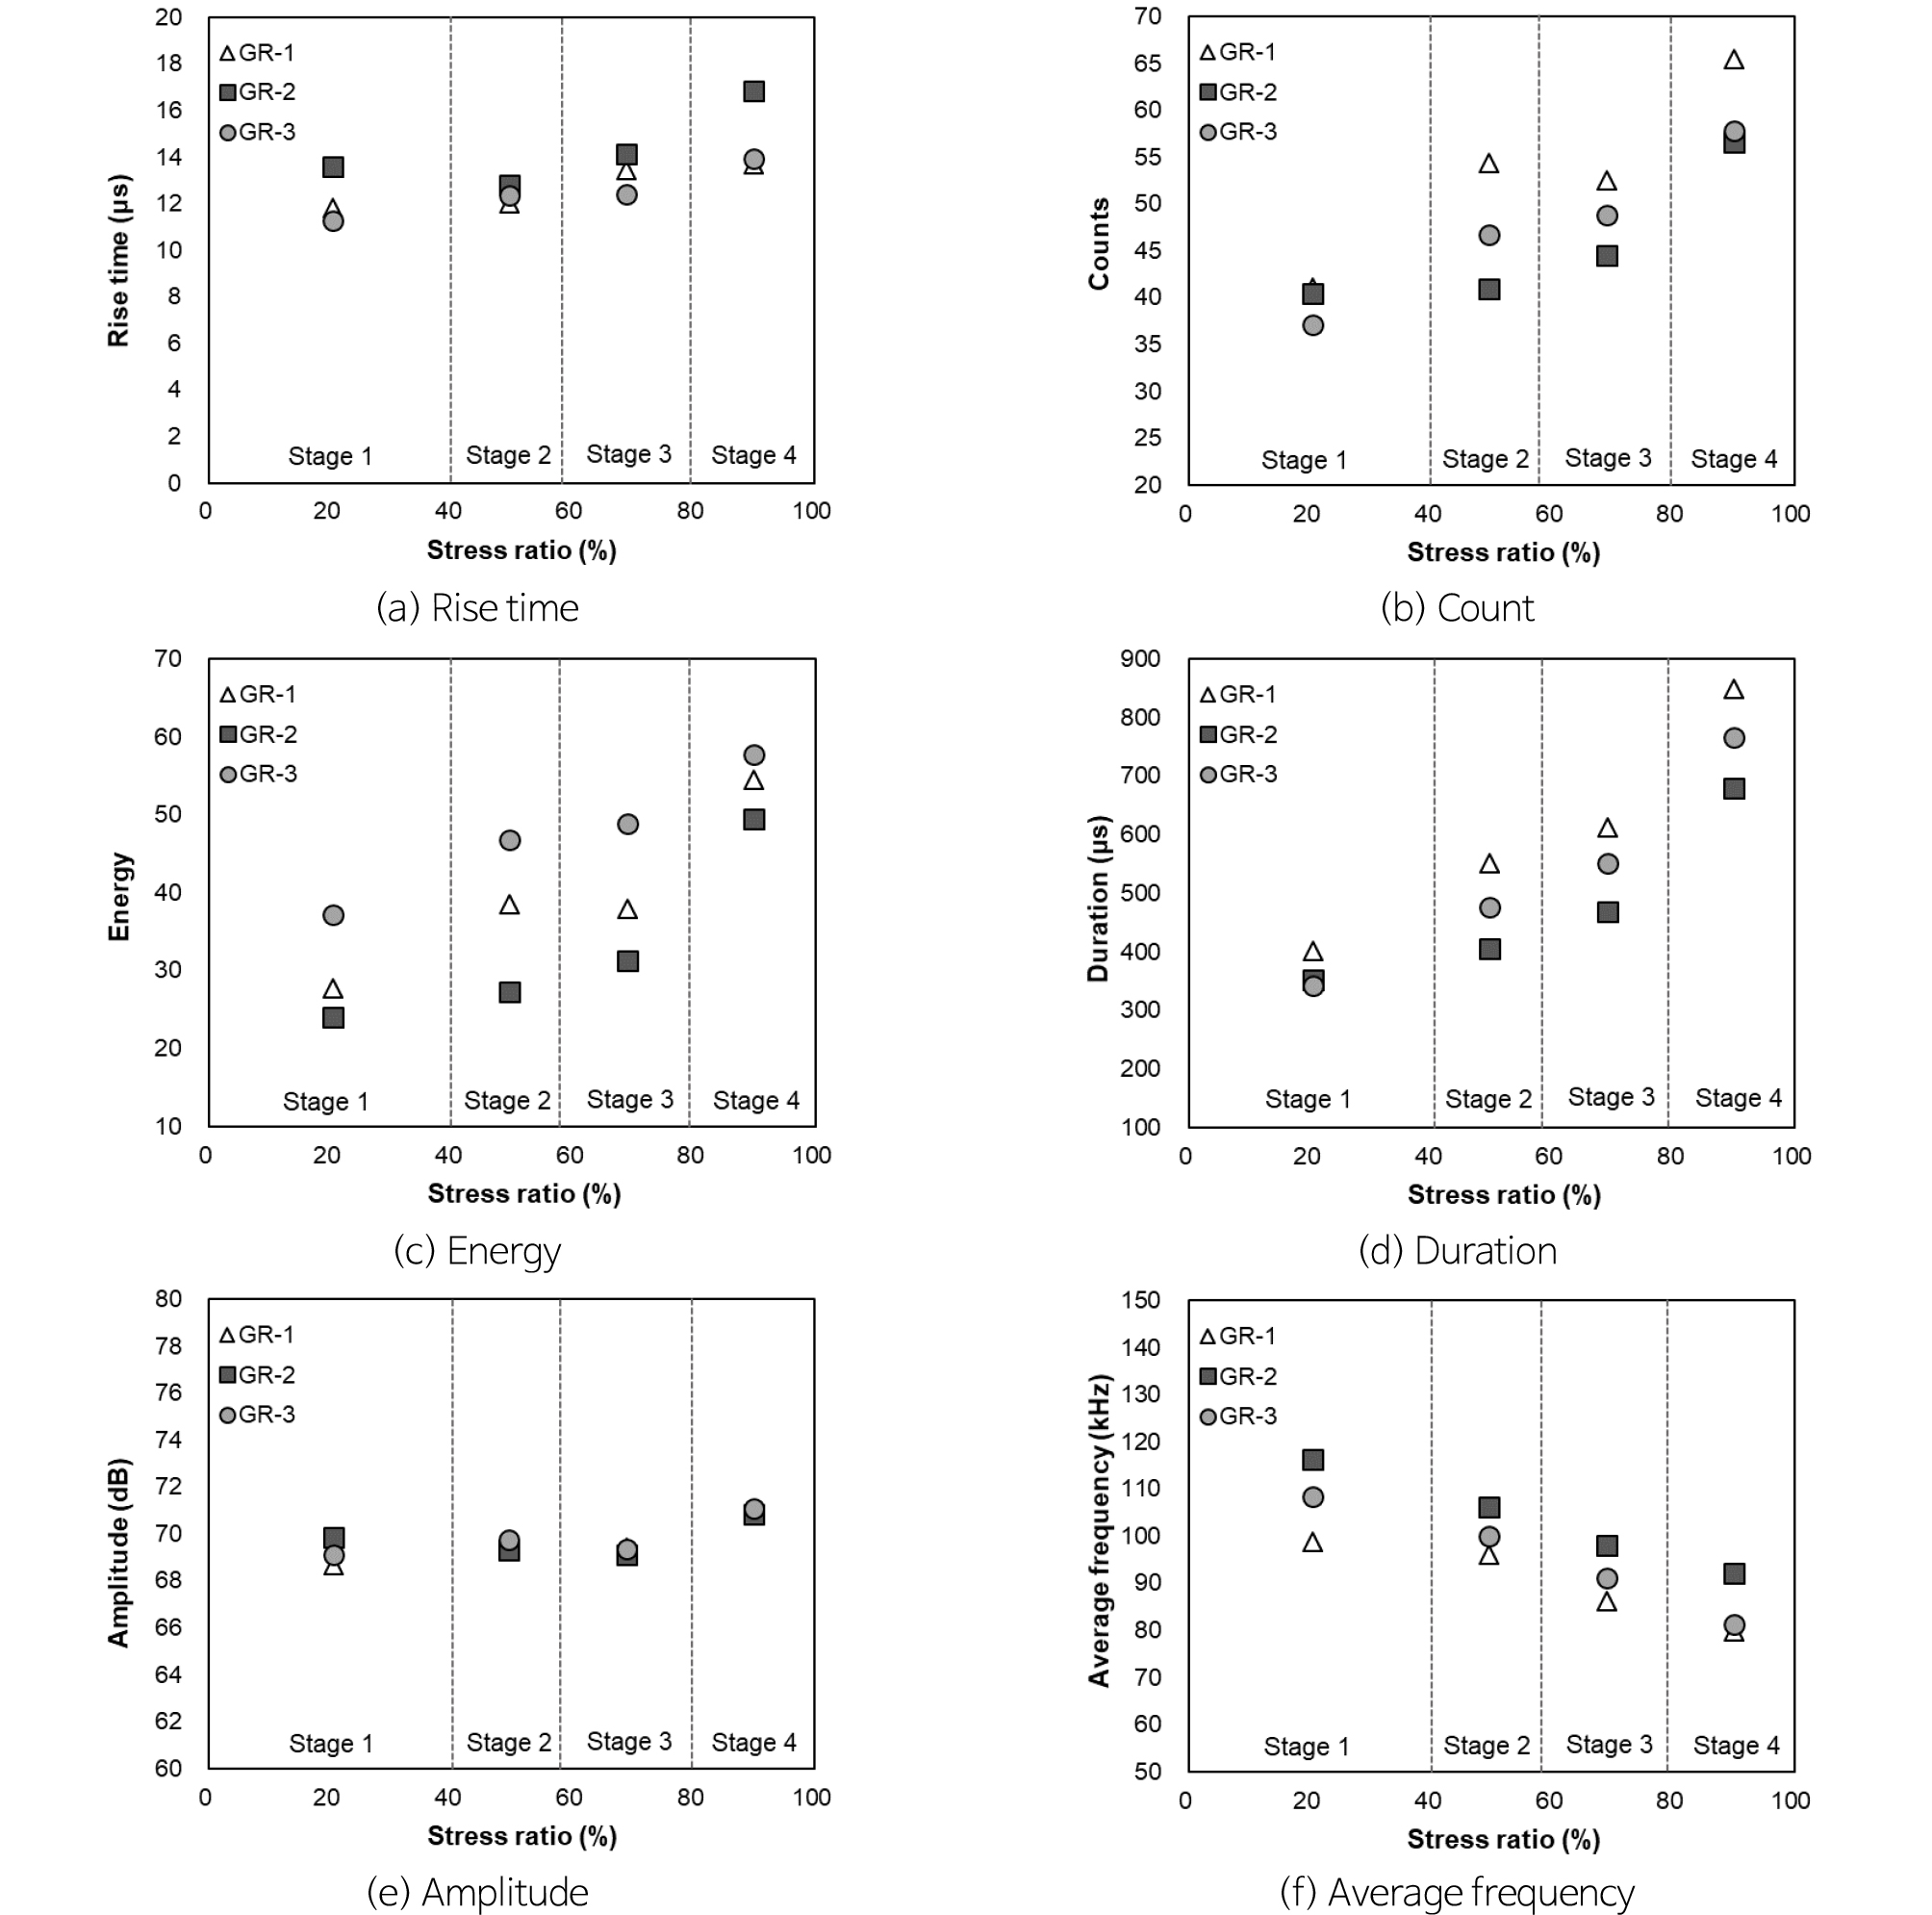
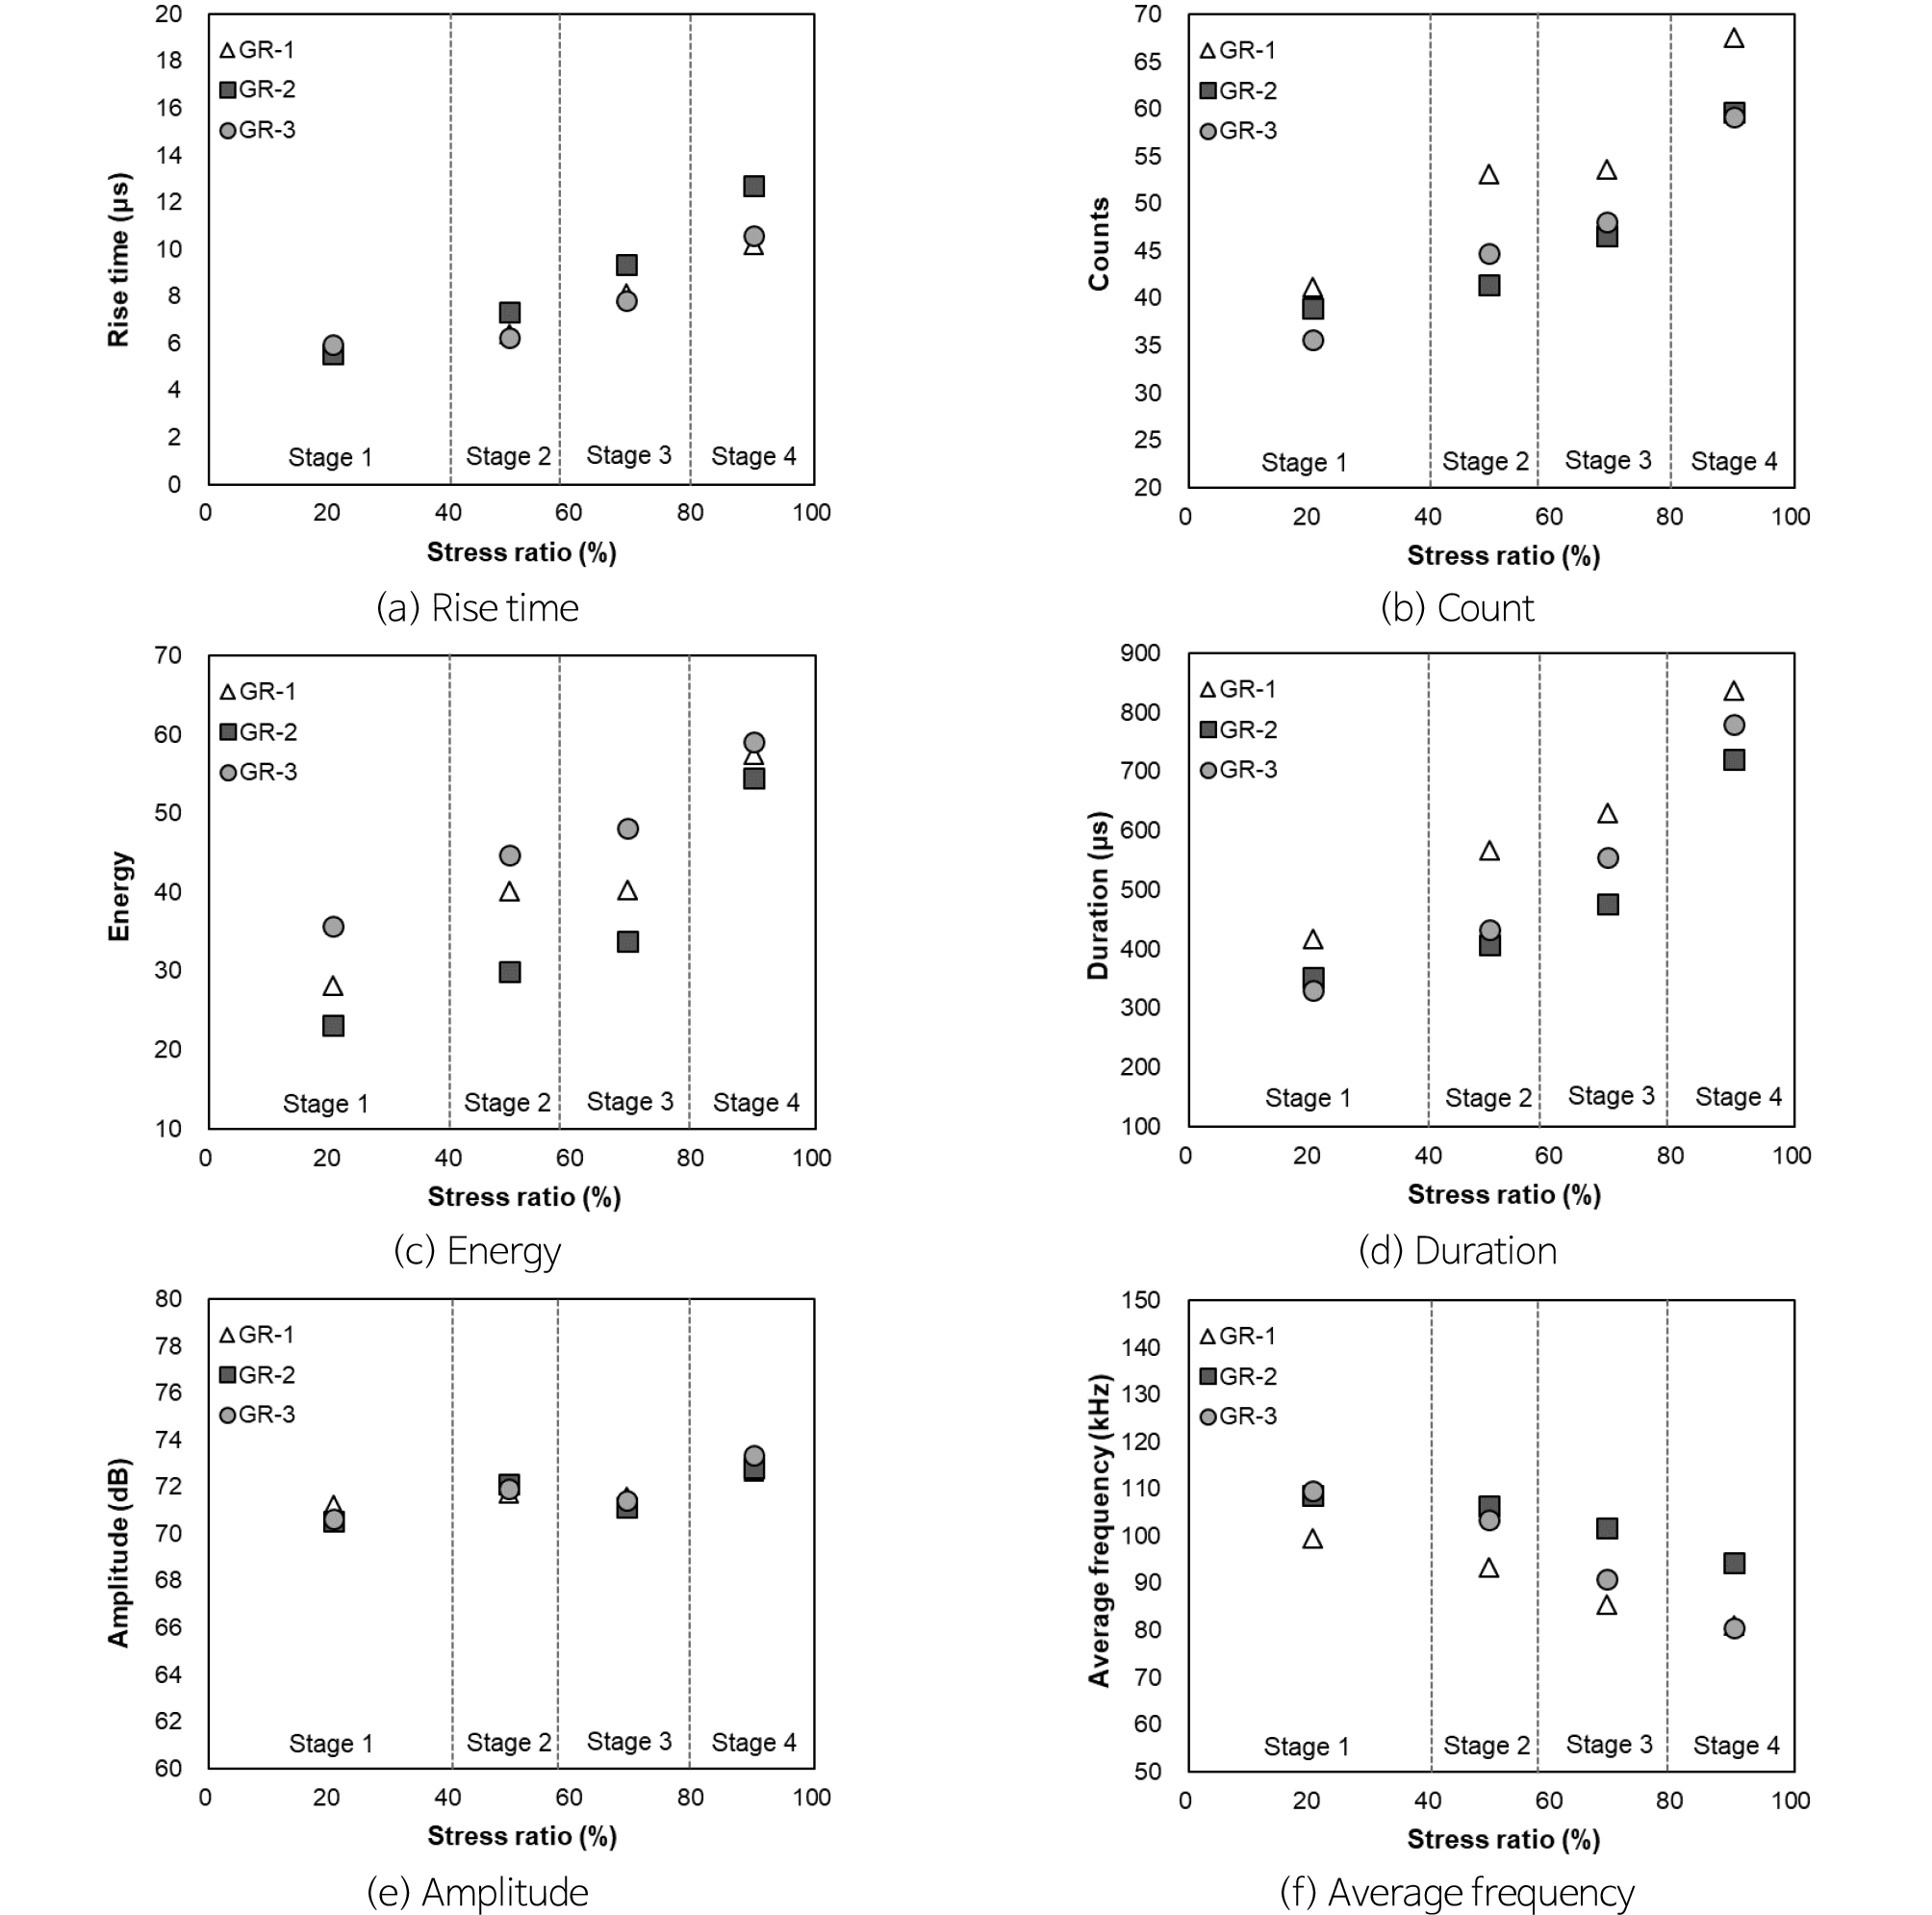
To examine the changes in AE parameters with stress levels more clearly, the averages of all AE hits and first hits in each stress stage are illustrated in Figs. 9–10. The average rise times of the all hit data are 11.3–13.6 µs in stage 1, 12.0–12.8 µs in stage 2, 12.4–14.2 µs in stage 3, and 13.7–16.9 µs in stage 4. Therefore, the average rise times increase as the stress stage rises for both the all hit and first hit data. The average rise times for the first hit data are 5.6–6.0, 6.3–7.3, 7.8–9.3, and 10.2–12.7 µs for the four stages, which are ~5 µs shorter than those of the all hit data, and show a clear tendency to increase with the stress stage (Figs. 9a and 10a). The rise time varies with the process of propagation of wave between the wave source and sensor, when waves are transmitted to the sensor. If the distance between the wave source and sensor is long, and the medium is poor, such that signal attenuation is severe, the rise time will generally be long. Therefore, the rise time from the first hit data is shorter than that of the all hit data because of attenuation. In addition, for two waveforms with a similar shape but different size, the rise time is proportional to the waveform size. Given that the waveforms of the AE signals generated when microcracks form in brittle rocks are generally similar in shape, the increases in rise time may be related to the increase in waveform magnitude. The average count values also increase as the stress stage rises, for both the all hit and first hit data (Figs. 9b and 10b). In the case of the average count, the values in the all hit and first hit data are similar, being 35.7–41.2 in stage 1, 41.0–54.3 in stage 2, 44.5–53.6 in stage 3, and 56.6–67.6 in stage 4. The average energy and duration values also increase as the stress stage rises, and the average values for the all hit and first hit data are quite similar. The average energy values are 23.1–37.2 in stage 1, 27.2–46.8 in stage 2, 31.3–48.9 in stage 3, and 49.5–59.1 in stage 4, with the variations amongst samples being larger than for the other parameters (Figs. 9c and 10c). The average duration values by stress stage are 330–416 µs for stage 1, 405–567 µs for stage 2, 469–630 µs for stage 3, and 679–849 µs for stage 4 (Figs. 9d and 10d). In general, the average rise time, count, energy, and duration in stage 4 are at least 95% higher than those in stage 1. Given that the duration is related to the entire length of the waveform and that the energy is related to the envelope of the waveform, these two parameters indicate the magnitude of the waveform (Fig. 2). Since the count also tends to be proportional to the duration, the count is larger when the waveform is larger. Therefore, the count, energy, and duration data indicate that larger AE signals occur at higher stress stages. The average amplitude values are 68.7–72.1 dB from stage 1 to 3, both for the all hit and first hit data, and show little change with stress (Figs. 9e and 10e). However, the average amplitudes in stage 4, when the samples fractured, are 70.8–73.3 dB, which are 1–2 dB higher than for the other stages. The increasing amplitude values with the stress stage rises reflect an increase in signal intensity. The average frequencies are similar for the all hit and first hit data, and show a tendency to decrease as the stress stage increases, which is unlike the trends exhibited by the other parameters (Fig. 9f and 10f). The average frequency values are 98.8–116.3 kHz in stage 1, 93.4–106.5 kHz in stage 2, 86.3–101.8 kHz in stage 3, and 79.7–94.5 kHz in stage 4. AE frequencies are affected by the type and length of cracks, such that the frequencies generated by short or tension cracks are relatively high, whereas those generated by long or shear cracks are relatively low. As such, the fact that the average frequency becomes lower as the stress stage rises shows that the crack lengths increase and relatively more shear cracks form as the stress rises.
Analysis of Microcrack Type using RA Values
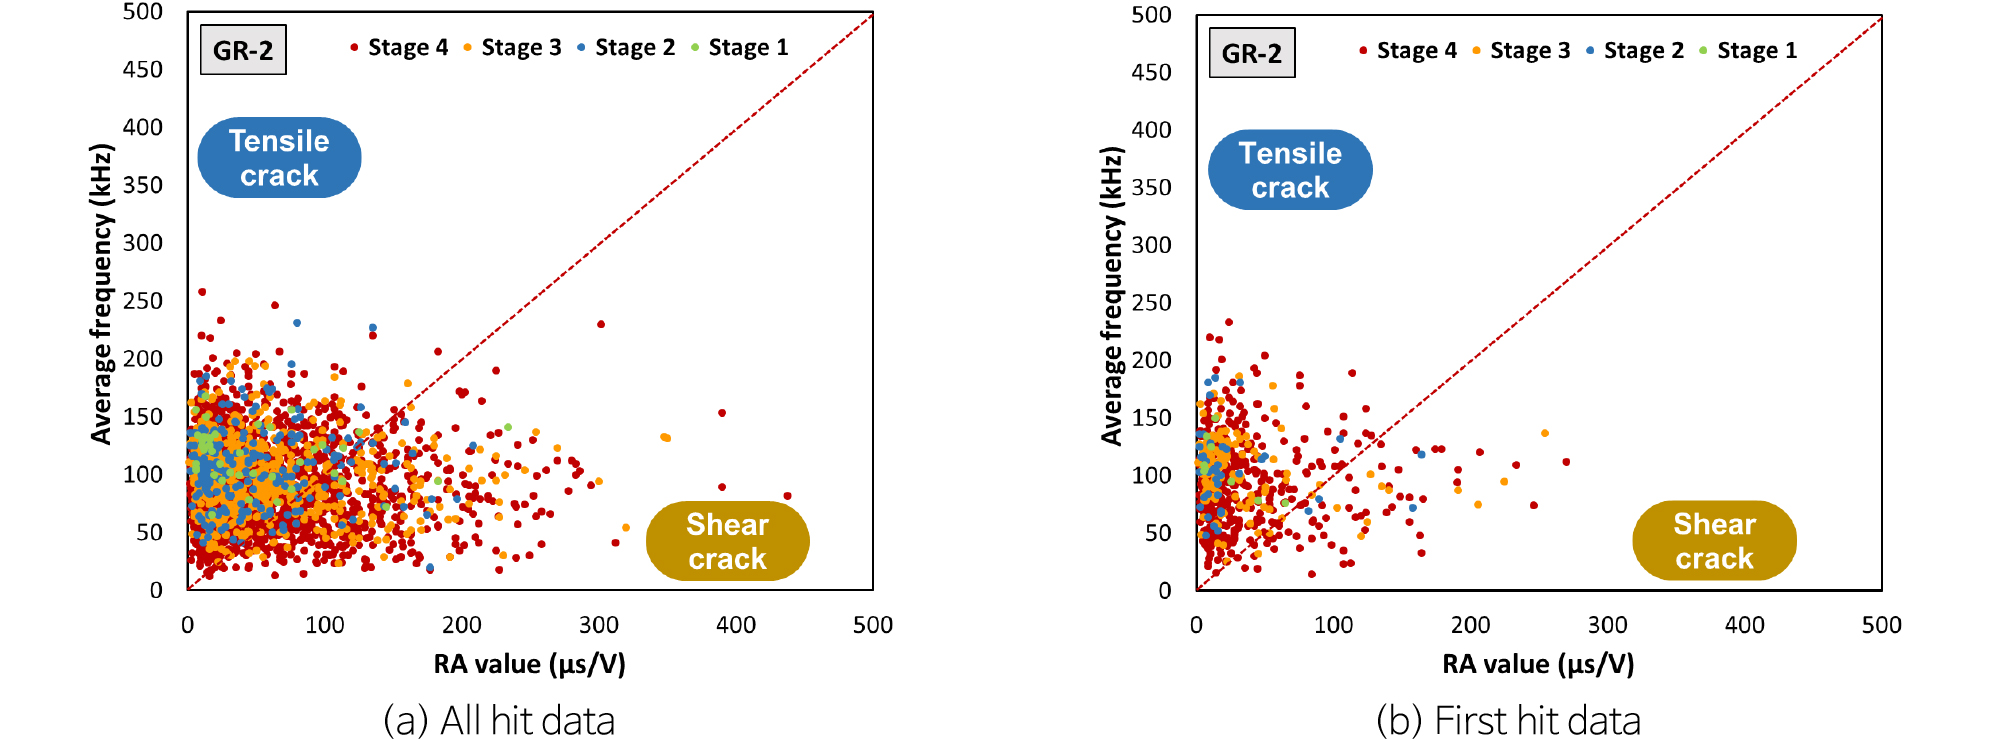
Ohno and Ohtsu (2010) and Wang et al. (2016) reported that tension and shear cracks could be distinguished using RA values, which are calculated by dividing the rise time by amplitude and plotted versus frequency data (Fig. 3). This classification method is based on JCMS-III B5706 (2003), and has been partially verified through four-point bending tests using concrete specimens and direct shear tests, but the standard for crack classification has yet to be clearly defined (Ohno and Ohtsu, 2010).
The relationship between RA value and average frequency for the Pocheon granite samples is shown in Fig. 11. Most of the AE signals measured in stages 1 and 2 appear to have been generated by tension cracks, because the stage 1 and 2 data are mostly located at the top left of the graph. Since the pre-existing microcracks in the rock are closed during these stress stages, rather than new cracks forming, the AE signals measured during these stages are generated when the microcracks vertical to the loading axis were closed and are the same form as the signals generated when tension cracks were formed. However, some of the stage 3 and 4 data are plotted in the bottom right of the graph in Fig. 11. Given that tension cracks form in a direction parallel to the applied load axis, particle boundary cracks (a type of shear crack that forms due to sliding particle boundaries) form and connect the tension cracks that had already formed in these stress stages (Brace et al., 1968). As such, AE signals from the tension and shear cracks are simultaneously detected. These results are consistent with those of Ohno and Ohtsu (2010) and Wang et al. (2016), indicating that shear cracks begin to form when the sample starts to be damaged.
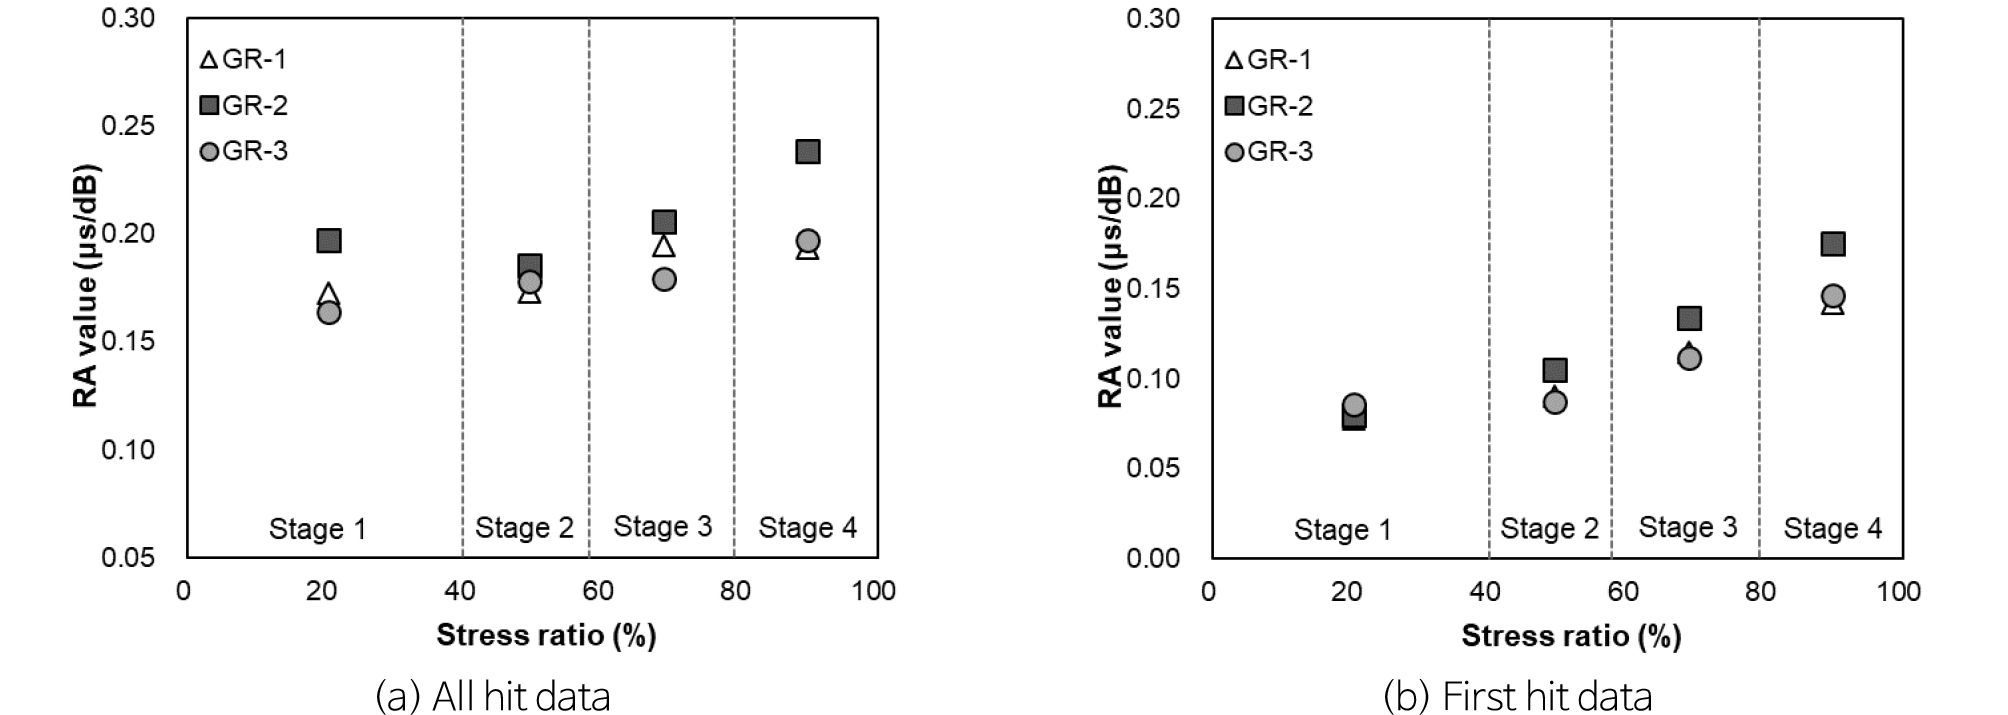
The average RA values of the granite samples are plotted versus the damage stage (Fig. 12). For the all hit data, the average RA values in stages 1 and 2 are similar (0.164–0.197). The average RA values in stage 3 and 4 are 0.179–0.206 and 0.197–0.239, respectively, indicating that the average RA values increase gradually with the stress stage (Fig. 12a). The average RA values for the first hit data are 0.078–0.086 in stage 1, 0.088–0.105 in stage 2, 0.111–0.134 in stage 3, and 0.142–0.175 in stage 4, which are ~0.05 lower than the all hit data values. This indicates that average RA values increase as the stress stage rises, and this trend is clearer for the first hit data than the all hit data.
Conclusions and Discussion
To investigate microcrack formation during rock damage, uniaxial compression tests on Pocheon granite were conducted to measure strains and AE signals with increasing stress level. The characteristics of AE parameters were analyzed for each damage stage. Crack volumetric strain and volumetric stiffness curves were calculated from the measured strains to determine the crack closure (𝜎cc), crack initiation (𝜎ci), and crack damage (𝜎cd) stresses. Based on these damage threshold stresses, the rock damage state was divided into four stages. Stage 1 involves the closure of pores or existing cracks in the samples, and the stress corresponds to 0–41% of the UCS. Stage 2 is an elastic deformation stage in which the stress is 41–58% of the UCS. During stage 3, new cracks begin to form, corresponding to a stress of 58–80% of the UCS. During stage 4, cracks connect to each other and actual fractures form, corresponding to a stress of >80% of the UCS.
In the AE measurements conducted during the uniaxial compression tests, 2745–2853 AE hits were recorded and 562–620 AE events were analyzed. In general, at least 75% of the entire AE hits and events occurred in stages 3 and 4 when new cracks began to form and the samples were fractured. The rise time, count, energy, and duration tended to increase gradually as the stress stage rose and, in particular, the rise time, energy, and duration showed increases in average values of at least 95% in stage 4 as compared with stage 1. The duration and energy reflect the waveform magnitude, and the count is higher when the waveforms are large, because the count are proportional to the duration. Therefore, larger AE signals occurred in higher stress stages. The amplitude showed little change in stages 1 to 3, but increased slightly in stage 4. Given that the amplitude reflects the signal intensity, the amplitude increased as the stress stage rose. The average frequency tended to decrease as the stress stage rose, in contrast to the other parameters. The frequency of the AE signals is relatively high when the signals are generated from short or tension cracks, and relatively low when generated from long or shear cracks. Therefore, as the stress stage rose, the cracks become longer and more shear cracks formed. The types of cracks in each stress stage could be estimated from the relationship between RA values and average frequencies. The AE signals generated in stages 1 and 2 mostly had low RA values and high frequencies, indicating that tension cracks were predominant. However, the AE signals generated in stages 3 and 4 included some that had high RA values and low frequencies, indicating that not only tension cracks but also shear cracks formed during these stages. These results are consistent with those of previous studies indicating that shear cracks begin to form when the sample starts to become damaged(Brace et al., 1968; Ohno and Ohtsu, 2010; Wang et al., 2016). The AE parameters were analyzed with two different methods: using all the measured hit data and using only the first hit data. The analysis results from the two methods are similar. However, for the rise time and RA values, the changes with increasing stress stage were clearer when the first hit data were used. The results indicate that in the case of rocks under stress, the AE parameters change according to the damage state, and this makes it possible to quantify the rock damage state. This technique is applicable to the monitoring of bedrock stress using AE sensors.
