Introduction
LandScient_EWS
Background
Description of the Software
Simulation Method
Implementation in a Tropical Watershed of the Colombian Andes
Discussion
Conclusion
Introduction
Landslides represent a significant global hazard, occurring across diverse terrains with varying slopes and resulting in severe damage to both human lives and properties (Froude and Petley, 2018; Aristizábal and Sánchez, 2020). Over recent decades, extensive research has focused on predicting the temporal and spatial occurrence of landslides, yielding numerous methodologies related to landslide susceptibility, hazard assessment, risk evaluation, monitoring techniques, threshold definition, and runout analysis within the scientific literature (Intrieri et al., 2019).
These studies have provided invaluable insights into landslide forecasting, a pivotal aspect in the development of landslide early warning systems (LEWS) (Intrieri et al., 2013). However, despite this wealth of knowledge, many highly affected countries still lack functional LEWS, primarily due to the intricate scientific, technological, and political challenges involved in their integration (Guzzetti et al., 2020).
The scientific literature reveals a wide array of methodologies employed by existing LEWS worldwide for landslide hazard assessment and prediction/forecasting approaches (Park et al., 2019). Some systems utilize contact-sensing techniques with instruments installed on hillslopes (Uchimura et al., 2010; Tao et al., 2019; Yang et al., 2019; Prakasam et al., 2021), while others rely on remote sensing technologies such as Spaceborne Optical Very High Resolution and ground-based Interferometric Synthetic Aperture Radar (SAR) (Casagli et al., 2017; Mondini et al., 2021).
One commonly employed approach involves the definition of thresholds, particularly rainfall intensity-duration thresholds, cumulated rainfall, antecedent precipitation, and others (Guzzetti et al., 2007; Intrieri et al., 2019). These thresholds are crucial for temporal prediction and forecasting of landslides. The feasibility of implementing these thresholds in LEWS depends on widespread ground instrumentation of rain gauges across various territories and the increasing accuracy of precipitation forecasts (Intrieri et al., 2019). Real-time data collected from rain gauges, typically installed at multiple locations within a study area of interest and operating at minute intervals, enable the real-time evaluation of exceedances from pre-established thresholds (Piciullo et al., 2018).
In technological terms, integrating rainfall thresholds and other types of thresholds with real-time meteorological data within open-source software is crucial for LEWS. Developed in PHP, LandScient_EWS aims to achieve this by enabling real-time calculation and graphic representation of landslide advisory levels at various scales, including regional, basin, and hillslope. This article provides an overview of the software’s key features and offers practical guidance for understanding its functionality and implementation.
Our study introduces LandScient_EWS, a novel software tailored for real-time monitoring of rainfall thresholds in LEWS. The main objective of this research is to introduce and validate LandScient_EWS, emphasizing its role in improving landslide risk management. Developed by the authors, LandScient_EWS addresses the pressing need for effective early warning systems in landslide-prone regions, particularly in tropical mountainous areas like the Colombian Andes. At its core, LandScient_EWS facilitates the study of various rainfall characteristics that may trigger landslides, including critical conditions that are often overlooked or challenging to quantify. This novel approach allows for the comparison of predefined thresholds with real rainfall data in a manner that is both efficient and user-friendly. By enabling the identification of critical conditions that may lead to landslides, LandScient_EWS represents a significant contribution to landslide risk management, offering a new paradigm for assessing and responding to landslide hazards in real-time scenarios. Through a comprehensive case study in Medellín, Colombia, we demonstrate the practical application and reliability of LandScient_EWS, showcasing its potential to enhance the efficiency and effectiveness of LEWS.
LandScient_EWS
Background
The theoretical background of LandScient_EWS lies in addressing the complex task of developing LEWS in regions prone to landslides. In many affected countries, the absence of effective LEWS is attributed to the intricate integration of scientific, technological, and political aspects. To fill this gap, we developed LandScient_EWS, a PHP program designed to integrate rainfall thresholds and real-time measured rainfall data within an open-source framework. This software allows for the calculation and graphical representation of landslide warning levels in real-time at various spatial scales, including regional, basin, and hillslope levels.
Description of the Software
LandScient_EWS is a PHP software specifically designed to compare real-time rainfall data obtained from rain gauges or other sensors with predefined rainfall thresholds crucial for landslide detection. The software is adept at issuing timely landslide warnings and determining real-time advisory levels. Importantly, the software is architected to accommodate not only rainfall thresholds, but also various other types of thresholds associated with instrumented hillslopes or basins, including deformations, pore water pressures, or suction. This adaptability ensures comprehensive monitoring and warning capabilities for landslide events.
Fig. 1 provides a visual representation of the software’s logical framework through a detailed flowchart. The initial version of the program focuses on rainfall intensity and duration thresholds while laying the groundwork for future releases to incorporate additional threshold types. The current functionalities include:
• Inputting data related to rain gauges: This involves entering the location coordinates of multiple rain gauges, specifying the temporal resolution for receiving rainfall data from each sensor, and optionally providing historical rainfall data from each rain gauge. Real-time rainfall data received from the rain gauges is then integrated into the software’s database management system.
• Inputting rainfall thresholds: Various types of thresholds, such as antecedent, cumulative, or mean intensity/duration thresholds, can be defined. Each threshold is associated with the applicable study area location, and its equation is specified (e.g., parameters of a power-law equation for intensity-duration thresholds).
• Retrieving rainfall data from the database management system to perform real-time calculations for rainfall events. The software offers predefined protocols to identify the onset of a rainfall event, though users have the flexibility to adjust them. Subintervals within rainfall events are treated as independent events, enabling the determination of advisory levels when compared to the defined thresholds.
• Comparing rainfall events with corresponding thresholds for different monitored study areas. The software calculates critical thresholds for subintervals of the rainfall events (e.g., critical mean intensities for durations within the entire rainfall event).
• Graphically representing the advisory level of each study area by selecting the most critical condition of real-time rainfall in comparison with the threshold. For instance, the advisory level may be based on the last 60 minutes of a longer rainfall event. All rainfall events and their critical advisory levels are stored in the database management system and can be summarized for historical periods as desired by the user.
LandScient_EWS is a web application crafted to integrate data collected from sensors measuring meteorological events with pre-established thresholds. Its purpose is to determine advisory levels and issue early warnings for potential natural threats. Operating through a user-friendly web interface, the software enables users to load a rainfall database and conduct simulations, thereby facilitating real-time classification of rainfall events and delivering valuable insights.
Simulation Method
LandScient_EWS leverages PHP, Laravel framework, and MySQL database for efficient information storage and management. The software employs JavaScript, jQuery, SASS, and Bootstrap to create an intuitive and interactive user interface, ensuring ease of use for stakeholders involved in landslide risk management. LandScient_EWS is open source. Interested users can access the software at the following link: https://landscient.com/software/landscient_ews/. The current version available for download is 1.0.
The core functionality of LandScient_EWS is demonstrated through a Laravel controller method. This method simulates rain data and computes corresponding advisory levels based on predefined thresholds. The simulation process involves detecting the start and end of rain events, calculating rainfall intensity and duration, and determining the advisory level for each data point. Subsequently, the software stores the simulated data and advisory levels in a database for further analysis and visualization.
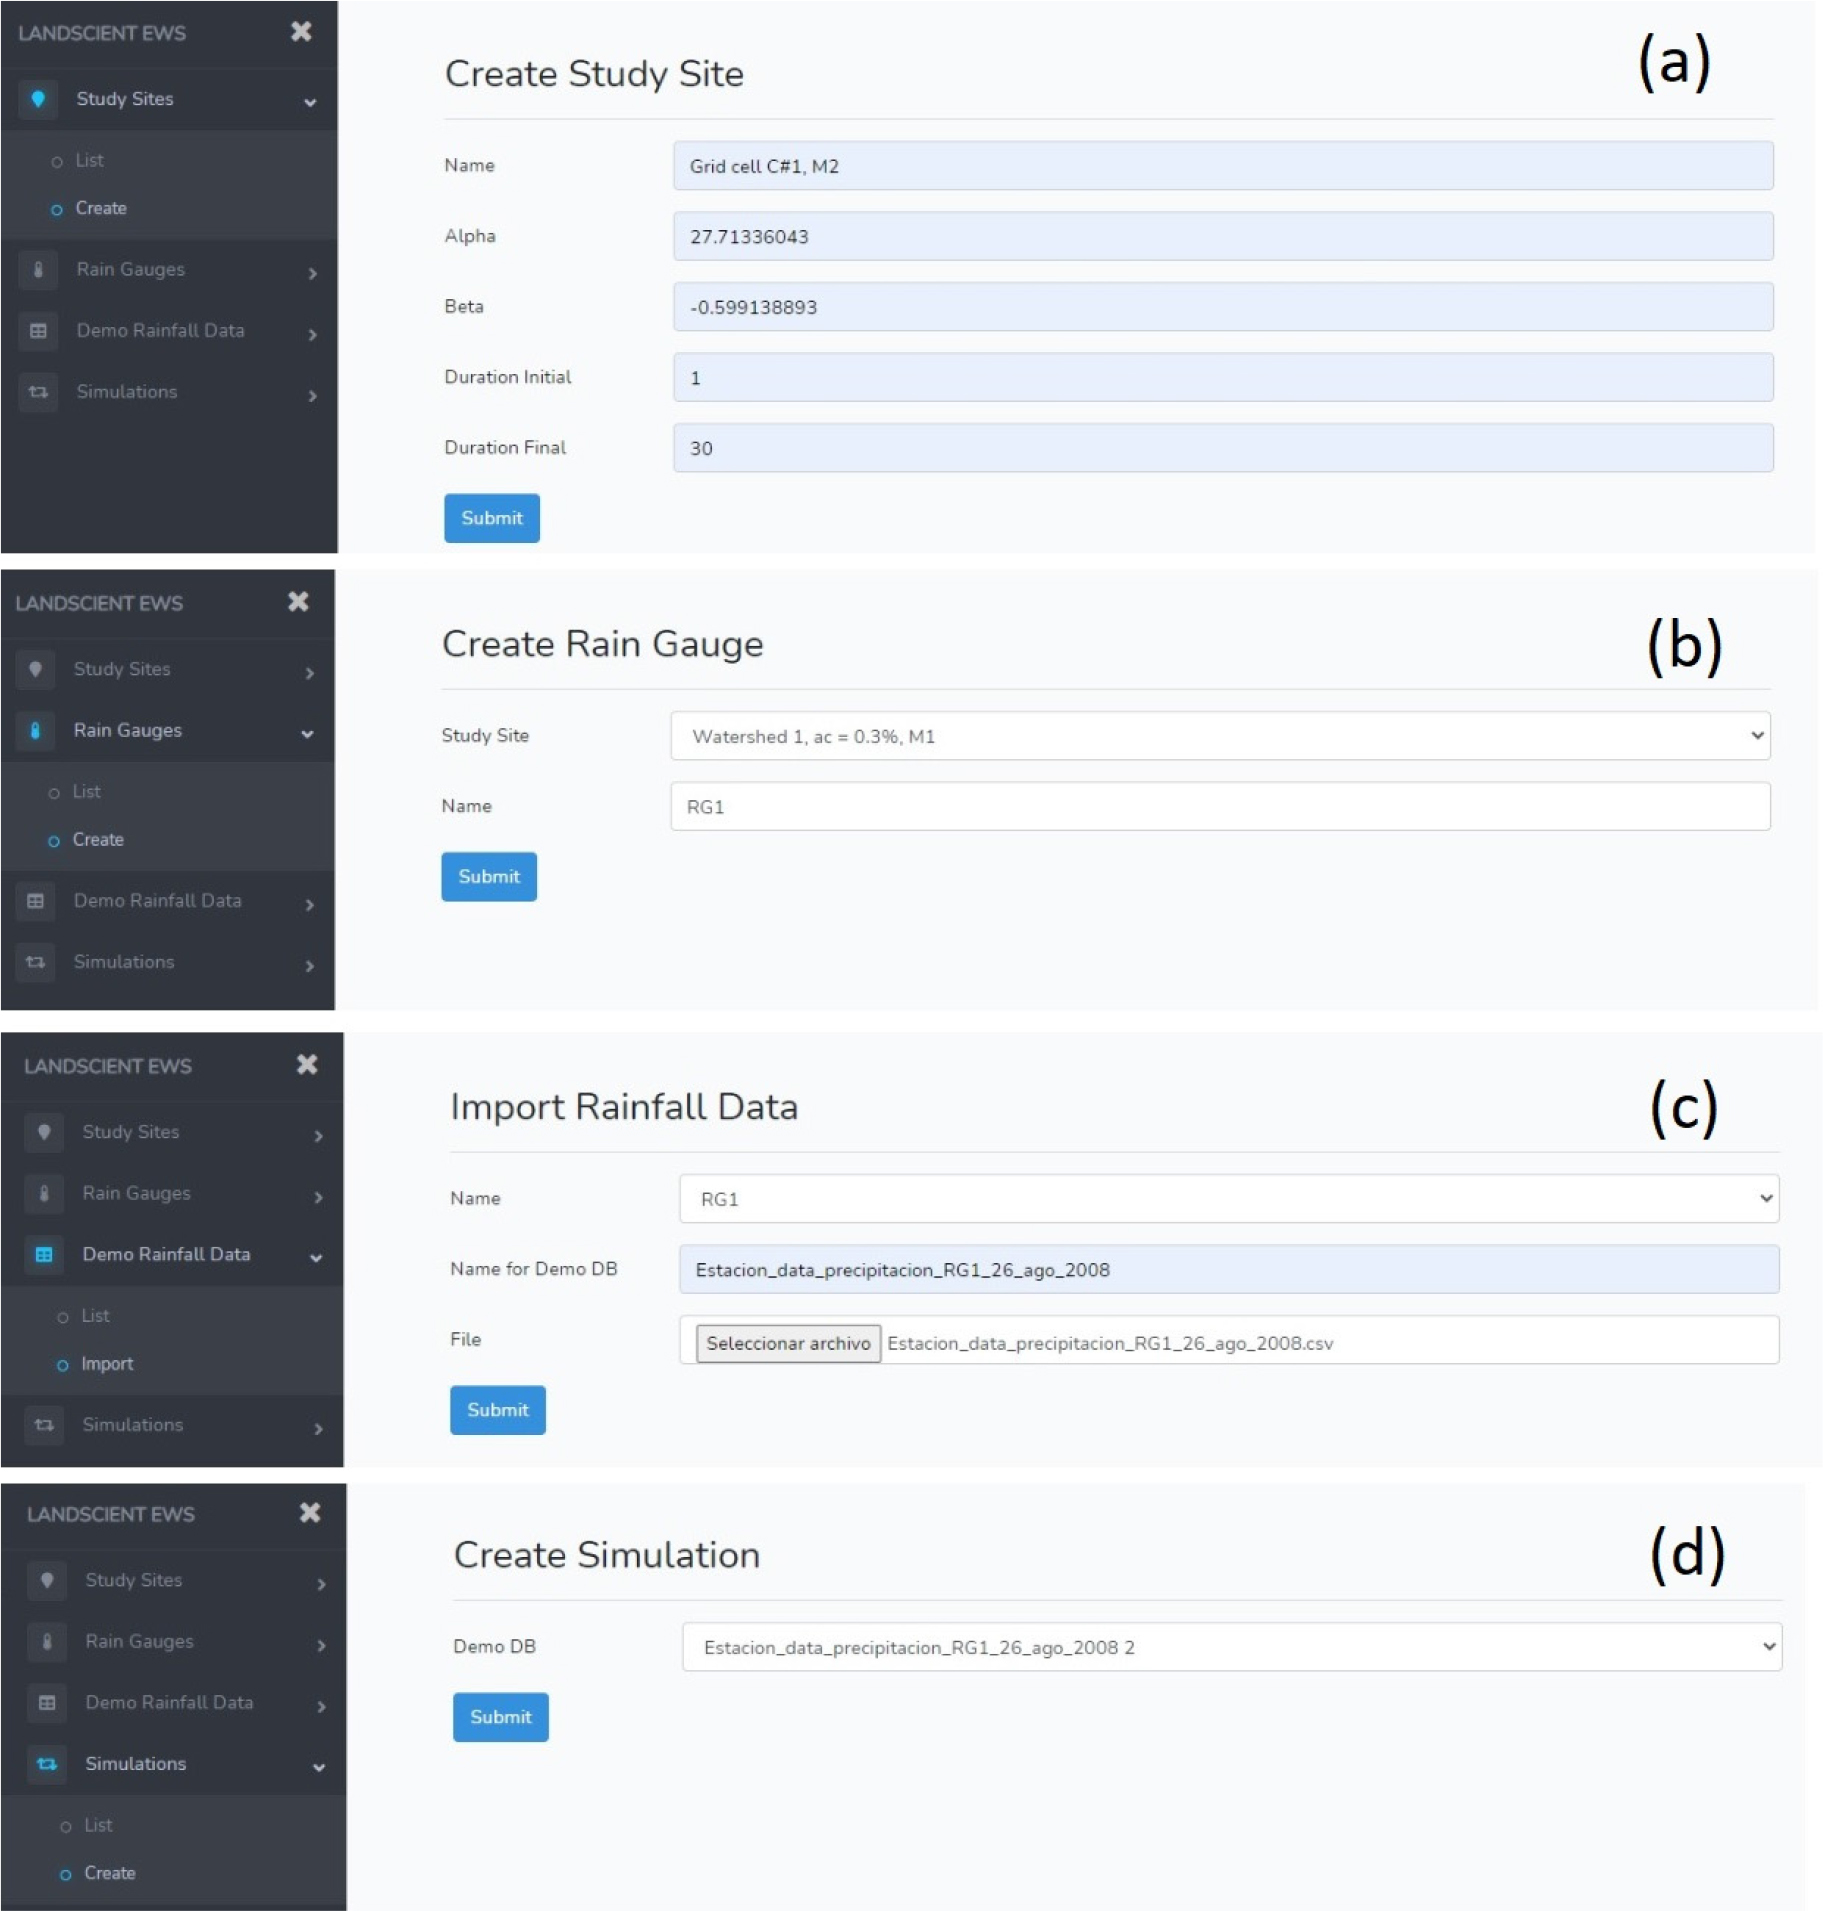
In addition to the theoretical background, LandScient_EWS offers practical functionalities across four modules: Study Sites, Rain Gauges, Demo Rainfall Data, and Simulations. These modules enable users to create study sites, define rain gauges, import rainfall data, and conduct real-time simulations to assess landslide risk levels. Appendix 1 provides an overview of the software’s requirements and functionalities.
Rainfall Intensity and Duration Events
The determination of the start and end of a rainfall event is pivotal for the real-time calculations conducted by the software. By default, the software identifies the onset of a rainfall event when the intensity (I) reaches 4 mm/h for 10 minutes. Similarly, the same intensity threshold of I < 4 mm/h marks the conclusion of the event, necessitating a sustained period of 6 hours. This approach to defining rainfall events aligns with the methodology proposed by Jan and Lee (2004), as well as similar criteria utilized in studies such as Chang et al. (2017, 2021), and Tiranti and Rabuffetti (2010). Nonetheless, users retain the flexibility to adjust these settings for the initiation and cessation of rainfall events within the software.
Rainfall Thresholds
As previously mentioned, the software aims to incorporate various types of thresholds. In its initial version, the focus lies on rainfall intensity and duration thresholds, utilizing a commonly employed power-law Eq. (1).
where, I is the mean intensity of the rainfall event, D is the duration, α is the scale parameter and β the shape parameter from the power-law curve (threshold). The thresholds can be applicable at a small basin (≤1 km2) or single grid cell scale, as defined by methodologies used in the present work. For this specific threshold equation, the duration range for which the threshold is applicable must be defined. This range encompasses an initial duration (Di) and a final duration (Df) of the rainfall event, against which a comparison with the threshold will be conducted, and advisory levels will be determined.
Thresholds can be incorporated into the software either concerning a study site (where rain gauges or sensors will be associated) or concerning a specific rain gauge (where the location of the study area, such as a basin or a particular hillslope, will be associated). A study site of interest can be monitored using two or more rain gauges, and their data can be partially or fully applicable to the study area. The program accommodates these possibilities, and for overlapping areas, the most critical condition is selected to determine the advisory level. However, careful consideration is necessary when dealing with the applicability of thresholds, particularly when the study site is larger (e.g., rainfall intensity-duration thresholds at the basin scale) than what may be deemed suitable for the measurements obtained from the rain gauge.
Real-Time Analysis
Initially, the temporal resolution (tr) of the advisory levels must be defined. Several calculations need to be executed, and depending on the number of monitored study areas, processing capacity, and temporal resolution of the rainfall data received from the rain gauges, the periodicity to calculate and present the advisory levels would vary. Ideally, a temporal resolution of 1 minute is considered optimal for a LEWS.
For a specific rain gauge, once a rainfall event has commenced, the mean intensity of the event (Ievent) is calculated at each tr period and compared with the threshold equation corresponding to the rainfall duration from a specific study site (monitored with the rain gauge). The comparison of the critical intensity (Ic) will be conducted with either the intensity of the entire event or intensities from subintervals of the rainfall event. The periodicity for the subintervals is determined by tr.
For the i study site, the critical intensity (Ic) will be calculated using Eq. (2).
where, αi (scale) and βi (shape) represent the power-law parameters of the threshold, and the duration D applies for the whole event or subintervals. In both cases, it is ensured that comparisons and advisory levels can be determined for durations within the initial (Di) and final (Df) durations for which the threshold is applicable (Di ≤ D ≤ Df). To achieve this, the real-time comparison (including all calculations) will be conducted for times within this duration range.
Advisory Levels
The number of advisory levels and their thresholds can be customized based on specific requirements, such as the type of threshold and the user’s risk tolerance or acceptability. In the initial setup, the program employs 5 advisory levels for rainfall intensity and duration thresholds (Eq. (1)). Table 1 presents the conditions/ranges of the advisory levels and suggests primary actions, adapted from Wei et al. (2018). To determine the real-time advisory level, the PHP code calculates the intensity ratio (IR), which represents the ratio between the intensity (I) and the critical intensity (Ic), as shown in Eq. (3).
Table 1.
Advisory levels, conditions, and suggested actions for a LEWS (LandScient_EWS)
Implementation in a Tropical Watershed of the Colombian Andes
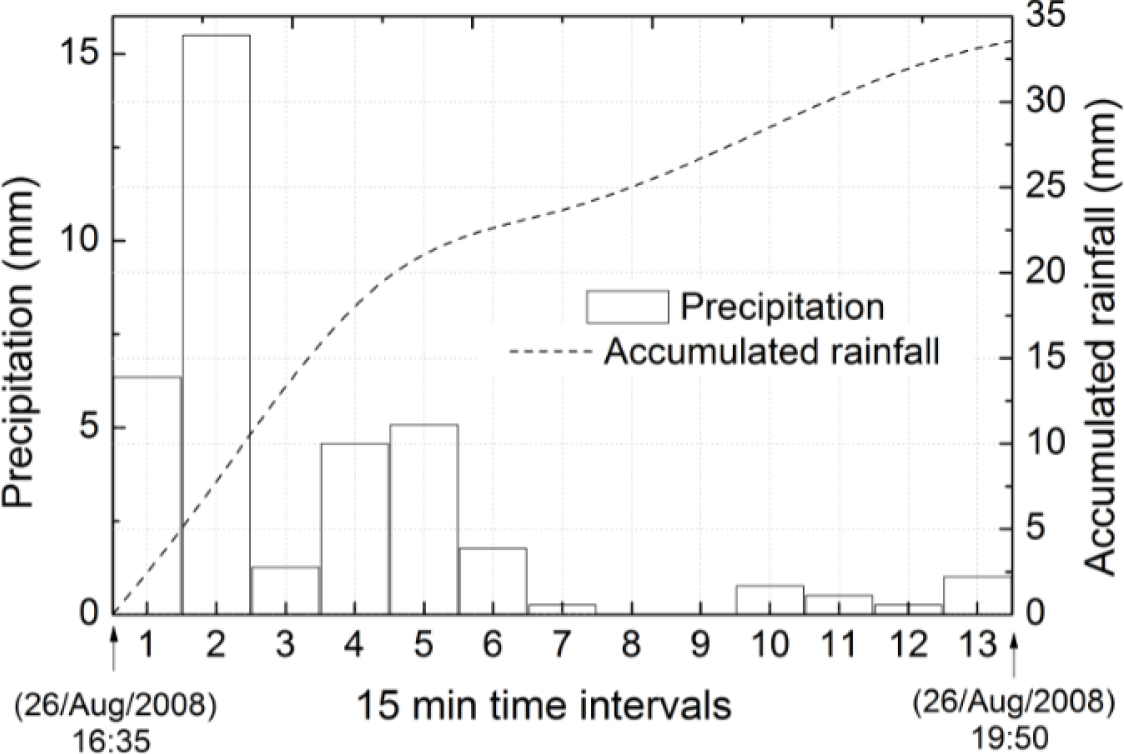
A reconstructed landslide-triggering rainfall event was utilized to demonstrate the operational functionality of the LandScient_EWS software and the real-time generation of advisory levels during a rainfall event. This event corresponds to the rainfall data depicted in Fig. 2.
Fig. 2 illustrates the histogram of the rainfall event, depicting the precipitation recorded at the Gerona meteorological station in Medellín (East), where historical data is recorded, calibrated, and maintained by EPM (Empresas Públicas de Medellín). The rain gauge operated with a temporal resolution of 15 minutes on this specific date, thus Fig. 2 represents time intervals of 15 minutes. To compare the critical intensity derived from the thresholds (for the study site) with the mean intensity of the actual rainfall during the event in real-time, the precipitation from the 15-minute intervals was proportionally divided into 1-minute intervals.
The landslide event that occurred on August 26, 2008, was sourced from a database (landslide inventory) compiled by AMVA-UNAL (2018). Described as a soil slip, it took place in an urban area, specifically in Villatina, a neighborhood in Medellín. The landslide destroyed three houses. It is noteworthy that Villatina is the same area where a catastrophic shallow landslide occurred on September 27, 1987, leading to the loss of more than 500 lives and the destruction of 80 houses (Evans and DeGraff, 2002; Klimeš and Rios Escobar, 2010).
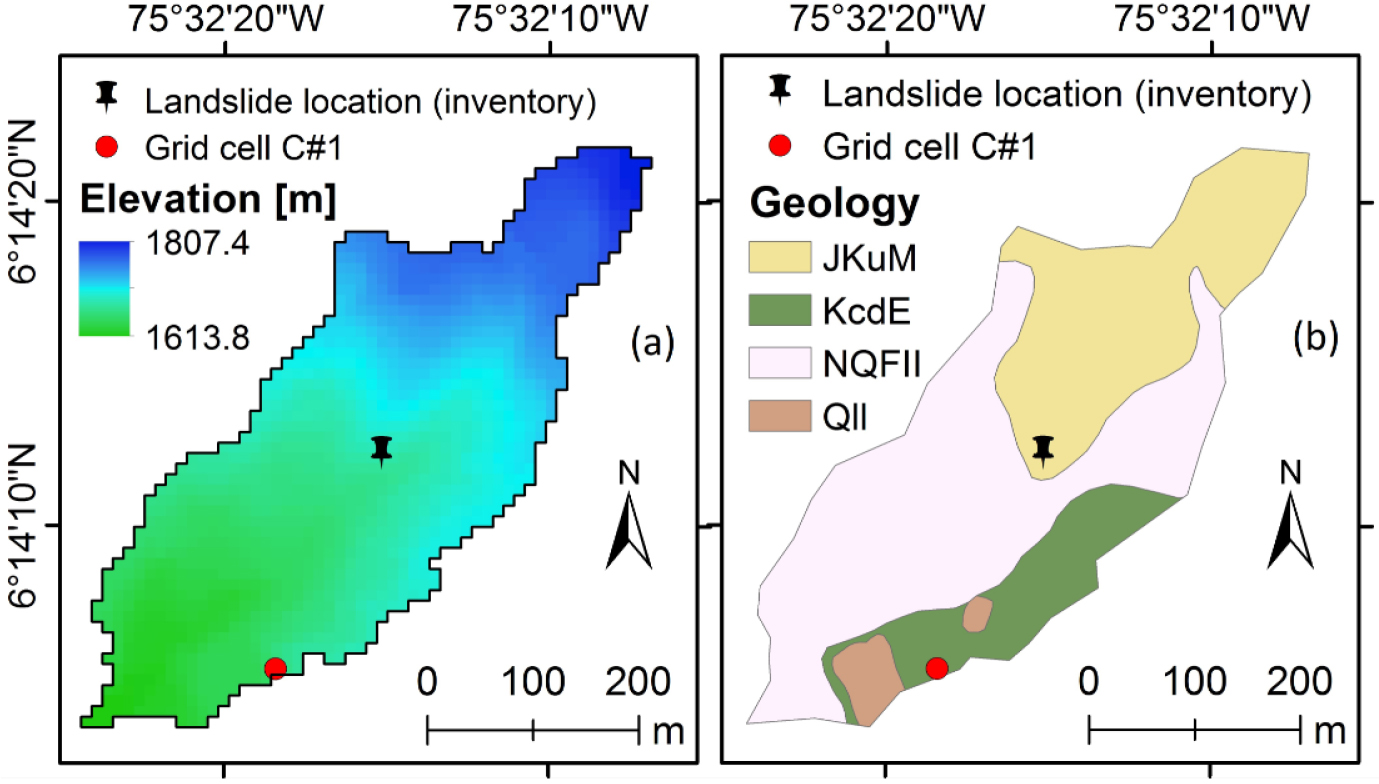
Fig. 3 displays the digital elevation model (Fig. 3a) and the geology (Fig. 3b) of the watershed W1. In this watershed four geological units are identified, including the Dunite from Medellín (JKuM), which is part of the ophiolitic complex. These units exhibit varying coloration based on their degree of alteration, and their weathering profile is characterized by minimal thickness. Another geological unit present is the Stock from Estancias (KcdE), comprising small granitoid bodies from the Antioquian Batolito, predominantly composed of silty-sandy granules. Additionally, there are debris flow deposits (NQFII) within the watershed, along with an anthropogenic fill (QII) comprised of materials resulting from urban expansion and construction activities (Velásquez and Marin, 2022).
Fig. 3 also depicts the grid cell C#1, where the lower threshold was derived using a distributed physically based method (M2) to define rainfall thresholds for shallow landslides (Marin, 2020), along with the location of the landslide obtained from the landslide inventory. It is essential to note that the coordinates of the landslide location have some uncertainty, with a precision of a few hundred meters according to the landslide database. For this study, it is assumed that the landslide occurred within the watershed, although the exact location of the landslide scarps or body was not determined.
In a previous study conducted by Marin et al. (2021), two methods to define rainfall thresholds for landslides were evaluated in the same watershed studied in this research, using the physically based model TRIGRS (Baum et al., 2008). These thresholds are defined using a model that considers the geological conditions of the watershed. This research, conducted in the Colombian Andes, provided valuable insights into landslide susceptibility assessment within the watershed studied. The methodology emphasized factors such as soil type, slope angle, and other geological characteristics, highlighting their importance in accurately defining rainfall thresholds for shallow landslides (Marín et al., 2019; Marin and Velásquez, 2020; Marin et al., 2020).
Table 2 provides two thresholds for watershed 1. The first threshold was calculated using method 1 (M1), with a critical catchment area (ac) of 0.3%, and the second threshold was calculated using method 2 (M2), specifically for the grid cell C#1, which has the lower threshold in the watershed. Fig. 4 illustrates these threshold curves in comparison to the rainfall event depicted in Fig. 2. The figure demonstrates the variation of the mean intensity throughout the event and how it aligns with the calculated thresholds. The rainfall thresholds for watershed W1, as depicted in Fig. 4, were calculated by Marin et al. (2021).
Table 2.
Rainfall threshold equations using methods M1 and M2 for watershed 1 (W1)
| Study site | Threshold equation |
| Watershed 1, (ac = 0.3%, M1) | I = 40.11D-0.771 for 1 h ≤ D ≤ 28 h |
| Grid cell (M2) | I = 27.71D-0.599 for 1 h ≤ D ≤ 30 h* |
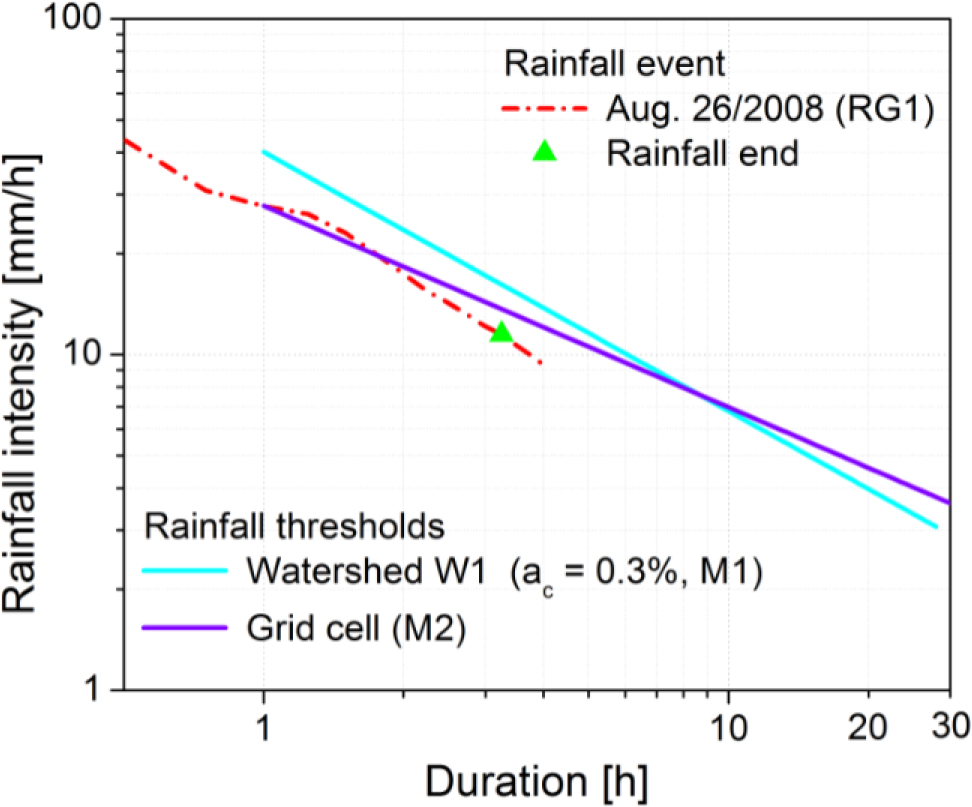
Fig. 4.
Rainfall thresholds for the watershed W1 (Medellín) using methods M1 (ac = 0.3%) and M2 (grid cell C#1), modified from Marin et al. (2021).
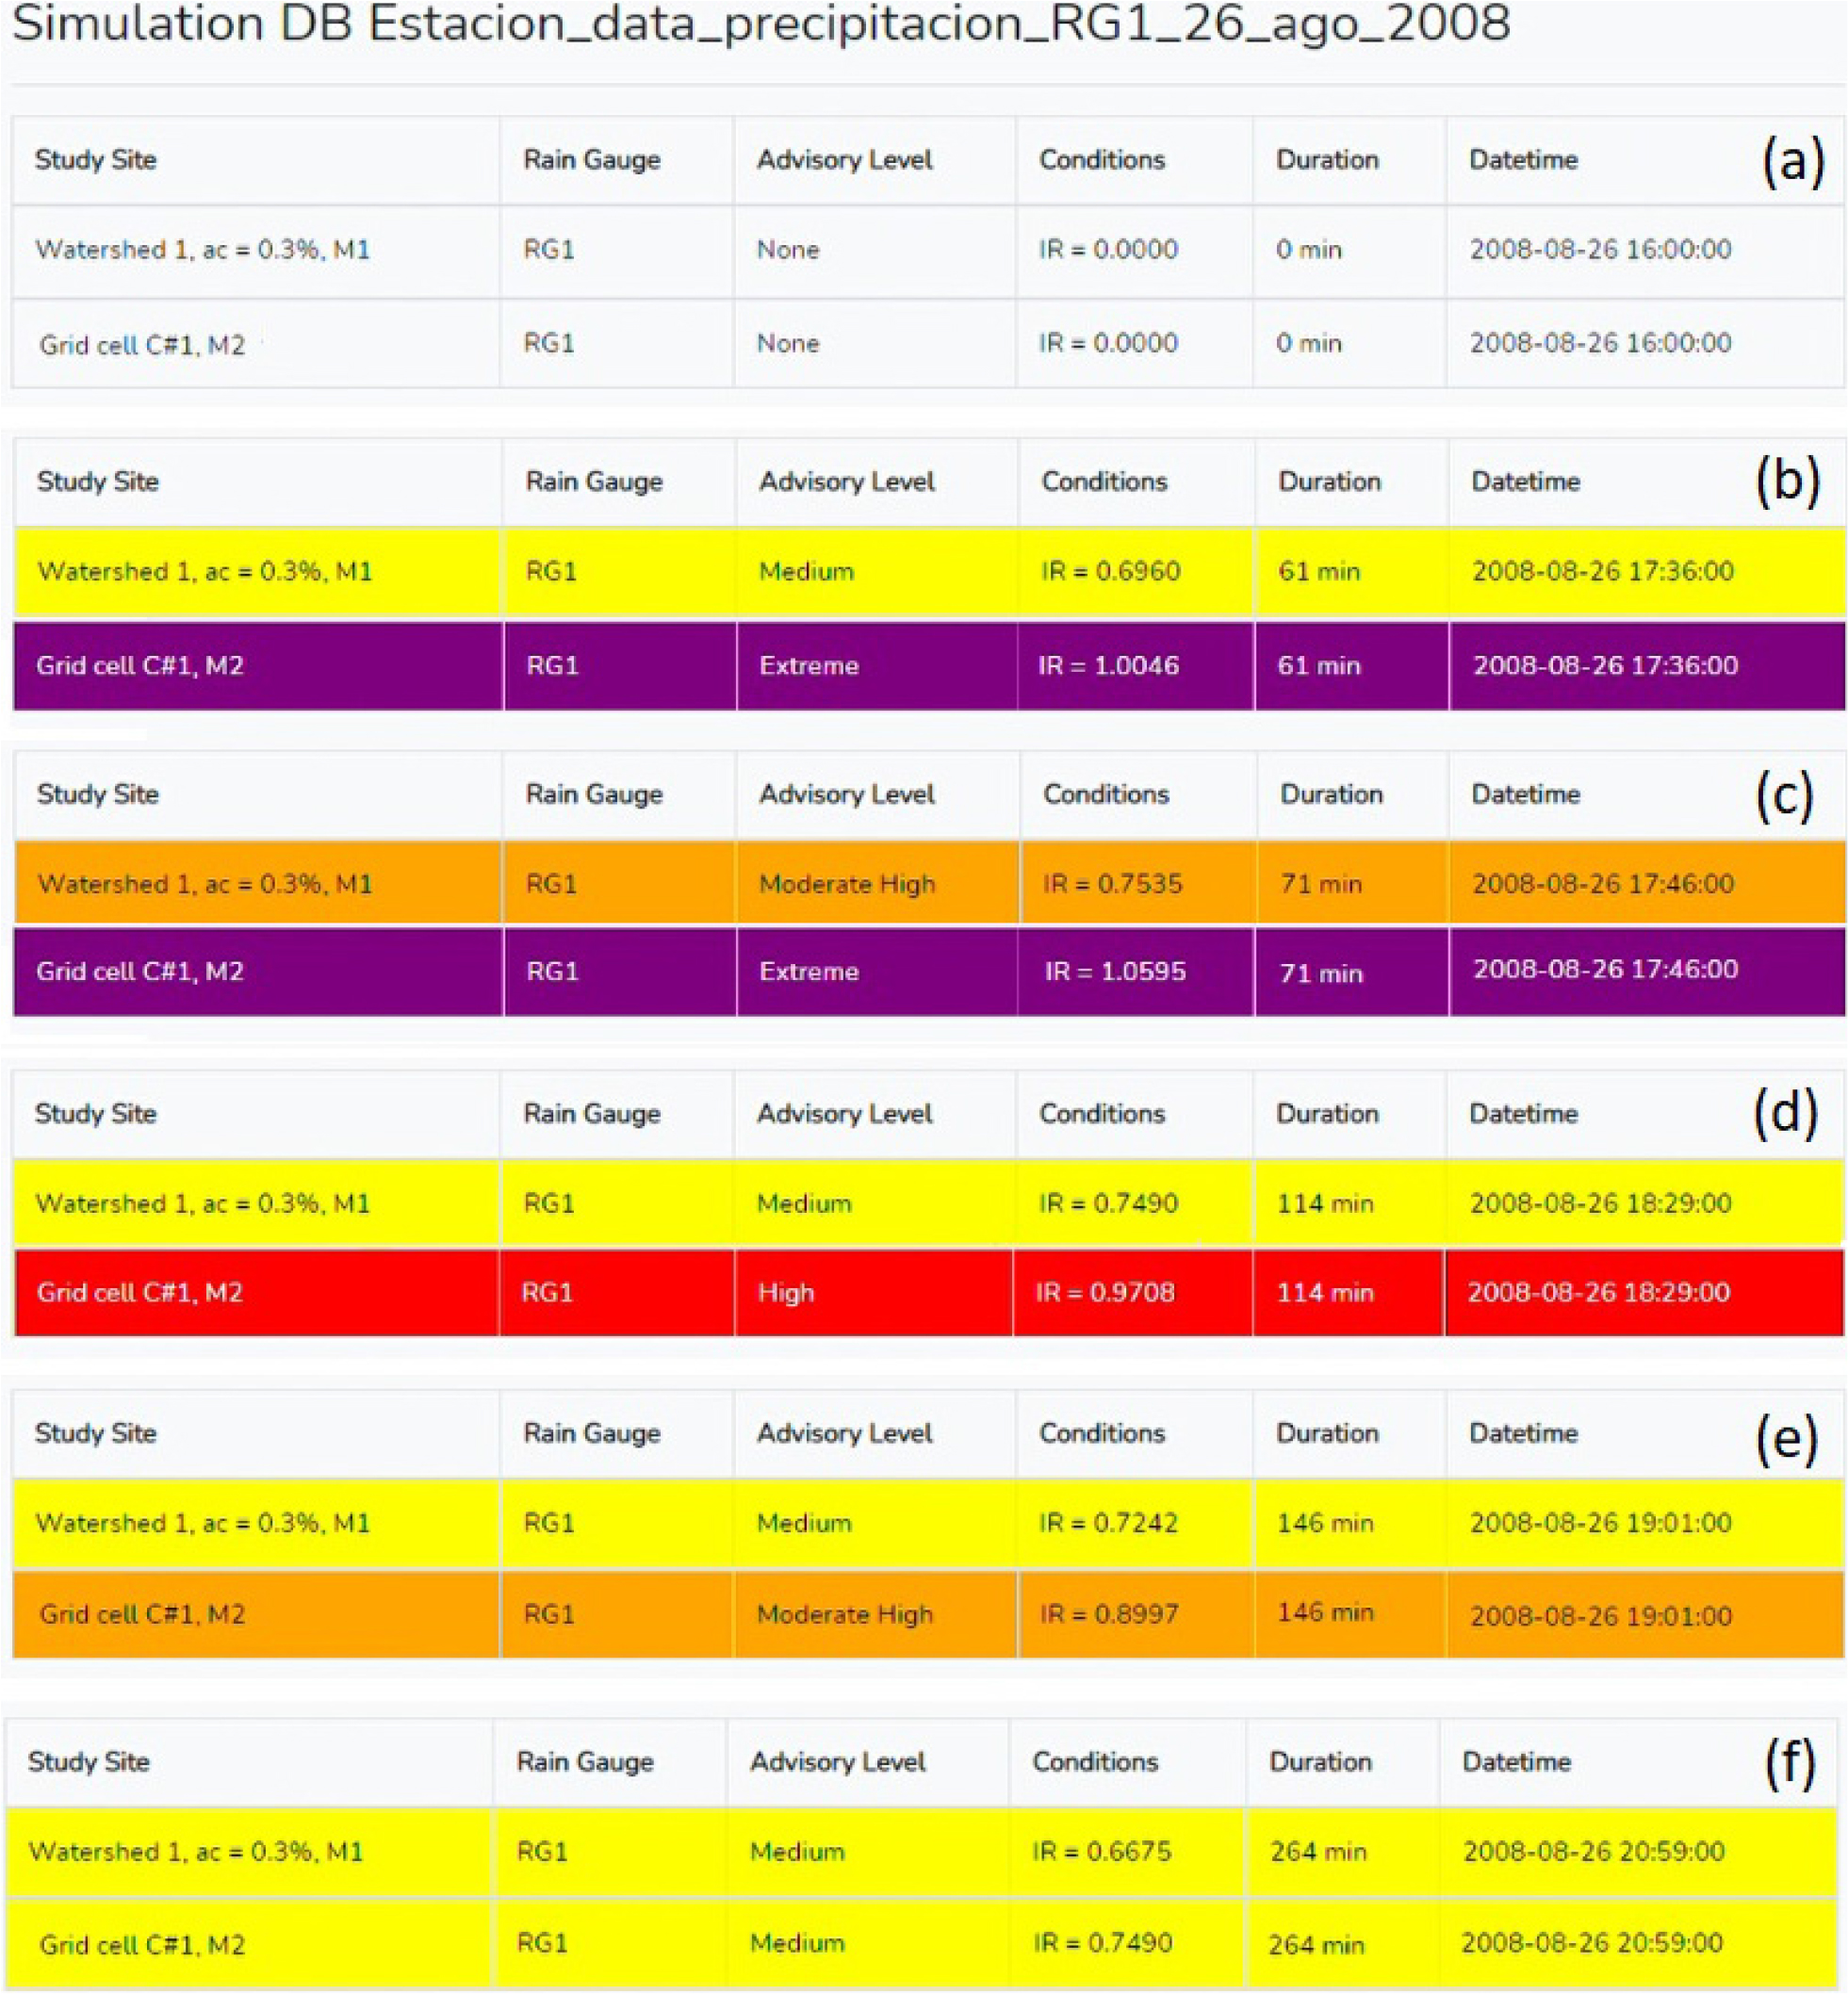
Fig. 5 presents a series of images showcasing the output of the software during the simulation of the rainfall event that occurred on August 26th, 2008. The simulation compares the rainfall data from Fig. 2 with the thresholds calculated for watershed 1 and grid cell C#1.
Before the rainfall event commences, the software does not display any advisory level (“None”) or color for the study sites, as depicted in Fig. 5a. As the rainfall data and threshold parameters are processed, the rows are continuously updated.
The rainfall event commences at 16:35, as indicated in Fig. 2. Fig. 5b illustrates the moment when the advisory level transitions from “None” (after the first hour, considering Di is 1 hour for both thresholds). Consistent with Fig. 4, the rainfall event exceeds the threshold shortly after the first hour. Thus, at 17:36 (Fig. 5b), the advisory level for grid cell C#1 is categorized as “Extreme,” whereas the threshold for watershed 1 corresponds to a “Medium” advisory level. Additional images were captured at specific times when the advisory levels changed for either the M1-calculated threshold for W1 or the M2-calculated threshold for C#1 (Fig. 5b~f).
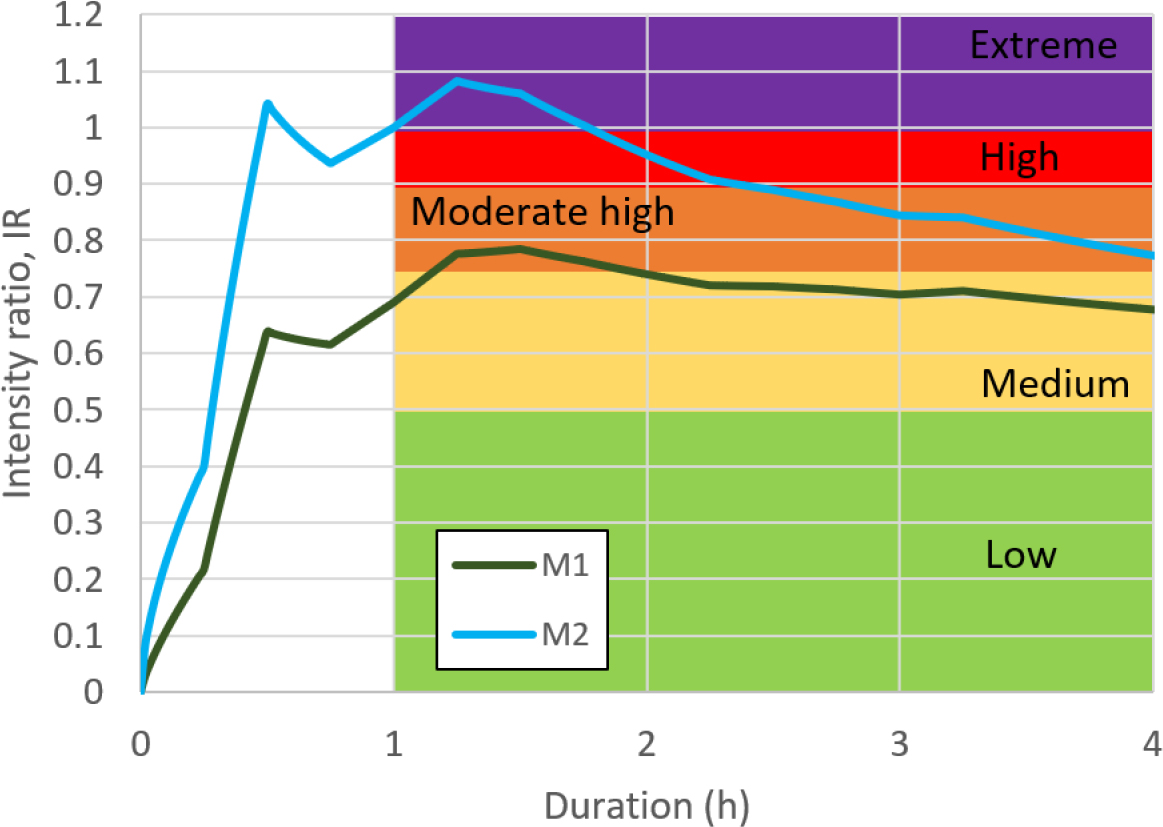
Fig. 6 depicts the IR during the rainfall event on August 26, 2008, computed by the LandScient_EWS software for watershed W1 (utilizing method M1) and grid cell C#1 (employing M2), alongside their corresponding thresholds (refer to Table 2). Despite the substantial intensity of rainfall in the initial hour, the applicability range for both thresholds commences after the first hour of the rainfall event, resulting in a non-advisory level. Intriguingly, immediately after this initial hour, when landslides are anticipated as per the threshold equations, grid cell C#1 registered an advisory level of “Extreme,” while watershed W1 reached a “Medium” advisory level. Subsequently, after 11 minutes, watershed W1 escalated to a “Moderate high” advisory level. Both study sites exhibit a fluctuation in advisory levels over the subsequent hours, transitioning from “Extreme” to “High” and eventually to “Moderate high” for grid cell C#1, and from “Moderate high” to “Medium” for watershed W1.
Discussion
The advisory levels calculated using LandScient_EWS for the tested study sites are based on predefined rainfall intensity and duration thresholds for landslides. It’s important to note that these advisory levels are not fixed standards but rather a proposal adapted from the work of Wei et al. (2018). The number of advisory levels and their thresholds can be customized based on specific requirements, such as the type of threshold and the user’s risk tolerance or acceptability. This flexibility allows for a tailored approach to LEWS, taking into account local conditions and community needs.
The advisory levels calculated using LandScient_EWS for the tested study sites, based on predefined rainfall intensity and duration thresholds for landslides, underscore a significant observation: the range of applicability of these thresholds profoundly influences the issuance of alerts in any LEWS. Specifically, LandScient_EWS provides the intensity ratio at any given time, enabling the identification of instances where an advisory level may not be warranted due to non-compliance with threshold criteria. However, it consistently offers insight into the severity of the rainfall event relative to the threshold equation.
Nonetheless, it’s crucial to implement appropriate measures to prevent a lack of timely anticipation of critical conditions. The threshold equations must be conservative, considering the initial time of threshold applicability, as specified in prior research (Marin et al., 2021). Furthermore, a straightforward graph, such as the one depicted in Fig. 6, proves invaluable for illustrating the current criticality or proximity to a critical state of a rainfall event. In this context, the proposed variable “Intensity Ratio” proves highly useful as it compares the actual critical intensity with the current intensity derived from the threshold. It doesn’t merely represent the average intensity of the rainfall event but rather a critical intensity calculated by the LandScient_EWS software, which considers all potential scenarios, including subperiods of the rainfall event that may pose higher criticality than others.
The LandScient_EWS software represents an initial development aimed at streamlining the integration of various types of thresholds into LEWS. Initially, the software was designed to associate rainfall intensity and duration thresholds using a power-law equation with real-time rainfall data from rain gauges. However, it is anticipated that the software will undergo modifications to accommodate different types of thresholds based on specific user requirements.
The current version of the software features a rudimentary graphical interface that enables users to input thresholds and rain gauge data. The essential input information necessary to generate advisory levels for a study site involves comparing thresholds with real-time data. However, future enhancements are envisaged, including the incorporation of spatial representations of study sites, rain gauge locations, and colored advisory levels displayed on maps. Presently, the alert status for each study site is presented in tables, showcasing real-time conditions and advisory level colors, thereby facilitating the swift identification of advisory levels for multiple study sites.
One significant advantage of this software lies in its flexibility and adaptability to various configurations of LEWS. As a web application, it can be deployed on any web server that meets the specified requirements. However, it is important to acknowledge that this software is still in the development phase and may be less robust and intricate compared to other existing LEWS software and technologies employed worldwide. Typically, open-source implementations of existing LEWS software are not readily accessible to users. The current limitations of the software encompass data quality, temporal resolution of rainfall data, threshold equations, and the absence of an installation program. Future developments will address these limitations by incorporating error analysis, assessing data quality, accommodating different temporal resolutions, integrating alternative threshold equations or functions, and providing installers for different operating systems.
Incorporating additional thresholds, such as soil suction or soil water content, into the software entails including specific threshold conditions and equations for the respective data types. However, integrating advisory levels and actions based on different measured and monitored data necessitates careful design and adherence to established methodologies, as evidenced in the scientific literature for the most widely investigated thresholds, such as rainfall intensity-duration thresholds.
In the realm of landslide risk management, early warning systems stand as vital safeguards against potential disasters. Among these solutions is THRESH (Baum et al., 2018), a software product developed by the U.S. Geological Survey (USGS). It is a powerful tool designed for automated tracking of precipitation relative to predefined thresholds for landslide occurrence. It excels not only in providing early warning of precipitation-induced landslides but also in analyzing multiyear precipitation records to compare the timing of threshold exceedance with historical landslide events. It handles various rainfall thresholds such as intensity-duration, cumulative recent-antecedent precipitation, and peak intensity. User-friendly, it deploys easily on platforms supporting Fortran 95, Python 2, and Unix commands. THRESH offers flexibility in handling different rainfall variables and threshold types, with users having options to define intensity-duration thresholds using a power function, fifth-degree polynomial, or multipoint linear interpolation based on their data characteristics.
In contrast, LandScient_EWS places a premium on real-time monitoring of rainfall thresholds for LEWS. With its intuitive graphical interface and immediate data monitoring capabilities, LandScient_EWS serves as a viable alternative to more complex software solutions like THRESH. While THRESH is well-regarded for its robust functionality in analyzing both historical and real-time precipitation data, LandScient_EWS is specifically designed to address the dynamic requirements of landslide risk management systems, necessitating rapid responses to evolving conditions.
LandScient_EWS is deemed a valuable tool for enhancing LEWS and mitigating casualties and economic losses resulting from landslides. It can integrate existing sensor networks or be purposefully installed to predict and forecast landslides in a specific region. In such instances, additional methodologies are essential to define the thresholds for utilization in the software.
In recent years, numerous novel approaches to slope instability monitoring and LEWS have emerged, each offering unique insights and advancements (Dewitte et al., 2021; Piciullo et al., 2022; Zhao et al., 2022; Abraham et al., 2023; Bordoni et al., 2023; Casagli et al., 2023; Gamperl et al., 2023; Gariano et al., 2023; Gómez et al., 2023; Jaramillo-González et al., 2023; Segoni et al., 2023; Tiranti and Ronchi, 2023; Marin and Long, 2024). Among these, some recent studies have presented advancements in optimizing rainfall thresholds and enhancing LEWS capabilities. Nocentini et al. (2024) developed a regional-scale forecasting model, addressing challenges such as false alarms and limited validation periods. Their approach primarily focused on reducing false alarms while also considering the validation of thresholds. Sudani and Patil (2024) emphasized the importance of saturation monitoring in landslide prediction, presenting a framework validated through back-analysis of landslide events. Their framework demonstrated good predictability of shallow landslide occurrence by establishing relations between landslide stability and soil saturation. Additionally, Bortolozo et al. (2024) proposed an automatic threshold definition system based on rainfall half-life and cluster analysis. Their approach aimed to automate threshold determination while accounting for variations in rainfall patterns.
LandScient_EWS, on the other hand, introduces novel algorithms to assess real-time rainfall information, identifying critical conditions within the same rainfall event often overlooked in traditional early warning systems. While the methodologies presented in the referenced papers are sophisticated and valuable, LandScient_EWS complements these approaches by providing a basic yet effective tool for studying different critical conditions. By dynamically adjusting alerts based on continuous data analysis, LandScient_EWS offers a valuable resource for proactive landslide risk management, enhancing the capabilities of existing systems in capturing evolving conditions during rainfall events.
Considering the potential impact on local communities, the advisory levels generated by LandScient_EWS play a crucial role in enhancing LEWS. These advisory levels provide communities with timely and actionable information regarding impending landslide risks. Through timely and precise information regarding potential landslide risks and critical conditions, the software empowers communities to anticipate adverse weather events, strategize evacuations for vulnerable areas, and efficiently allocate resources for mitigation measures. Moreover, the customization of advisory levels ensures that warning messages are relevant and understandable to those at risk, thereby increasing the likelihood of compliance and reducing the potential for loss of life and property. Thus, beyond their technical significance, the advisory levels contribute to broader societal benefits by enhancing resilience and disaster risk reduction efforts at the local level.
To critically assess our findings, it’s crucial to recognize potential limitations and assumptions inherent in our study. Specifically, our reliance on predefined rainfall intensity and duration thresholds for landslides may introduce uncertainties due to local variability and site-specific characteristics. Furthermore, we need to carefully evaluate the effectiveness of the LandScient_EWS software in simulating advisory levels and its suitability for different geographical settings. Future research efforts could focus on conducting sensitivity analyses to gauge threshold robustness under varying conditions, integrating additional variables like soil moisture content or vegetation cover to improve predictive accuracy, and validating the software’s performance across diverse case studies and environmental contexts. Addressing these limitations and suggesting avenues for further research will provide a more balanced perspective on our findings, driving advancements in landslide risk management and early warning systems.
Conclusion
LandScient_EWS is a PHP program meticulously crafted to compare real-time measured data, such as rainfall, with predefined thresholds for landslides. This software empowers users to calculate and visually represent real-time landslide advisory levels for monitored study sites across regional, basin, and/or hillslope scales. In this study, the software was deployed in a case study situated in Medellín, Colombia, where a rainfall event on August 26, 2008, coincided with a shallow landslide occurrence. The rainfall intensity and duration thresholds, previously defined in a separate study using two physically based methodologies (Marin et al., 2021), were implemented to validate the software. The software adeptly simulated and depicted advisory levels during the recorded rainfall event for a small watershed and a single grid cell (or hillslope) within the watershed, for which the thresholds were established. With its demonstrated effectiveness, this software holds promise in streamlining the implementation of rainfall thresholds in future or existing LEWS.
Continued optimization, improvement, and enhancement of the software are essential to render it cost-effective and effective in mitigating the impacts of landslides on human lives. Several future features could be contemplated for the program, including intelligent calculations that adjust the frequency of operations based on the advisory level (intensified analysis during critical rainfall events), the representation of advisory levels on maps with colored study site locations, the integration of satellite-derived rainfall data, and the incorporation of different types of thresholds and associated sensor-measured data. These advancements will further augment the capabilities and applicability of LandScient_EWS as a valuable tool in landslide risk reduction endeavors.


