

Introduction
Study Area
Materials and Method
COSMO-SkyMed Data
Damage Proxy Map (DPM)
Support Vector Machine (SVM) Classification
Maximum Likelihood Classification
Results and Discussion
Conclusion
Introduction
On 13 January 2021, around 12:48 KST, retaining walls collapsed at the construction site for a new living facility in Sa-dong, Ansan-si, Gyeonggi-do (Shin, 2021). The construction started on 1 July 2020 and was planned to finish on 28 February 2022 or about 20 months with a cost of KRW 28,230 million. According to the statement of the construction site manager, on the day of the accident, around 11:30 a.m., the civil engineering company manager received a report that the retaining structure was making a loud popping sound in the filling area of the 4th and 5th tiers of the basement in the upper left, at 11:50. An emergency evacuation was ordered at the construction site. Around 12:15, a collapse occurred in the temporary retaining wall and braces, and the first collapse was issued from the northwest side (Fig. 1).

At the time of the first collapse, the retaining walls collapsed from the 1st to 7th stage of the support member. At 19:10 on the same day, additional secondary collapse occurred due to structural imbalance and flat earth pressure caused by the primary collapse (Gyeonggi-do Underground Accident Investigation Committee, 2021). There were no casualties due to the prompt evacuation action of the on-site director, but part of the temporary retaining facility collapsed, and some cracks occurred in the adjacent road on the south side (Ahn, 2021). The Gyeonggi-do underground accident investigation committee (hereinafter referred to as the investigation committee) was formed to determine the cause of the accident based on the results of data investigation, field investigation, face-to-face interview, and interpretation with relevant persons, and to suggest technical and institutional measures and alternatives to prevent similar accidents from reoccurring.
Remote sensing, especially synthetic aperture radar (SAR), can provide a valuable information source for rapid damage building after anthropological event or any natural disaster such as earthquake, owing their broad coverage and wide resolution. Radar satellite has several advantages such as clouds and smoke being transparent to radar signals, radar does not require sunlight, and due to its coherent character, radar signal has the ability to detect minor changes in surface property changes (Nur et al., 2022).
The potential of synthetic aperture radar (SAR) imagery for mapping damaged building lies in the sensitivity of SAR backscattering after an event (Hough et al., 2020; Nur and Lee, 2021). As active remote sensing, SAR sends electromagnetic microwaves to ground targets in a slanted way and then receives corresponding backscattering echoes. Under certain modes, it has the ability to acquire both intensity and phase information of the backscattering waves. Intensity refers to the amplitude information of the backscattering waves that can be affected by both parameters of radar systems and characteristics of ground targets. Phase indicates the relative position of the backscattering waves within a full period, which is largely dependent on the distance between radar sensor and ground targets. The path length of an electromagnetic signal to the ground and back usually contain a number of a whole wavelength plus some fraction of a wavelength. Coherence from repeat pass interferometry provides a quantitative measure of ground surface property change during the time span of the interferometric pair. Major damage to a building significantly increases the interferometric phase variance in the affected resolution element. This change appears as a decorrelation or a decrease in coherence. For these reasons, this study applied the SAR dataset and the damage proxy map (DPM) method to identify collapsed structures over a construction site in Ansan city. DPM method is a collaborative project between the Jet Propulsion Laboratory (JPL) and the California Institute of Technology, known as the Advanced Rapid Imaging and Analysis (ARIA) project.
The application of DPM method using SAR satellites data has proven useful for mapping damage to buildings after an earthquake and other natural disaster events. Yun et al. (2015) found their DPM that was produced using coherence difference calculated by a pre-event coherence map and co-event coherence map could depict areas of potential damage and roughly delineate the extent of debris from reported landslide/avalanche in Langtang valley after the 2015 MW 7.8 Gorkha, Nepal earthquake using Constellation of Small Satellites for Mediterranean basin Observation (COSMO)-SkyMed and Advanced Land Observing Satellites-2 (ALOS-2) satellites. Tay et al. (2020) generated flood proxy map after the 2019 typhoon Hagibis in Japan using the amplitude information using ALOS-2 and DPM using phase information of Sentinel-1 satellite. Hough et al. (2020) generated DPM for damage assessment after the 2019 MW 7.1 Ridgecrest Earthquake in California using Sentinel-1 satellite. Biass et al. (2021) produced DPM after the 2014 eruption of Kelud volcano in Indonesia using COSMO-SkyMed satellite. Nur et al. (2022) acquired DPM to map damage locations after wildfires over Plumas National Forest in California using Sentinel-1 satellite. The DPM results were in agreement with fire perimeter from California fire department. Along with remote sensing data from SAR satellites, image classification techniques from machine learning and other various approaches have been utilized in many areas of hazard assessment and disaster risk management. For example, an artificial neural network (ANN) and support vector machine were applied to KOMPSAT-3A and Sentinel-2 (Nur et al., 2020).
This study aims to conduct a comprehensive exploration on the intensity and coherence information of COSMO-SkyMed SAR satellite data for analyzing the collapse of the under-construction site in Ansan city. We produced DPMs by subtracting interferometric coherences of pre- and co-events to delineate anomalous changes in the ground-surface properties. In addition, we classify the intensity information using support vector machine (SVM) and maximum likelihood classification algorithms. The capability of intensity and coherence information for construction or building damage detection would be compared and provide a reference for future applications. Both types of information are relatively easy to obtain and apply, because their feasibility does not have as many requirements for observation conditions as interferogram. All potential parameters that can be derived relatively easily from the intensity and coherence information of the four products were selected and calculated to facilitate accurate detection. Qualitative and quantitative analyzes were carried out to compare the capabilities of these potential parameters for mapping damage to construction or building so as to provide reference. The combined use of these information for mapping damage to construction was also explored.
Study Area
The study area was located in Sa-dong, Ansan-si, on the west coast of the southern part of Gyeonggi-do, South Korea (Fig. 2). The new construction site has an area of 2,667 m2 and a building area of about 1,773 m2. The new building was planned to have 4 stories below the ground and 13 stories above the ground (Kim, 2021). Therefore, retaining walls were installed as earthen curtains at the foundation step. In the north of the study area, Masan (246 m) and Surisan (474 m) form the boundary with Siheung-si, and in the southeast, a hill of about 100 m such as Nabongsan passes from north to south. Gwangdeoksan (205 m) and Kasamisan (142 m) rise in the center. Lake Sihwa is located to the west of the survey area, and small streams such as Ansancheon, Singilcheon, Hwajeongcheon, Guryongcheon, and Banwolcheon flow into the sea. Plains are developed in these river basins and coasts, and river water and reservoir water are used for irrigation or daily life.
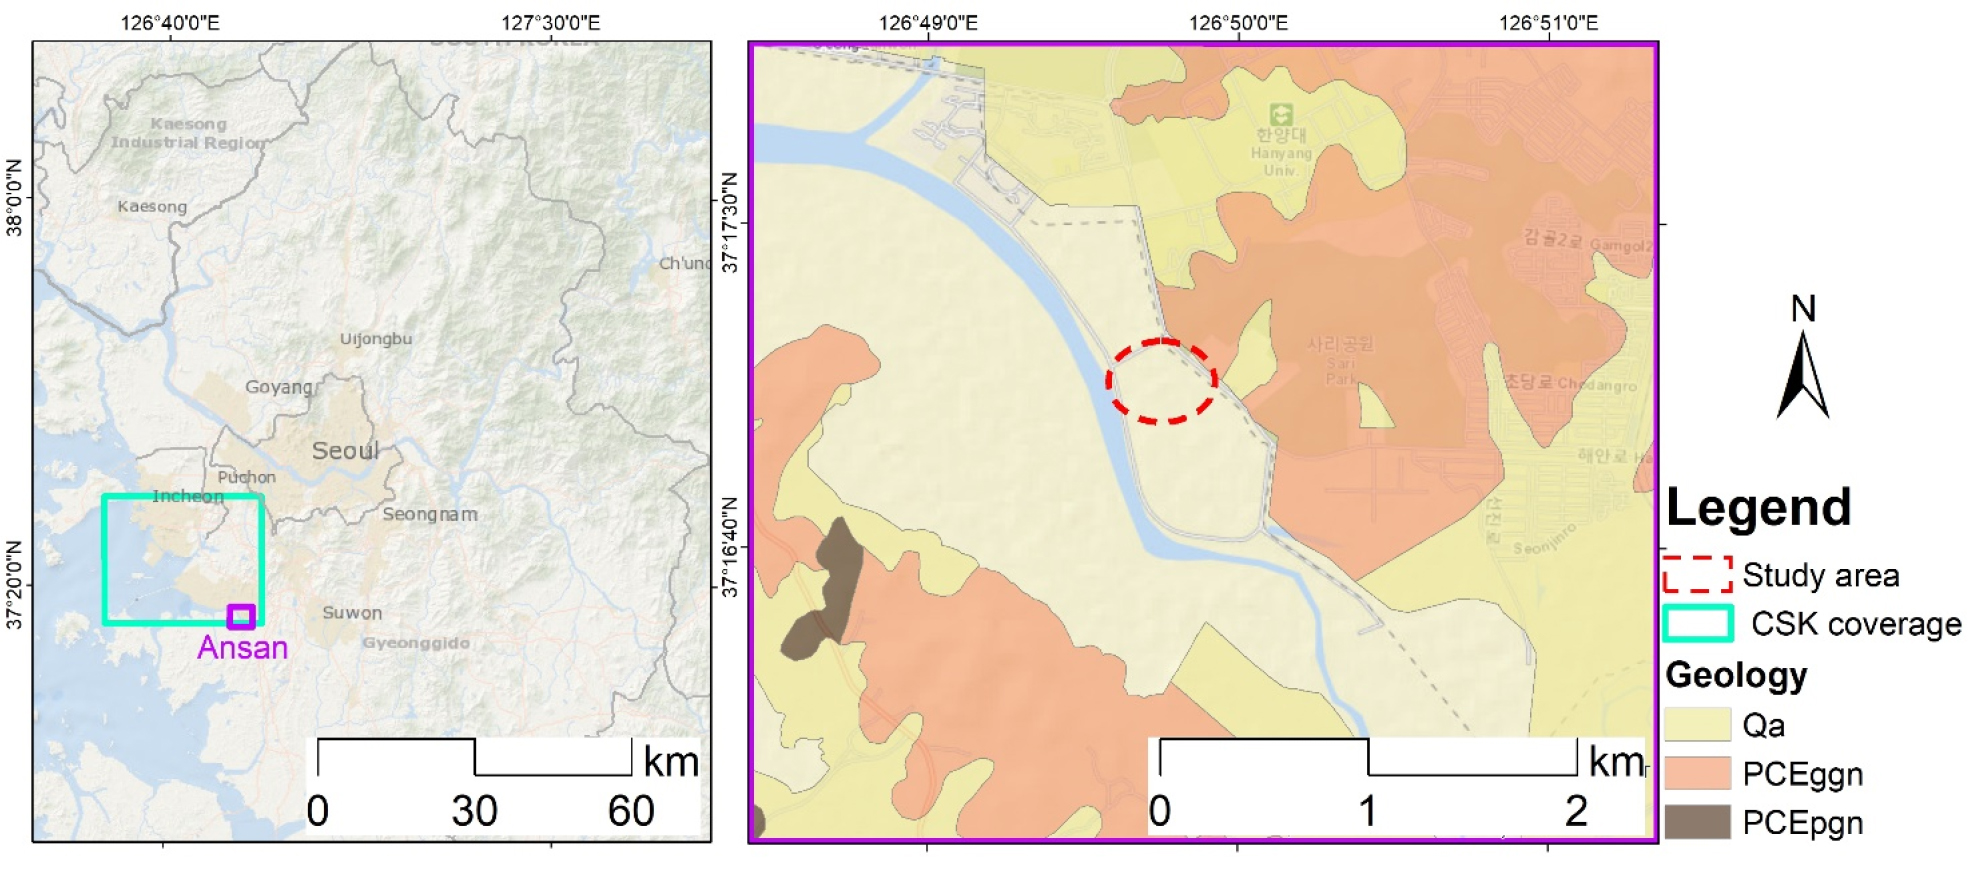
The geology of the construction site is based on the scale 1:50,000 map published by the Korea Institute of Geoscience and Mineral Resources (KIGAM). It consists of metamorphic rocks of Bucheon origin, unidentified igneous rocks, Mesozoic sedimentary rocks, and all of the Cretaceous layers. Metamorphic rocks show a wide distribution throughout, and are composed of granite gneiss, white mica schist, graphite schist, biotite schist, biotite gneiss, and right white granite gneiss, and are repeatedly distributed by flexion. In Ansan-si, low-lying areas are distributed along the river basins and flatlands of the Guan Line, where reclamation projects were carried out, and most of the flat areas developed along the river are covered with river sediments, and reclaimed areas along the coastline are covered with marine sediments (Gyeonggi-do Underground Accident Investigation Committee, 2021).
Materials and Method
COSMO-SkyMed Data
SAR is more useful than other types of remote sensing because its radar transmission in the microwave spectrum is not affected by day and night visibility and weather conditions, including cloud cover. COSMO-SkyMed operates at X-band data managed by the Italian Space Agency (ASI) (Palazzo et al., 2012). COSMO-SkyMed is used for both civilian and defense purposes, as an earth observation system that aims to build a global service that supplies the provision of data, products and services that comply with established international standards and are relevant to a wide range of applications, such as scientific and commercial applications, risk management, and defense applications (Covello et al., 2010). We collected COSMO-SkyMed single look complex (SLC) data during ascending observation with Stripmap mode and horizontal transmission and horizontal return (HH) polarization. We collected three COSMO-SkyMed data taken before the event and one after the event (Table 1).
Table 1.
Parameters of COSMO-SkyMed data used in the study
| Pre-event scene | Post-event scene | Flight direction | Polarization | ||
| DPM A | 2020-09-15 | 2020-10-17 | 2021-08-01 | Ascending | HH |
| DPM B | 2020-10-17 | 2020-12-20 | |||
The applied COSMO-SkyMed SLC products obtained both intensity and phase information of microwave backscattering echoes from ground targets. Intensity indicates the amplitude information of backscattering microwaves received by the SAR sensor after emitting microwaves to ground targets. It is influenced by not only radar system parameters (e.g., frequency, polarization, and incidence angles) but also ground target characteristics (e.g., roughness and material dielectric characteristics). Therefore, intensity changes in SAR images over a period of time can indicate the ground target changes during this time. As collapsed structure cause surface properties changes, SAR image intensity changes are deemed to have the potential for collapse structure identification. Intensity change calculated by pre- and post-event SAR images can be used to quantify SAR image intensity changes caused by a disaster event, and thus selected for collapse structure mapping in this case.
Damage Proxy Map (DPM)
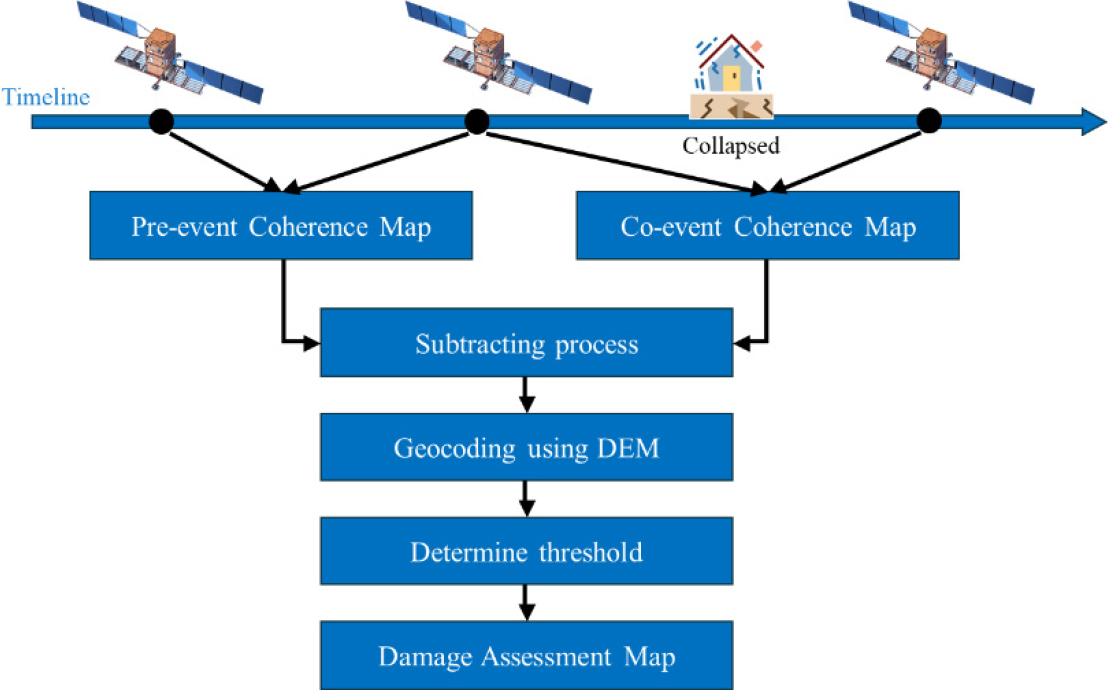
Interferometric coherence is a quantification of resemblance between two radar signals that have been employed to assess the quality of the InSAR product (Washaya et al., 2018). We used the complex pixel value, c of the pre-processed SLCs for the change detection assessment, where collapsed is inferred from loss of coherence or decorrelation between SAR images. This statistical quantity () is computed as (Tay et al., 2020):
where, and represent complex pixel values of two co-registered SAR images and * indicates the complex conjugate. The resulting coherence ranges from 0 (incoherent) to 1 (coherent). If the two images’ observations are identical, then the coherence is equal to 1 due to stable objects in the scenes, such as buildings. A low coherence implies a large change to the ground surface reflecting SAR radiation (Zebker and Villasenor, 1992). The changes can be caused by damage to the ground itself or damage or collapse of structures.
As long as the pre-damage (reference) InSAR pair maintains reasonable coherence, this approach can be applied to any anthropogenic or natural damage that causes serious surface property changes. This alteration appears as a decrease in coherence or decorrelation (Fielding et al., 2020). A SAR-based DPM is expected to be sensitive to changes in the order of the wavelength used by the satellite (3.1 cm in this study), although spatial resolution of damage features is limited by pixel size. Satellite-based DPM is expected to be less reliable in areas of typically low coherence, such as in vegetation areas. The study area is surrounded by buildings with minimal vegetation.
Fig. 3 shows the flowchart of DPM processing. The process started with co-registration with sub-pixel accuracy to match one another scene precisely. The co-registered images were cropped to produce images that only contain the study area. The three radar images were used to generate two pairs of interferometric coherence before the event (DPM A and DPM B) and two pairs spanning the event. The pre-event coherence pair depicted changes unrelated to the event and was expected to be the background or reference value. We acquired a coherence difference (COD) by subtracting pre-event from co-event. The results were transformed into a georeferenced coordinate system employing the TerraSAR-X digital elevation model (DEM), resulting in pixels approximately 10 m across. The threshold for particular coherence loss was tuned by comparing observed COD with reported collapse and areas in which it is known that no collapse occurred. Tay et al. (2020) utilized high-resolution aerial imagery from the Geospatial Information Authority of Japan (GSI). Yun et al. (2015) compared DPM with National Geospatial-Intelligence Agency (NGA) report and the United Nations Operational Satellite Application Programme (UNOSAT) damage assessment map. Here, coherence loss thresholds for DPMs were chosen by considering the report of the investigation committee in Ansan city. We generated two DPMs (Table 1) to analyze the temporal dan spatial detection capability of DPM technique toward the collapsed structure. We generated DPM A from pre-event coherence map of 2022-09-15 and 2020-10-17 scenes and co-event coherence map of 2020-10-17 and 2021-08-01 scenes. DPM B was generated from pre-event coherence map of 2020-10-17 and 202012-20 and co-event coherence map of 2020-12-20 and 2021-08-01 scenes.
Support Vector Machine (SVM) Classification
SVM is a machine learning algorithm and is a supervised classification method that requires predefined training data (Cortes and Vapnik, 1995). SVM approach seeks to find the optimal hyperplane that separates classes by focusing on the training cases that lie at the edge of the class distributions, the support vectors, with the other training cases effectively discarded (Mercier and Lennon, 2003; Kadavi and Lee, 2018). Thus, an optimal hyperplane fitted, and the approach may be expected to get high accuracy with few training sets, which could be a very advantageous feature given the costs of training data acquisition sets. Therefore, the basis of the SVM approach to classification is the notion that only the training samples that lie within the class boundaries are necessary for discrimination (Foody and Mathur, 2004). Many hyperplanes could be fitted to separate the classes, but there is only one optimal separating hyperplane, which is expected to generalize well compared to other hyperplanes. This optimal hyperplane should run between two classes, with all cases of a class located to one side of the separating hyperplane, which is itself located at the closest training data points in both classes as large as possible.
Maximum Likelihood Classification
The algorithm used by the maximum likelihood classification tool is based on two principles: Bayes’ theorem of decision making and the cells in each class sample in the multidimensional space being normally distributed (Ahmad and Quegan, 2012). The algorithm considers both the means and covariances of the class characteristic when assigning each cell to one of the classes represented in the signature file. With the assumption that the distribution of a class sample is normal, a class can be characterized by the mean vector and the covariance matrix (Otukei and Blaschke, 2010). Given these two characteristics for each cell value, statistical probability is calculated for each class to determine the cell’s membership to the class. When the default Equal option for A priori probability weighting is specified, each cell is assigned to the class with the highest probability of being a member. If the probability of occurrence of some classes is higher (or lower) than average, the File a priori option should be used with the Input a priori probability file. The weights for classes with special probabilities are specified in the a priori file. In this situation, the a priori file helps in the allocation of cells that lie on the statistical overlap between the two classes. These cells are more accurately assigned to the proper class, resulting in better classification. This classification weighting approach is referred to as a Bayesian classifier. The a priori probability assigned to all classes sampled by selecting the Sample a priori option in the input signature file is proportional to the number of cells captured in each signature. The resulting class that has fewer cells than the average in the sample gets a weight below the average, and the class that has more cells gets a weight that is greater than the average. As a result, each class has more or fewer cells assigned to it. When a maximum likelihood classification is applied, an optional output confidence raster can also be produced. This raster represents the confidence level of the classification. The number of confidence levels is 14, which is directly related to the number of valid decline fraction values. The first confidence level, encoded in the confidence raster as 1, consists of the cells with the shortest distance to the average vector stored in the input signature file; therefore, the classification of these cells has the highest confidence. Cells comprising the second confidence level (cell value of 2 in the confidence raster) will be characterized only if the rejection fraction is 0.99 or less. The lowest confidence level has a value of 14 in the confidence raster, depicting cells that are most likely to be misclassified. Cells of this level will not be classified if the rejection fraction is 0.005 or greater. That confidence level will not exist in the output confidence raster if no cells are classified at a certain confidence level.
Results and Discussion
This study explored the intensity and coherence information from four COSMO-SkyMed images for specific building collapse in Ansan city in order to provide a reference for future applications. Intensity maps over the study area were generated from each amplitude data of COSMO-SkyMed imagery. According to intensity image analysis, revealed that the distribution of high intensity index increasingly spread and extends in the study area (red-dashed line) from September 2020 (Fig. 4a) until December 2020 (Fig. 4c) regarding the construction process. Then, after collapsing in January 2021 the intensity dropped lower than December 2020 compared to the intensity image of August 2021 (Fig. 4d).
Fig. 4e shows the time series of intensity change over the study area in blue line and black dots. The sum of amplitude on 15 September 2020 was 89,476 dB then gradually increased to 95,640 dB on 17 October 2020, and 101,845 dB on 20 December 2020. The gradual increased in the sum of amplitude was due to the progress of building construction process in the study area. However, after the collapse of the under-construction site on 13 January 2021, the sum of amplitude was dropped to 85,970 dB on 1 August 2021 (Fig. 4d). Therefore, the intensity analysis from amplitude information can be used for monitoring the development of area under construction or to observe damage structure after anthropological or any natural disaster that affect the ground surface properties.

The amplitude images from COSMO-SkyMed satellites have been classified using SVM and maximum likelihood (ML) classification algorithms, as shown in Fig. 5. Stratified random sampling on a pixel-by-pixel basis was used for classification, which identified two classes namely structure (purple) and not-structure (dark yellow). The SVM and maximum likelihood yielded similar buildings results. Both algorithms managed to classify the two classes assigned from the training data. Fig. 5a-5d show the classification results using SVM algorithm and Fig. 5e-5f show the classification results from maximum likelihood algorithms. Both classification results revealed that the distribution of structure pixels increasingly spread and extends in the study area (purple pixels) from September 2020 until December 2020 regarding the construction process. Then, after collapsing in January 2021 the pixel distribution decreased than December 2020 (Fig. 5d and 5h) compared to the classified image of August 2021.
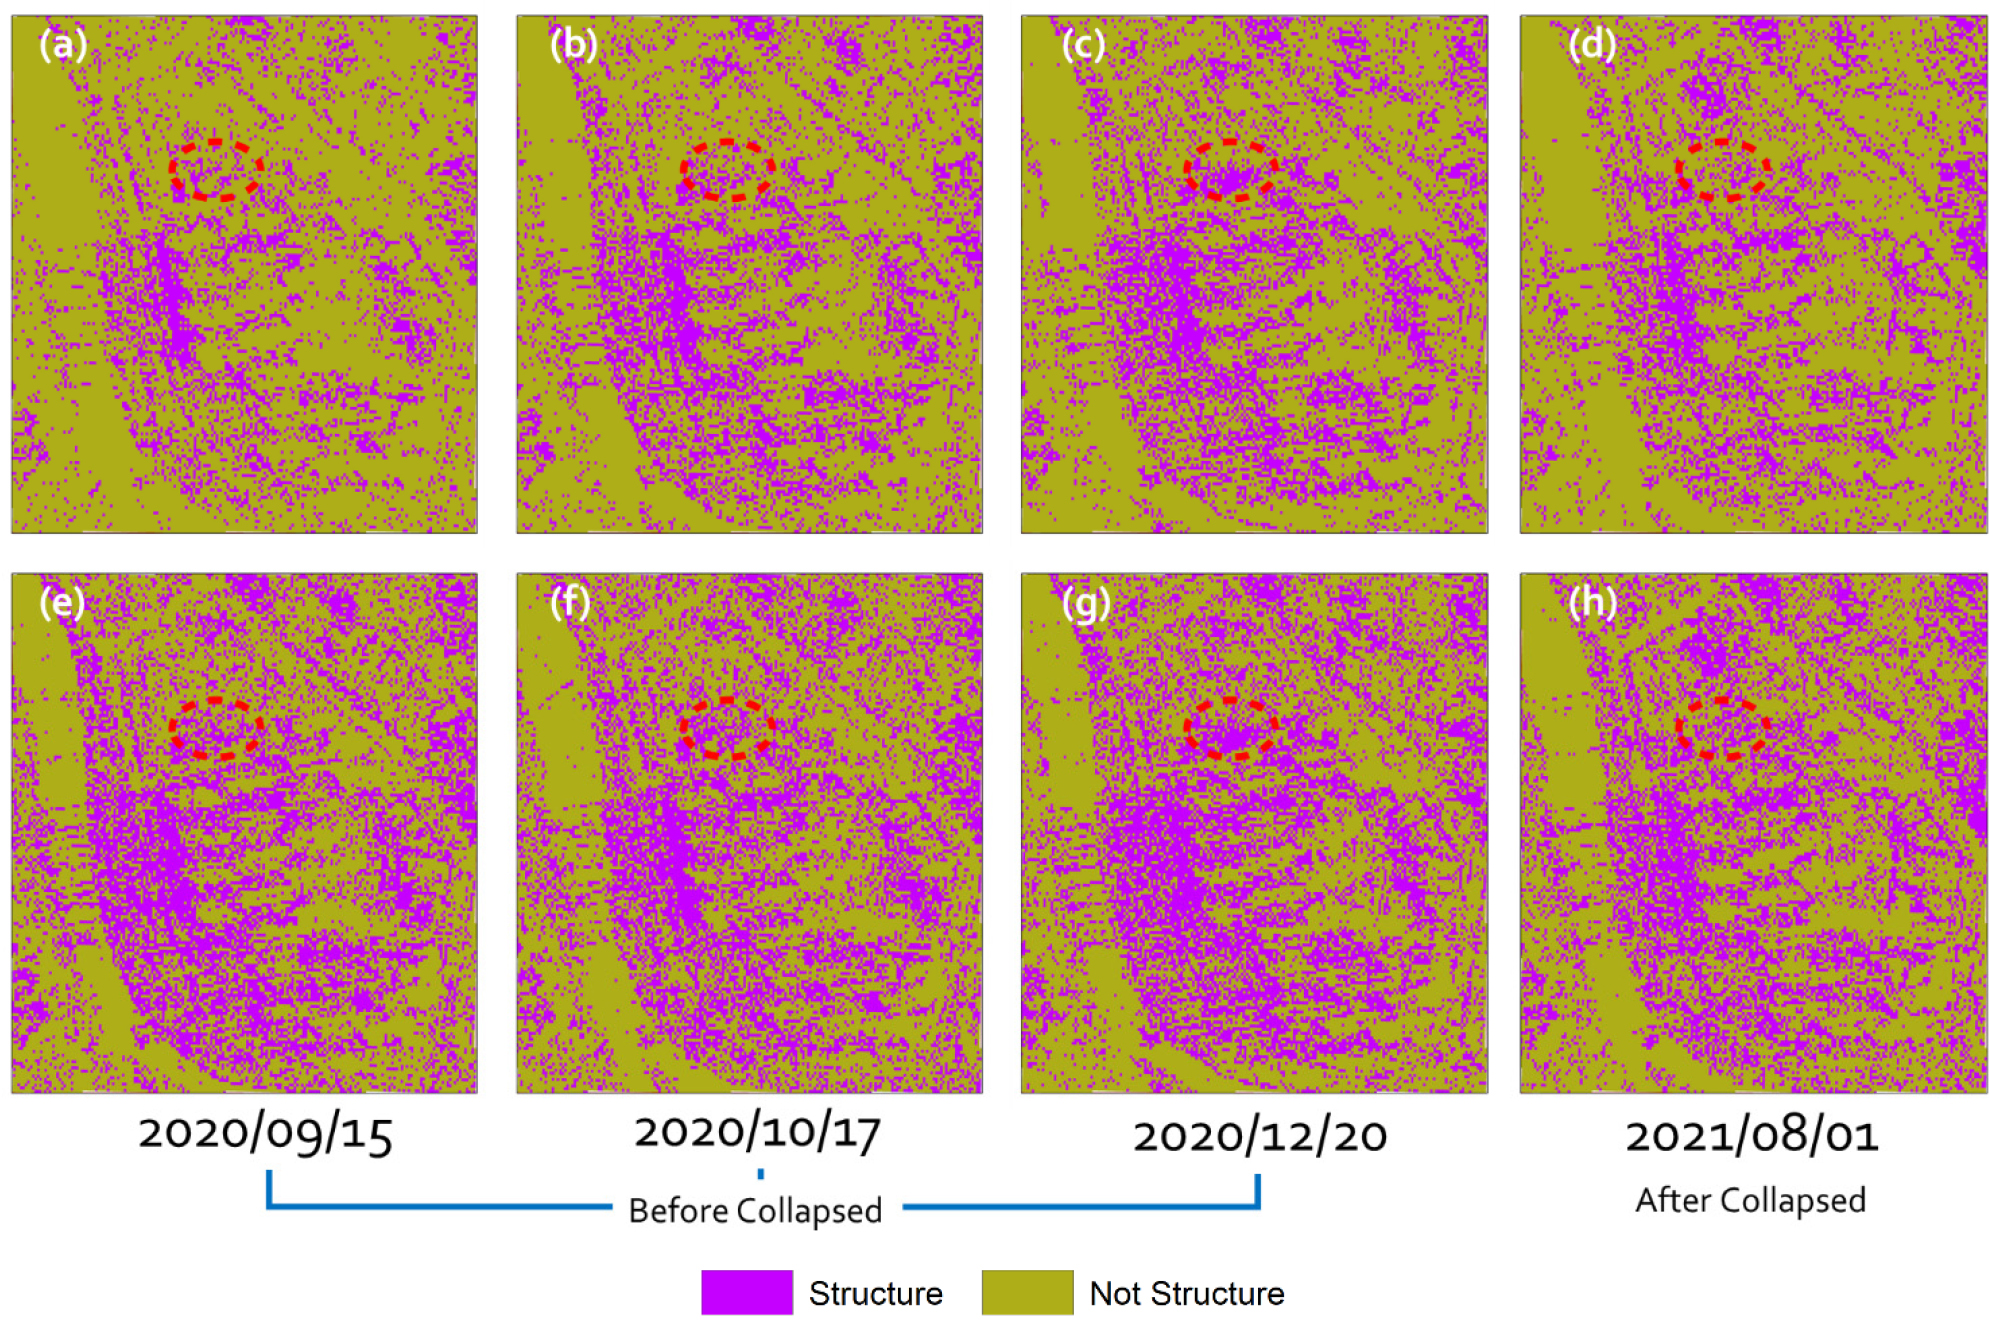
We also calculated pixels number inside the study area (red dashed line) from each classification results. Fig. 4e shows the time series of pixel number change over the study area in yellow line and green dots for SVM and orange line and purple dots for maximum likelihood (ML). The number of pixels on 15 September 2020 was 228 pixels for SVM and 377 pixels for ML, then gradually increased to 252 pixels for SVM and 419 pixels for ML on 17 October 2020, and 373 pixels for SVM and 490 pixels for ML on 20 December 2020. The gradual increased in the number of pixels was due to the results of building construction process in the study area. However, after the collapse of the under-construction site on 13 January 2021, the number of pixels dropped to 323 pixels for SVM and 440 pixels for ML on 1 August 2021. The decrease in pixel number was not as significant as the sum of intensity values. This might be caused by the classification algorithms still considering the intensity pixels over the collapsed site as construction class. Nevertheless, the use of both SVM and maximum likelihood classification algorithms using amplitude information can be an alternative tool to map and observe area under construction or to analyze damage structure after an event.
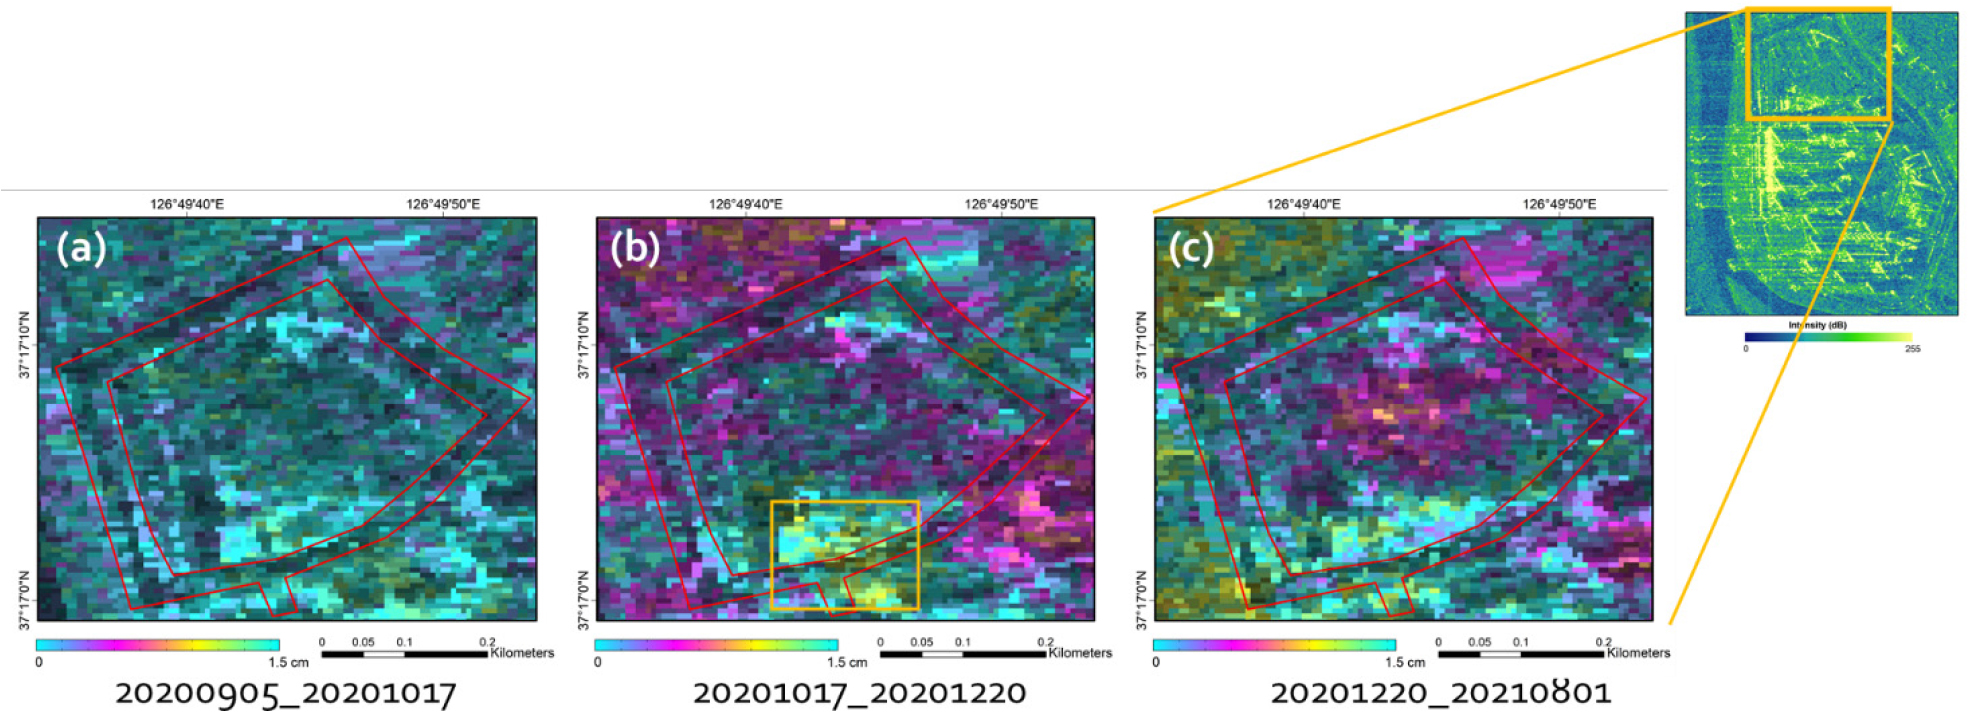
The unwrapping interferogram images have been produced using COSMO-SkyMed SAR data from September 2020 until August 2021 which were shown in Fig. 6a, 6b, and 6c. Fig. 6a shows no surface deformation indicating no change over the study area. From Fig. 6b, it was found that the low deformation signal about less than 5 mm in the south perimeter of the construction site, marked by orange box which has construction project has been working. Meanwhile, in Fig. 6c, there was no recognized significant deformation signal in the south perimeter. It was related to the repaired progress after the collapse of the structure. The interferograms managed to delineate the progress of the construction spatially and temporally.
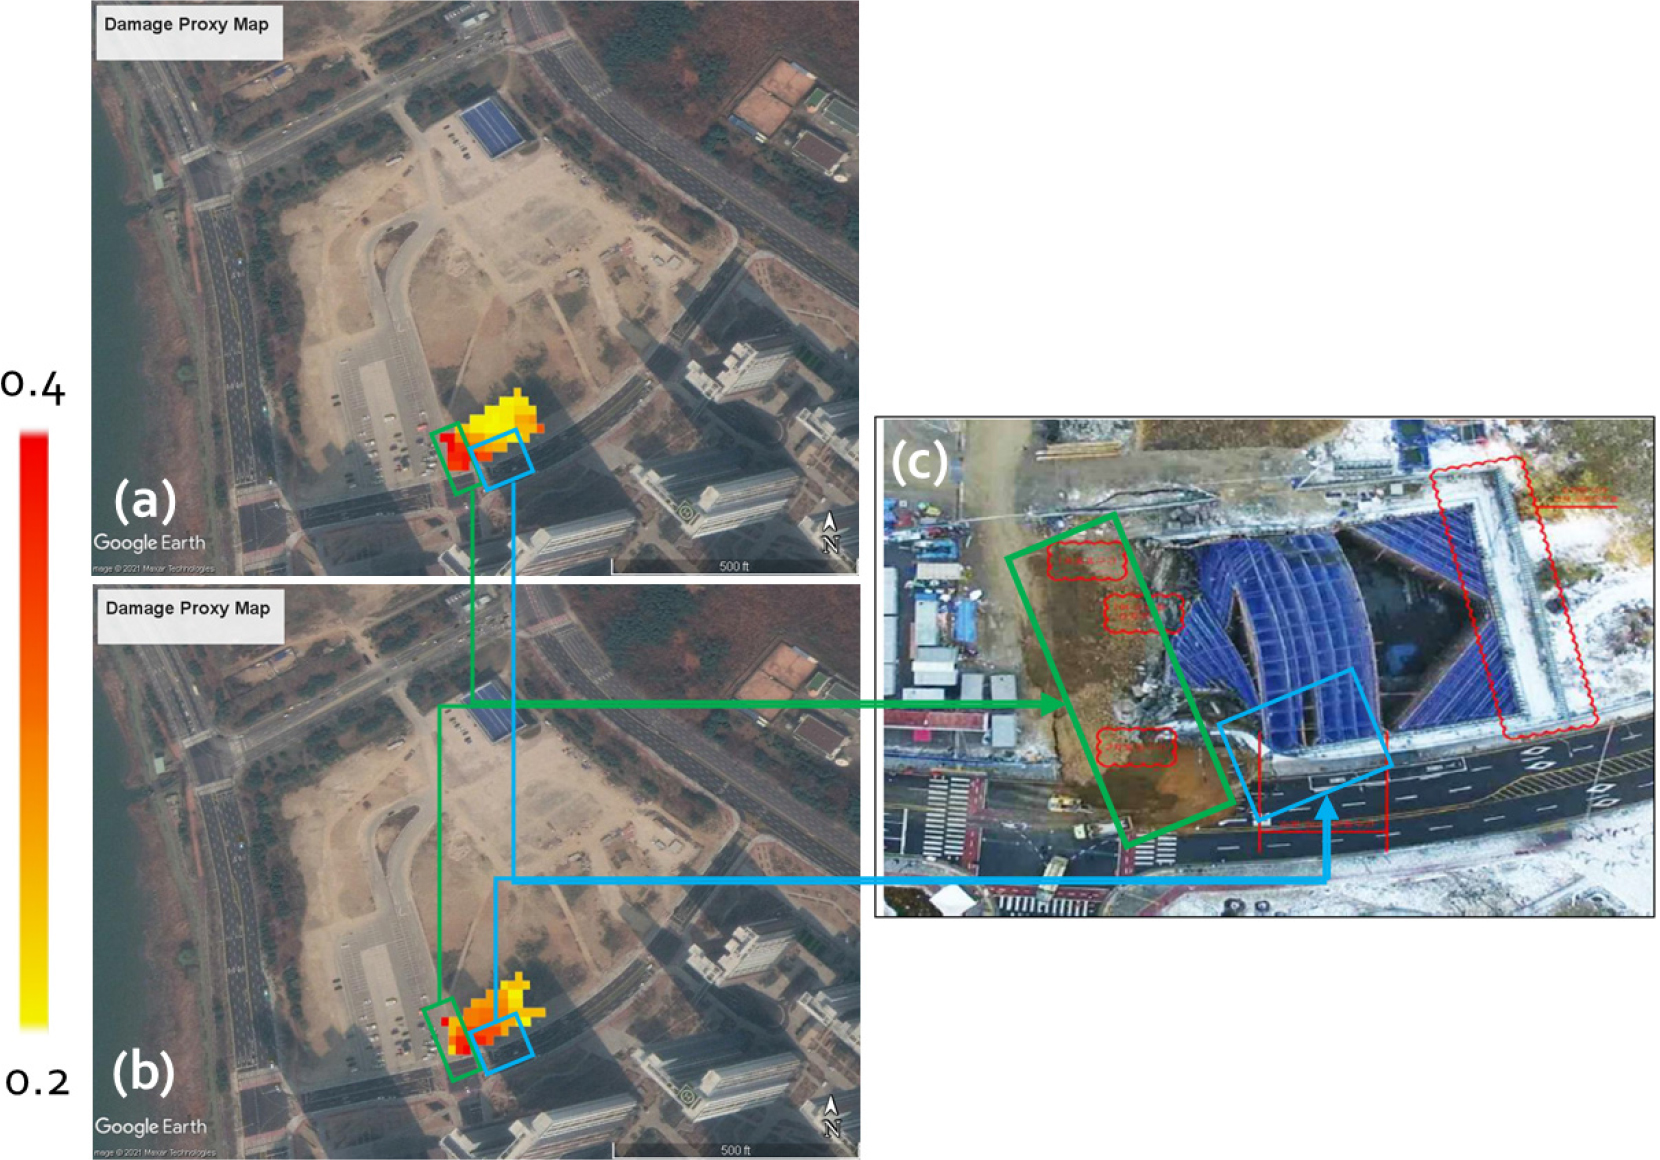
The DPMs were produced from the COSMO-SkyMed dataset and geocoded to the TerraSAR-X DEM (Dong et al., 2021). Fig. 7 reveals the map view of COSMO-SkyMed DPMs overlaid over Google Earth imagery after the incident. Areas that experience an increase in COD are indicated by pixels with colors that stretch from yellow to red. Pixels are set to be relatively transparent that corresponding to areas where decorrelation did not significantly change during the time spanning the collapse suggesting little to no destruction. Increased opacity of the radar image pixels reflects increasing ground and building change or potential damage. Color ranges from yellow to red indicating an increasingly significant coherence change in the area covered by the pixel. The threshold of COD from 0.2‐0.4 was adjusted to represent collapse structure based on the investigation report. Each pixel in the DPMs was registered to the TerraSAR-X DEM and had a corresponding resolution of about 10 m.
Fig. 7a and 7b show the DPM using COSMO-SkyMed Satellite with different InSAR coherence pair dates. And Fig. 7c shows the collapsed structure from the report of the investigation committee. Both DPM image A and DPM image B, show a higher index of DPM in agreement with the west part of a collapsed structure which showed in the green box. The DPM image A has a longer temporal delay rather than DPM Image B. As a result, DPM image A has a higher index of DPM than DPM image B. And for the blue box in Fig. 7a and 7b, revealed the damaged area in the south perimeter near the road. The DPM results were in agreement with DPMs after the 2016 Gyeongju and 2017 Pohang earthquakes showing the distribution of damaged buildings with high index of DPM (Nur and Lee, 2021).
Another SAR satellite such as Copernicus Sentinel-1 data with frequent revisit of six days and freely accessible, can be utilized to produce DPM after an event. The Sentinel-1 dataset can provide fast and reliable damage maps after an event using DPM approach. Given the SAR pixel size, Korea Multi-Purpose Satellite-5 (KOMPSAT-5) operated by Korea Aerospace Research Institute (KARI) can be an alternative to generate damage map over construction site (Kim and Lee, 2002). Nevertheless, the utilization of both amplitude and phase information managed to reveal collapsed structure in the study area.
The investigation committee was formed to determine the exact cause of the earthen block collapse accident that occurred at the construction site for a new living facility in, Sadong, Ansan-si, Gyeonggi-do. The cause of the accident was investigated through topographical and geological investigations, analytical verification, and face-to-face investigations. A ground survey was conducted for the original design and preparation of an underground safety impact assessment report, and the ground constant at this time was calculated using data such as standard penetration test results and empirical formulas. In the case of design change (State, Sogang soil quality), the ground constant was calculated using the results of the indoor direct shear test (State, Seongseong soil quality) after performing two additional ground surveys. At the time of design change, the ground constant was designed with a very large value (adhesive force 15~30 kPa, internal friction angle 10~15°) compared to the ground constant of the original design. However, considering the presence of disturbance samples and the representativeness of direct shear tests, it cannot be judged as a ground constant consistent with the field. As a result of analytical verification, it was analyzed that it was consistent with the result of insufficient bolt stress. In case of general design change, the original design strength constant is used as it is, but it is generally not reasonable to increase the strength constant as in this site. In addition, although the design was changed to a structure with low structural stability with a higher strength constant and a lower groundwater level than the original design, no expert review was made on the structural stability of the submitted modified method.
In the original design, the groundwater level (GL) in the borehole was calculated at the site at about -7.0 m. GL -12.0 m was applied as the actual groundwater level was judged to be lower. The groundwater level measured at the site on 12 January 2021, the day before the collapse, was about -7.94 m to -8.40 m. In order to compare and analyze this, as a result of comparing it with the groundwater level at the adjacent site, it was analyzed that the groundwater level applied at the time of the original design was reasonable. As a result of analytical verification, it is also consistent with the result of insufficient bolt stress of the 5-stage support member. As a result, when looking at the groundwater level confirmed in the ground survey and the measurement results measured right before the collapse, the results of the field auger test were judged as seized water without an accurate basis for the seized water, and the groundwater level was lowered to -12 m and applied to the analysis. It was also confirmed that not only the supervision report was poorly prepared while performing the supervision work, but also the supervision tasks such as over excavation at the site, insufficient length of thumb piles during retaining wall construction, and increase in earth pressure due to the load of the clamshell were confirmed. The investigation committee considered that the above has been applied incorrectly.
Conclusion
The potential of SAR imagery was utilized to identify a collapsed structure in Ansan city by integrating both amplitude and phase information. Based on identification using amplitude images, revealed the amplitude value increased from September 2020 until December 2020, then decreased in 2021 due to the collapse of the structure. The SVM and maximum likelihood classification algorithms manage to classify structure and not structure using intensity data in the study area. Determining the threshold of difference coherence should be considered from the official report and investigation result to increase the assessment. A large temporal decorrelation after collapse (August 2021) may affect the coherence in the co-event pairs of the interferogram. DPM method using the COSMO-SkyMed data can give a new insight into the detecting event related to the collapsed building or structure. Summarizing the investigation results of the incident, the cause of the collapse of the construction was the design change to the retaining method with less rigidity than the original design, errors in groundwater level monitoring, over-excavation during earth wall construction, insufficient access due to length error of thumb piles, increase in earth pressure due to clamshell load, non-compliance with measurement management standards, etc. The committee judged that the accident was caused by a combination of factors that were not carried out properly. In addition, even though the measurement data showed abnormal signs because the measurement management standards presented in the underground safety impact assessment were not followed, the measurement data showed abnormal signs. It is believed that this time the retaining wall collapse occurred due to a combination of factors such as not providing a securement plan.
