

Introduction
Topography and Geology of the Study Area
Field Survey
Debris 2D Program
Results of calculations
Conclusions
Introduction
Rainfall patterns in recent years are different from past decades because of climate change. In Korea, rainfall patterns used to show a general tendency for continuous rain during the summer rainy season. However, recent rainfall patterns are changing to a tendency for heavy rain over small areas for a short period of time. Such abundant and intense rainfall over localized areas can, however, cause natural disasters. In the case of landslides, their occurrence tends to increase because of a rapid reduction in ground stability when intense rainfall is delivered over a small area within a short time. The fact that rainfall affects the stability of landslides has been well established by previous research, and has been proven both experimentally and theoretically (Chae et al., 2016; Kim and Shin, 2016; Cho, 2017; Choi, 2017; Seo et al., 2017; Choi, 2018).
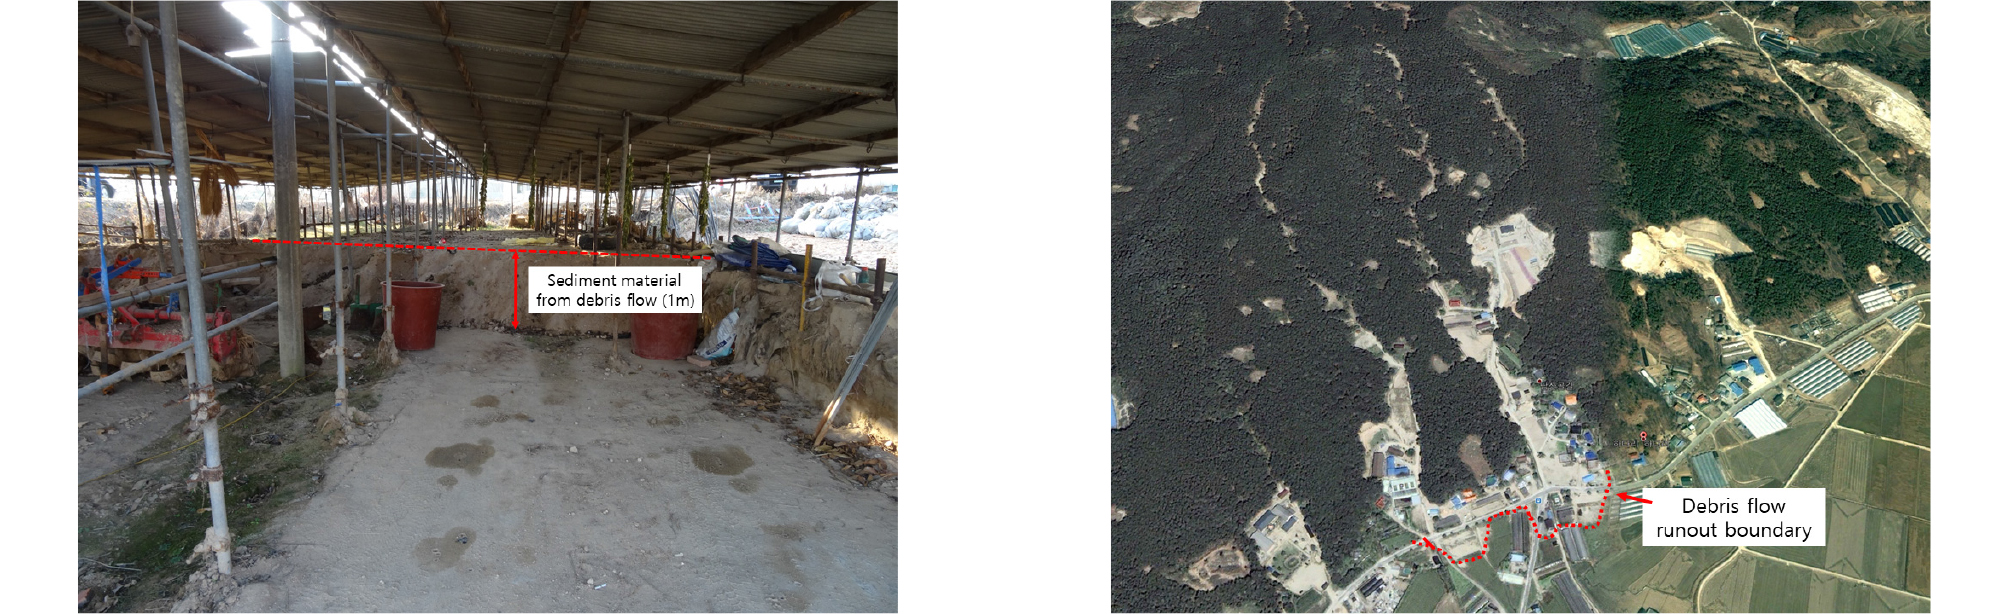
Many recent landslides in Korea have been caused by concentrated localized rainfall, resulting in significant damage. At Yeoju city in Gyeonggi Province in July 2013, rainfall exceeded 330 mm per day. Rainfall intensity exceeded 100 mm/h. Resulting landslides damaged houses and rice fields in the Hadari area of Yeoju. At the entrance of a narrow valley, rainfall intensity of >100 mm/h led to slope failure. A debris flow generated by landslides flowed into paddy fields located 100 m from the village. A large amount of soil was transported. As observed during the field survey, a greenhouse at the valley entrance was covered with soil carried by the debris flow to a height of about 1 m. In the small valleys joining the main valley, landslides transported large amounts of soil.
The Debris 2D program, developed by Professor Kofei Liu of National Taiwan University, was used here to investigate debris flow movement and pathway properties at the time of the flow. Important input data include the soil thickness. This governs the soil amount and yield stress, which in turn influences the debris flow. Values were input and analyzed in the Debris 2D program, to compare the nature of the debris flow with that of the field observations.
Topography and Geology of the Study Area
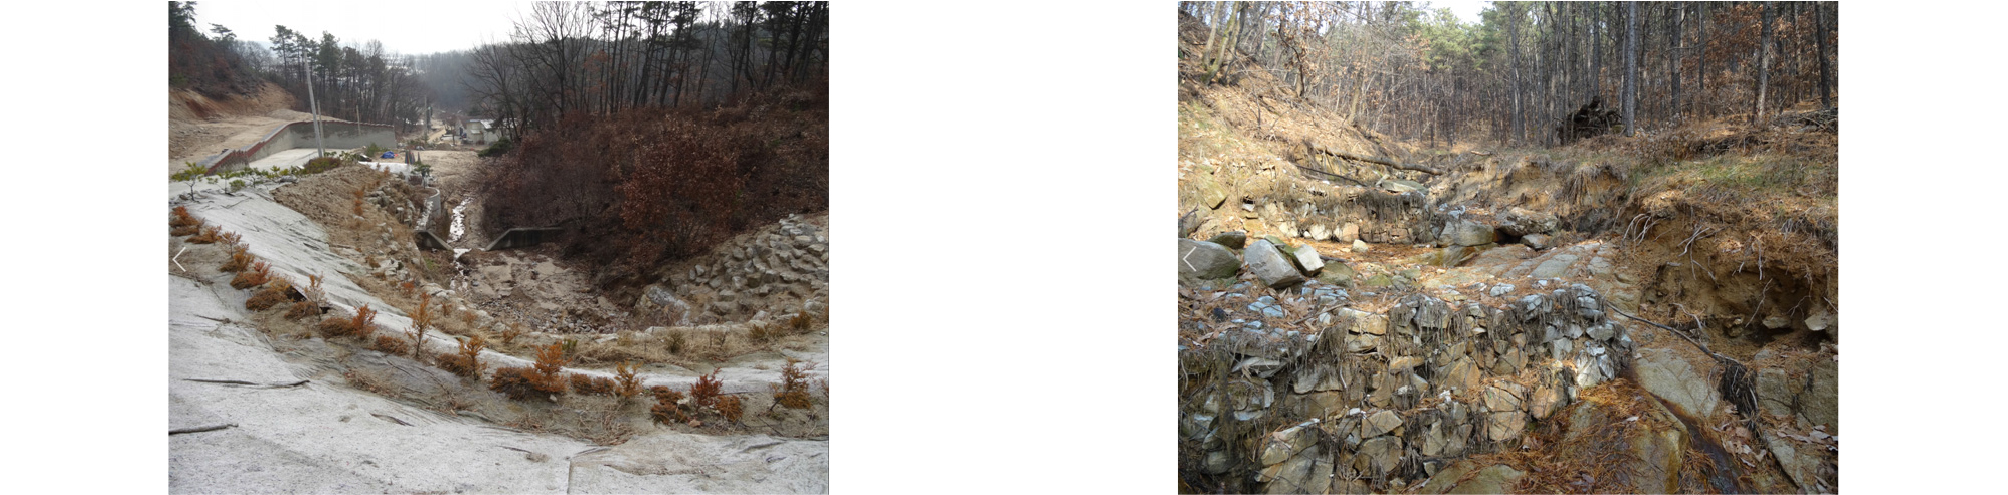
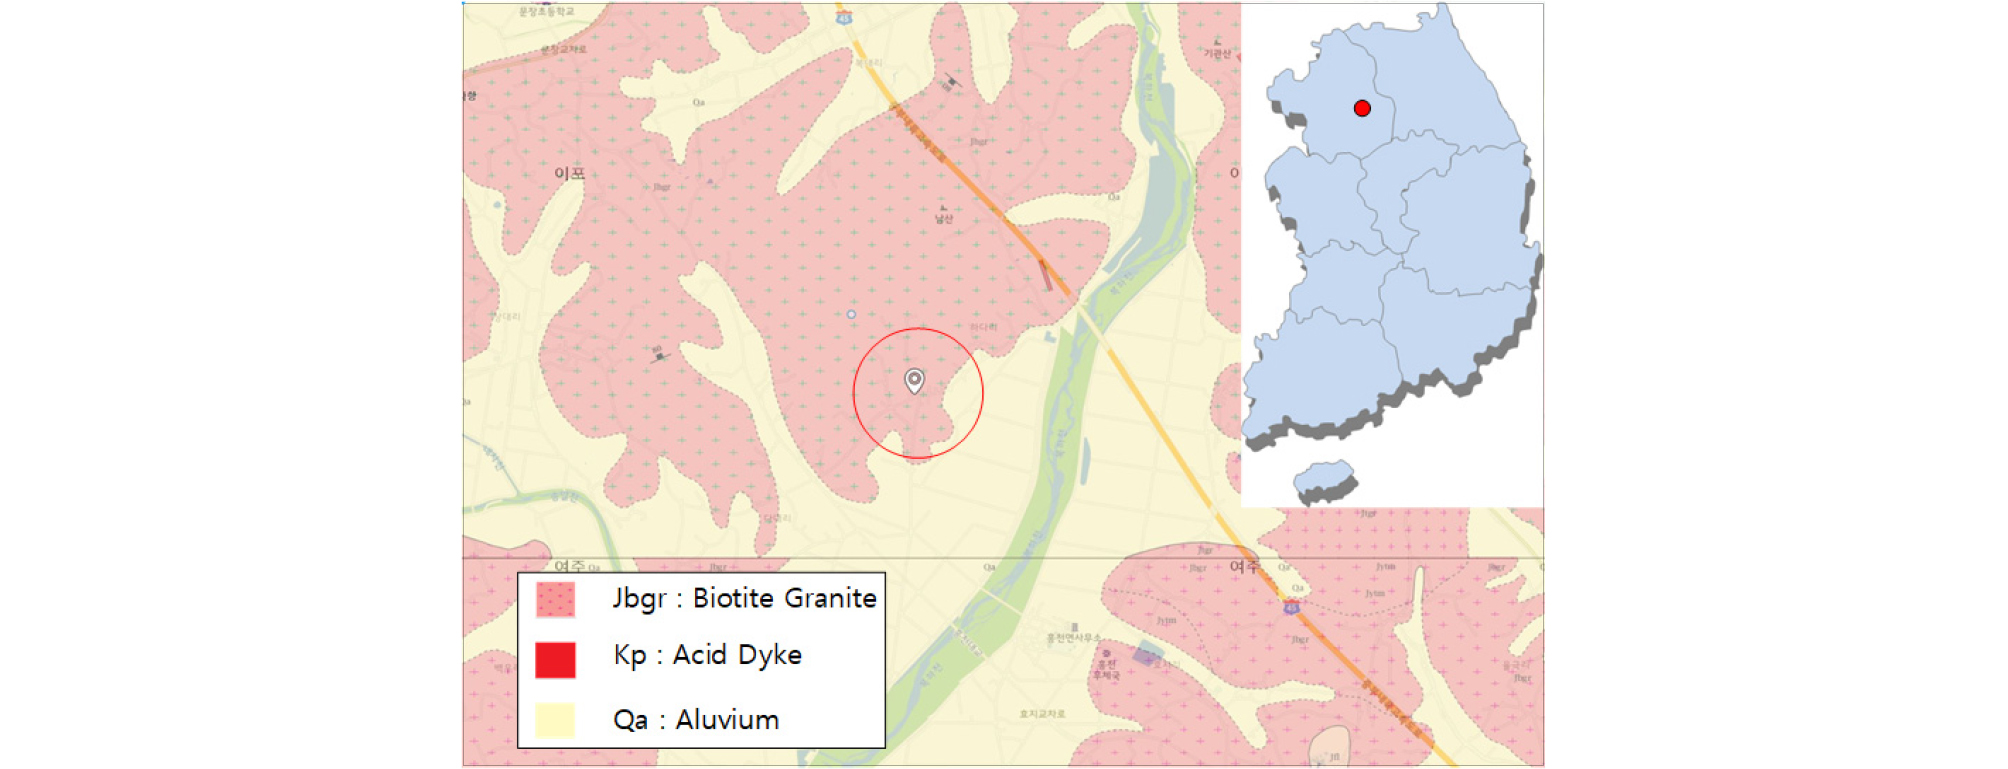
The study area is located in the Hadari region of Yeoju city in Korea. North of Hadari village is Mt. Namsan (elevation, 180 m), and a large valley is located to the west. Water flow in the valley is typically small, although the flow increases in summer. A check dam has been constructed in the lower part of the valley to prevent flooding. In middle and upper parts of the valley, gabions have also been installed (Fig. 1). The geology of the area is mainly hornblende biotite granite, intruded by Jurassic quartz diorite and diorite. The dioritic rocks are partly exfoliated and weakened by weathering (Fig. 2; Korea Institute of Energy and Resources, 1989). The soil is mainly saprolite produced by weathering of the biotite granite, and is covered by thick vegetation.
Field Survey
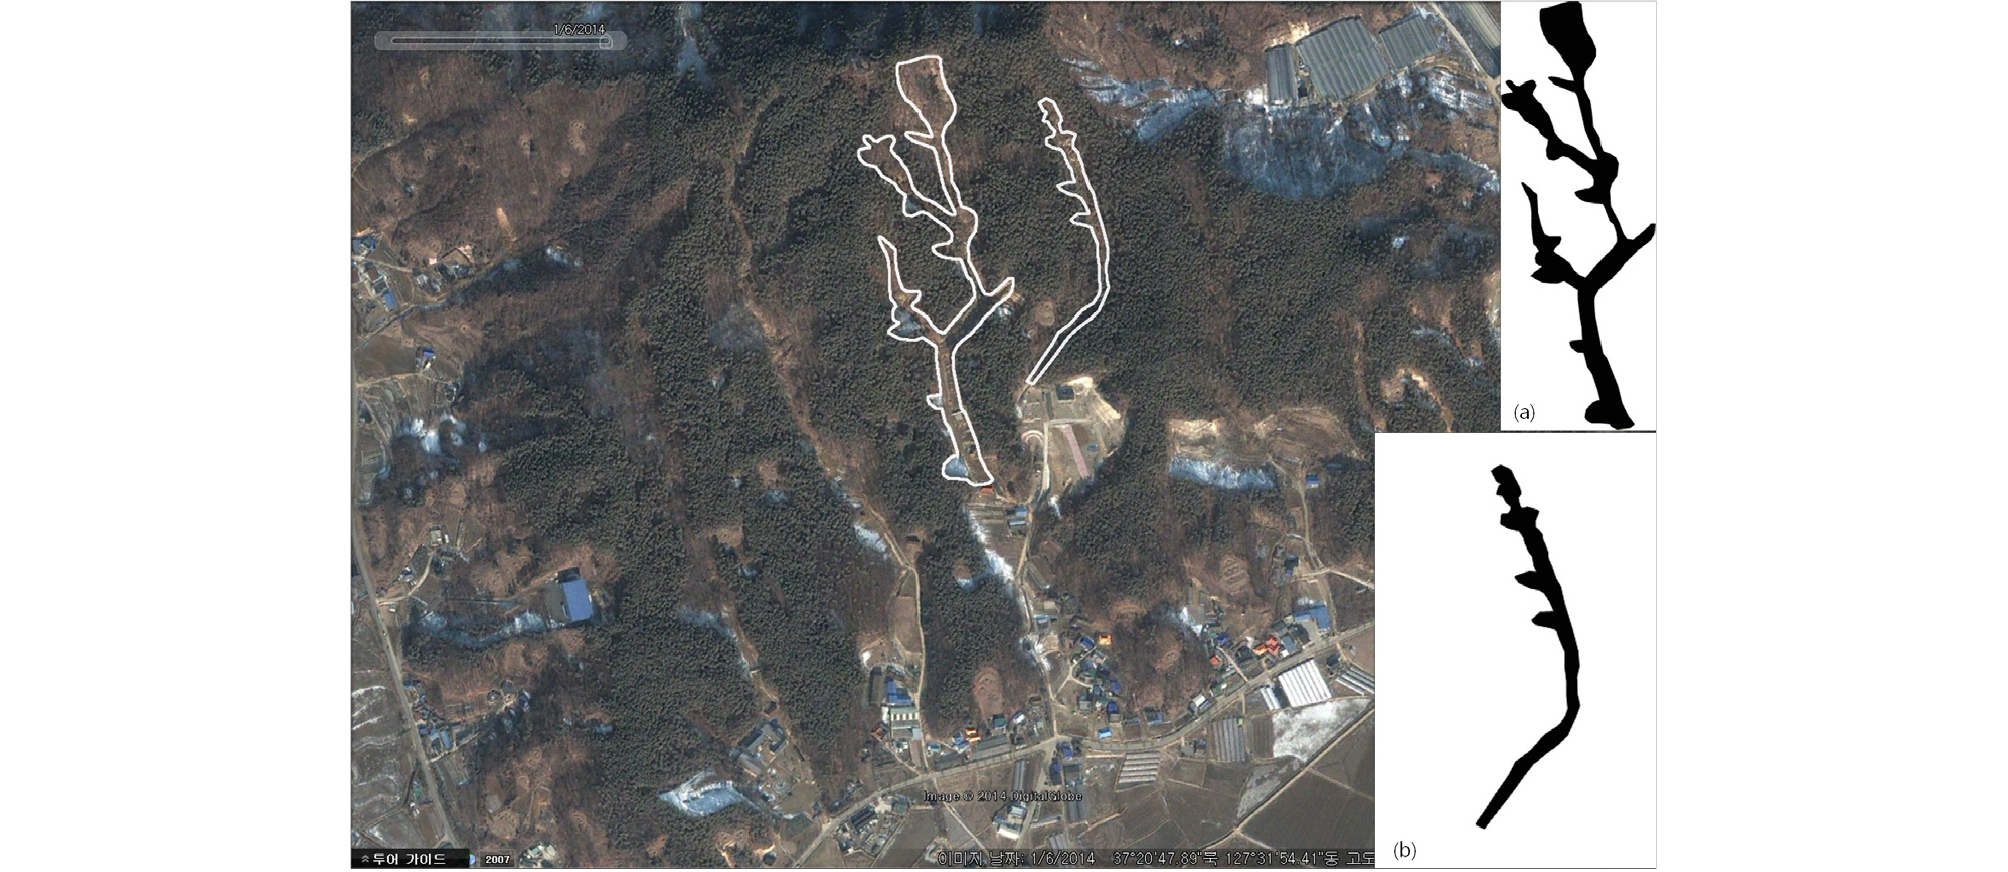
The study area was surveyed soon after the 2013 landslide event. Observations were not difficult because restoration work had not yet begun. Debris flows generated by landsliding were mainly formed in two valleys (Fig. 3). Field surveys were conducted throughout the two valleys at sites where debris flows had occurred (Figs. 3a and 3b). All large and small landslides that had contributed to the material volume of debris flows were examined. The distribution of soil thickness was also recorded.
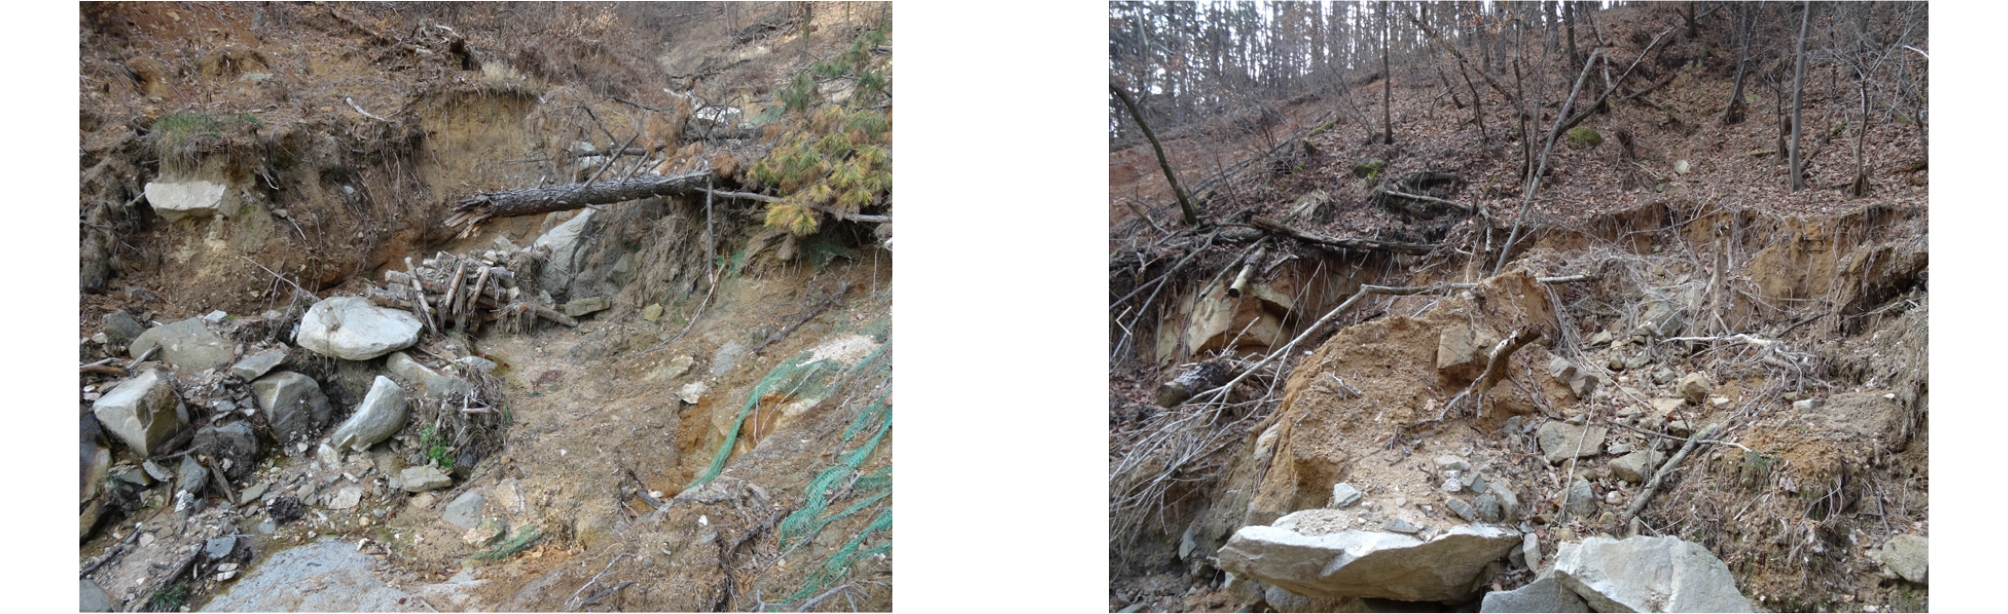
In the west valley (Fig. 3a), thirteen landslides were observed. The largest landslide occurred at the head of the valley, with a height of ~25 m and width of ~15 m. Elsewhere, large and small landslides with average heights and widths of 15 m and 10 m were also observed. Opposite slopes along the valley had average inclinations of ~30°. Valley-head slopes were 28° on average. Soil loss and tree fall were observed across the entire valley, presumably caused by the large-scale debris flows following the landslides (Fig. 4).
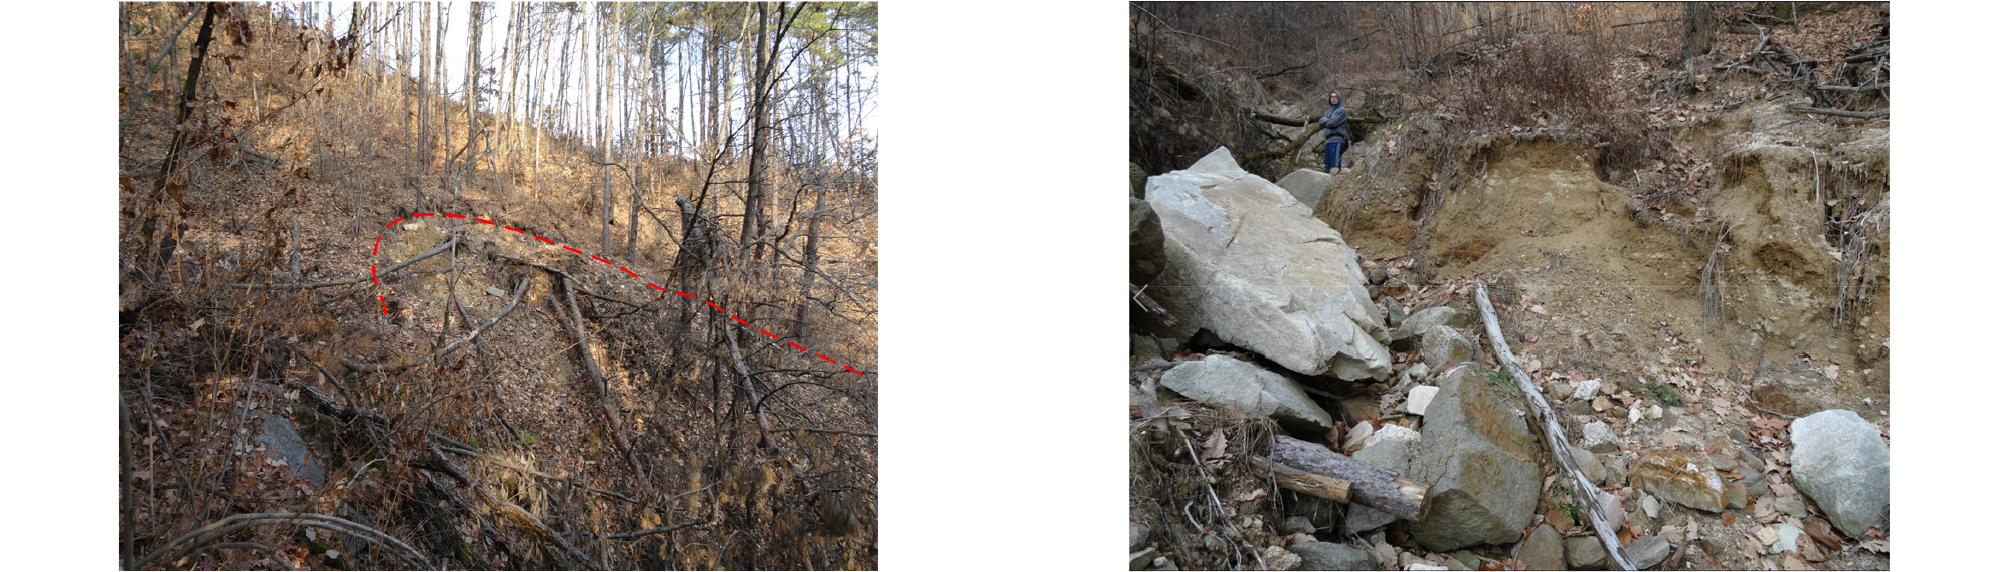
Landslide initiation in the right valley (Fig. 3b) was observed at seven sites, fewer than in the left valley. Large and small areas of landslide initiation were observed, with the largest being 15 m high and 7 m wide. Frequent erosion was noted, especially around the periphery of small side valleys. This is considered to have influenced the volumes of the resulting debris flows (Fig. 5).
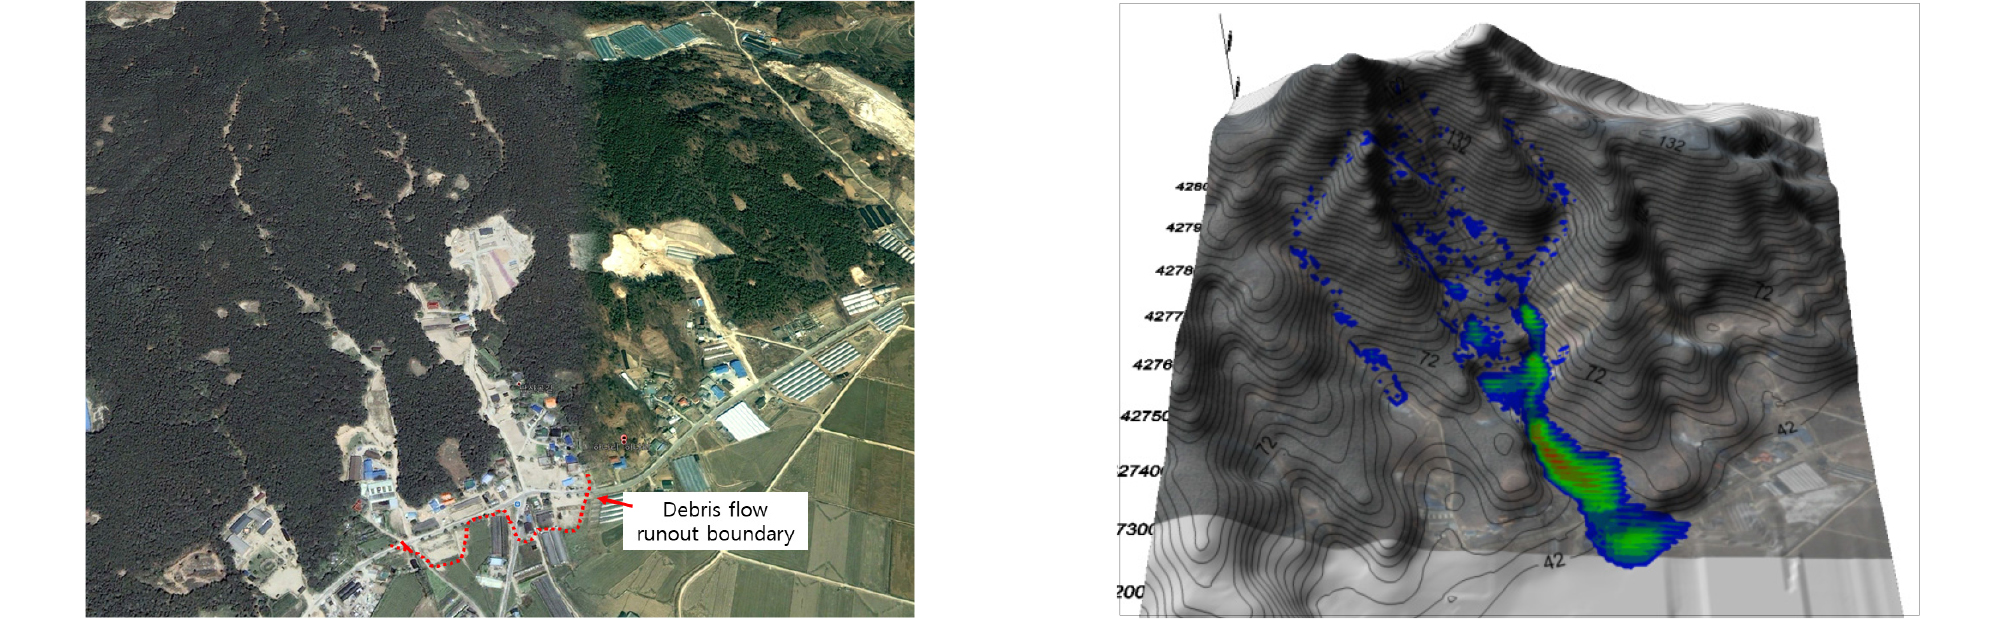
At the exit of the valley, remains of a debris flow (~1 m thick) were examined at a greenhouse located at the village entrance. This debris thickness was used to predict the volume of the flow. Furthermore, it was possible to observe the direction of the debris flow pathway towards the other side of the village entrance. This was confirmed from satellite imagery taken after the landslide event, as the debris flow had changed the color of the floor of the rice paddy (Fig. 6).
Debris 2D Program
This study employed the program Debris 2D, which can be used to calculate the movement of debris flows. Moreover, it can establish within certain limits the velocity and thickness of debris-flow sediments. In essence, the entire debris flow is assumed to be a continuum and is modeled as a non-Newtonian fluid flow. The equations constituting the program are defined as follows, using the three-dimensional configuration relationship proposed by Julien and Lan (1991):
(1)
(2)
where, 𝜏ij is a shear stress tensor,
𝜀ij is a strain rate tensor,
𝜏o is yield stress,
𝜇d is dynamic viscosity,
𝜇c is a turbulent dispersive parameter,
𝜏II is a second-order invariant tensor of shear stress,
𝜀II is a second-order invariant tensor of strain rate.
As follows (Liu and Lee, 1997; Liu and Hsu, 2008; Liu et al., 2009; Liu and Wu, 2010; Liu et al., 2013; Liu and Wu, 2013):
(3)
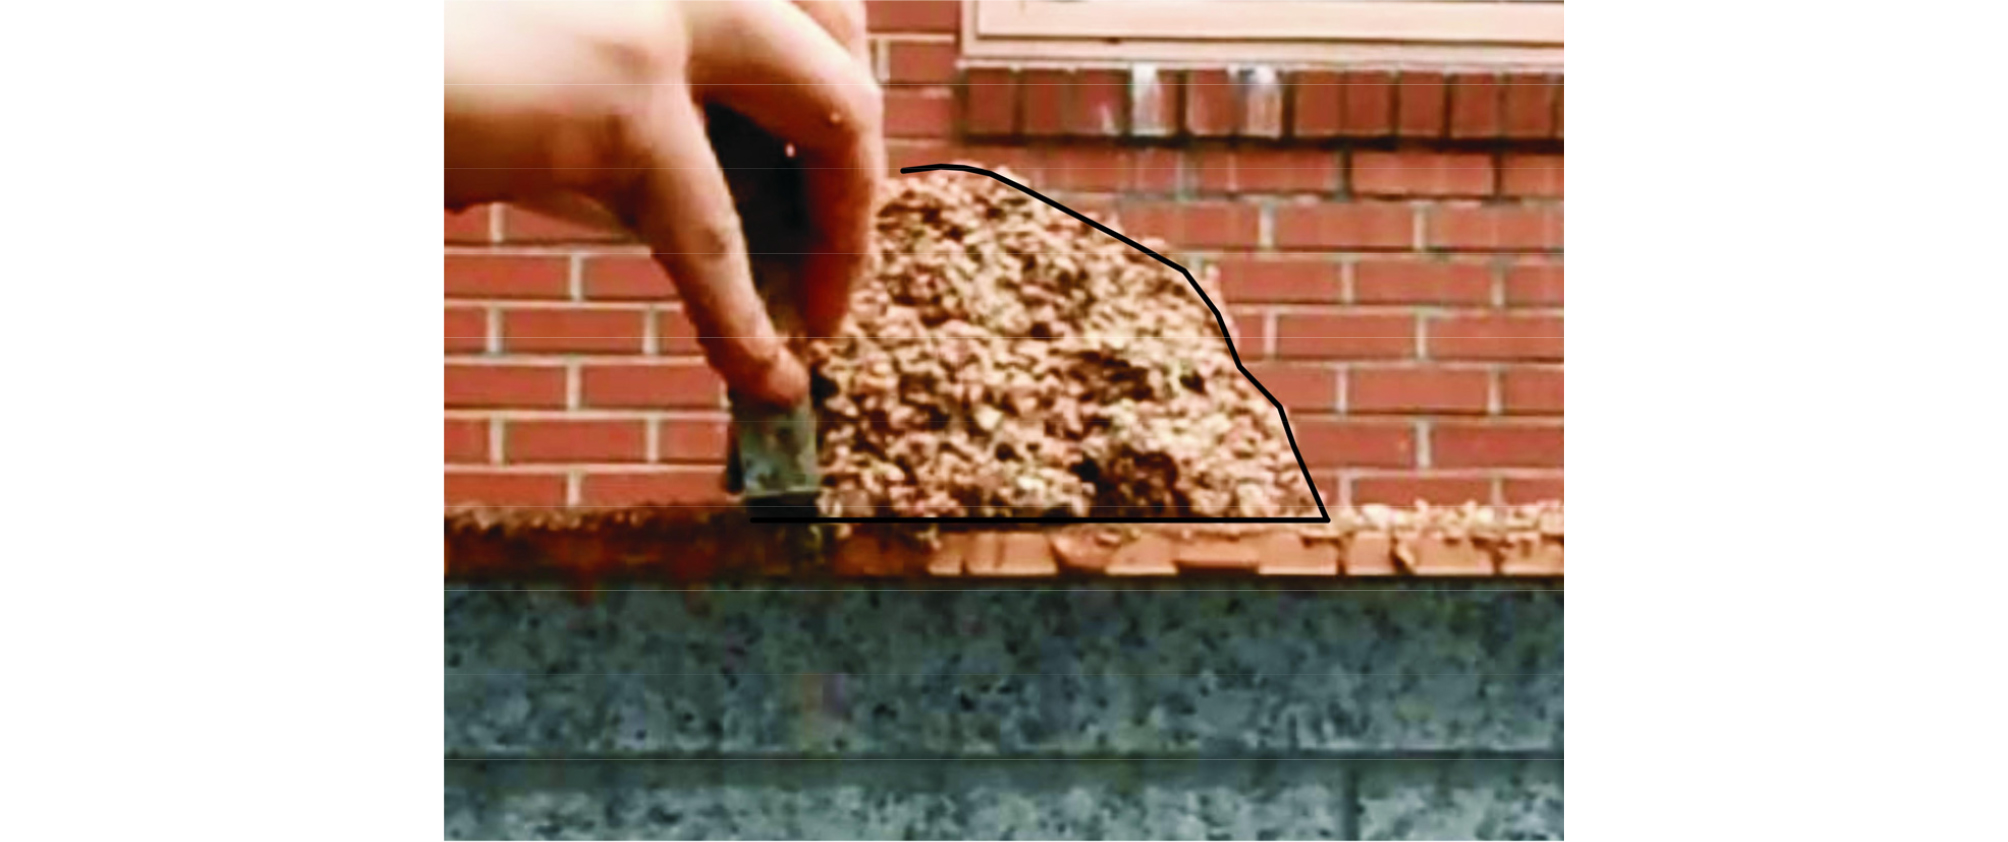
The main input parameters in the program are the yield stress of the material comprising the debris flow and a digital elevation model (DEM) containing the on-site surface elevation. Yield stress provides the input value necessary to define the flow of debris and can be inferred from simple experiments in the field (Fig. 7).
Results of calculations
All sites of landslide occurrence were investigated. The sediment properties used in the calculations were assigned to the initial points of slope failure (Fig. 8). The input yield stress at the time of landslide occurrence is unknown. Yield stress was therefore inferred from simple experiments in the laboratory on soil samples collected in the field, as shown in Fig. 7. The resulting yield stress was ~800 Pa. This value was therefore used in calculations, the results of which are given in Fig. 9.
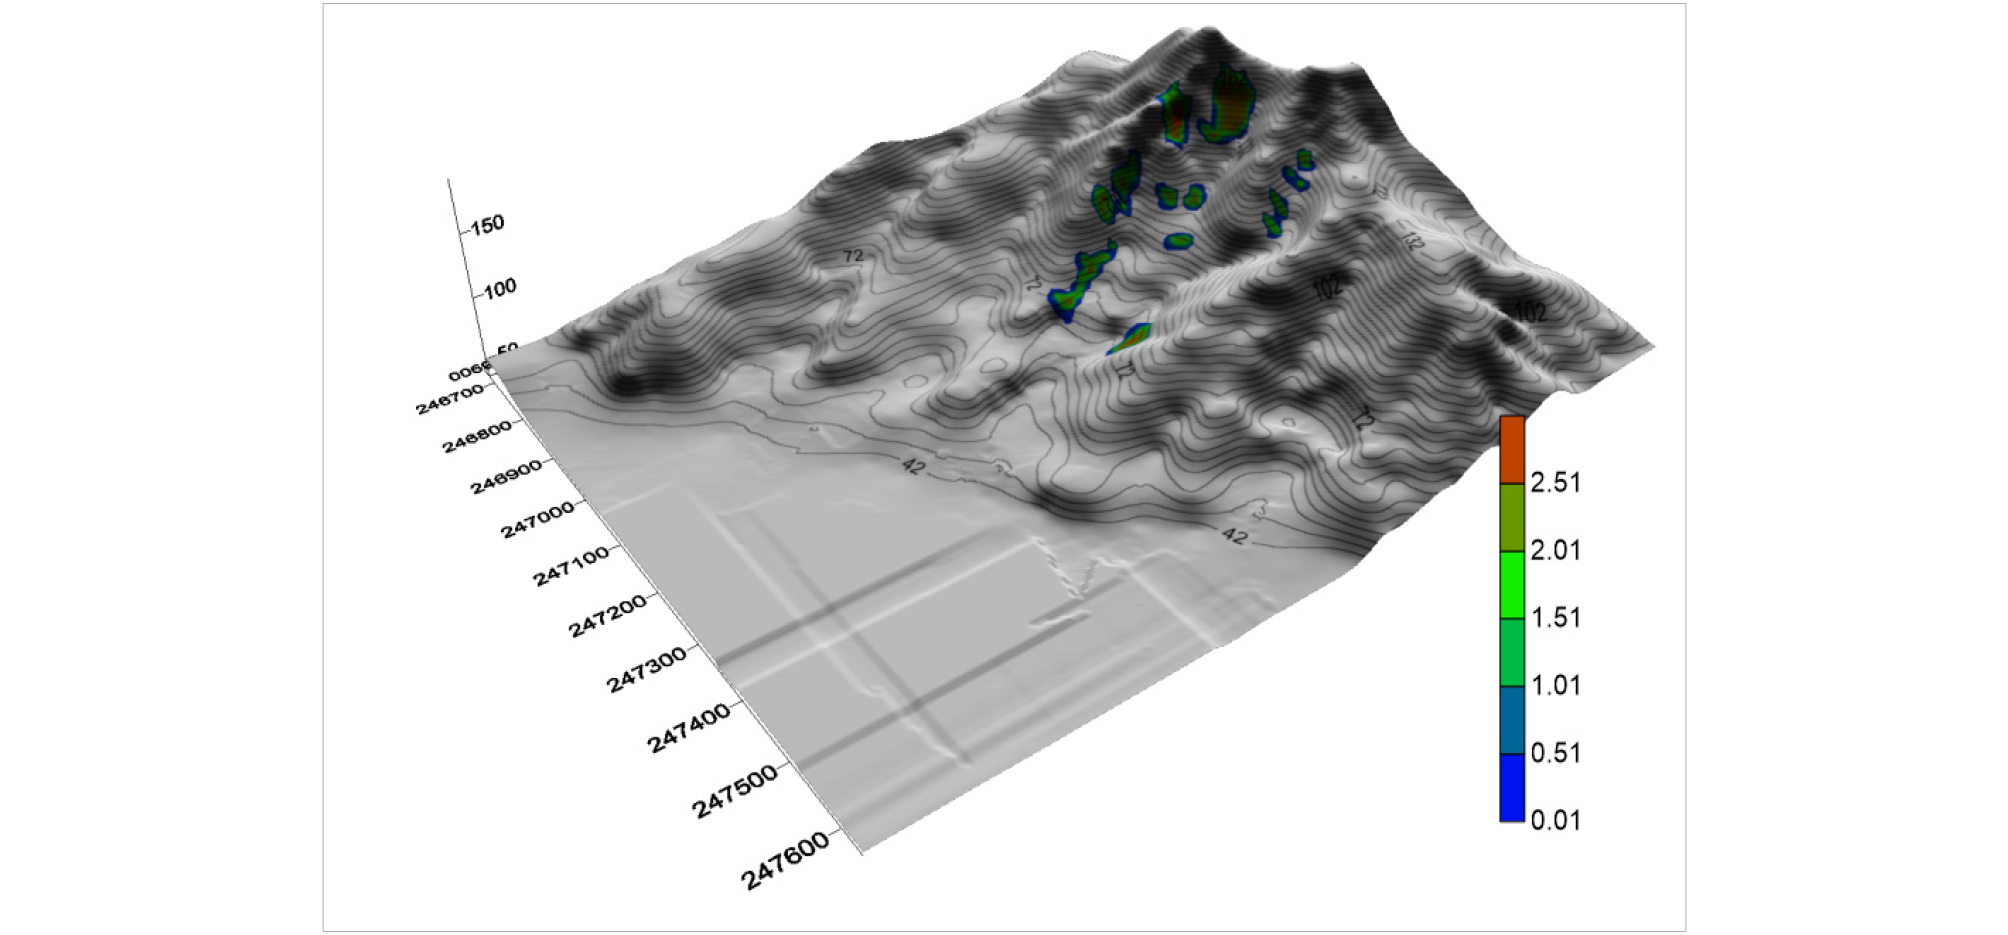
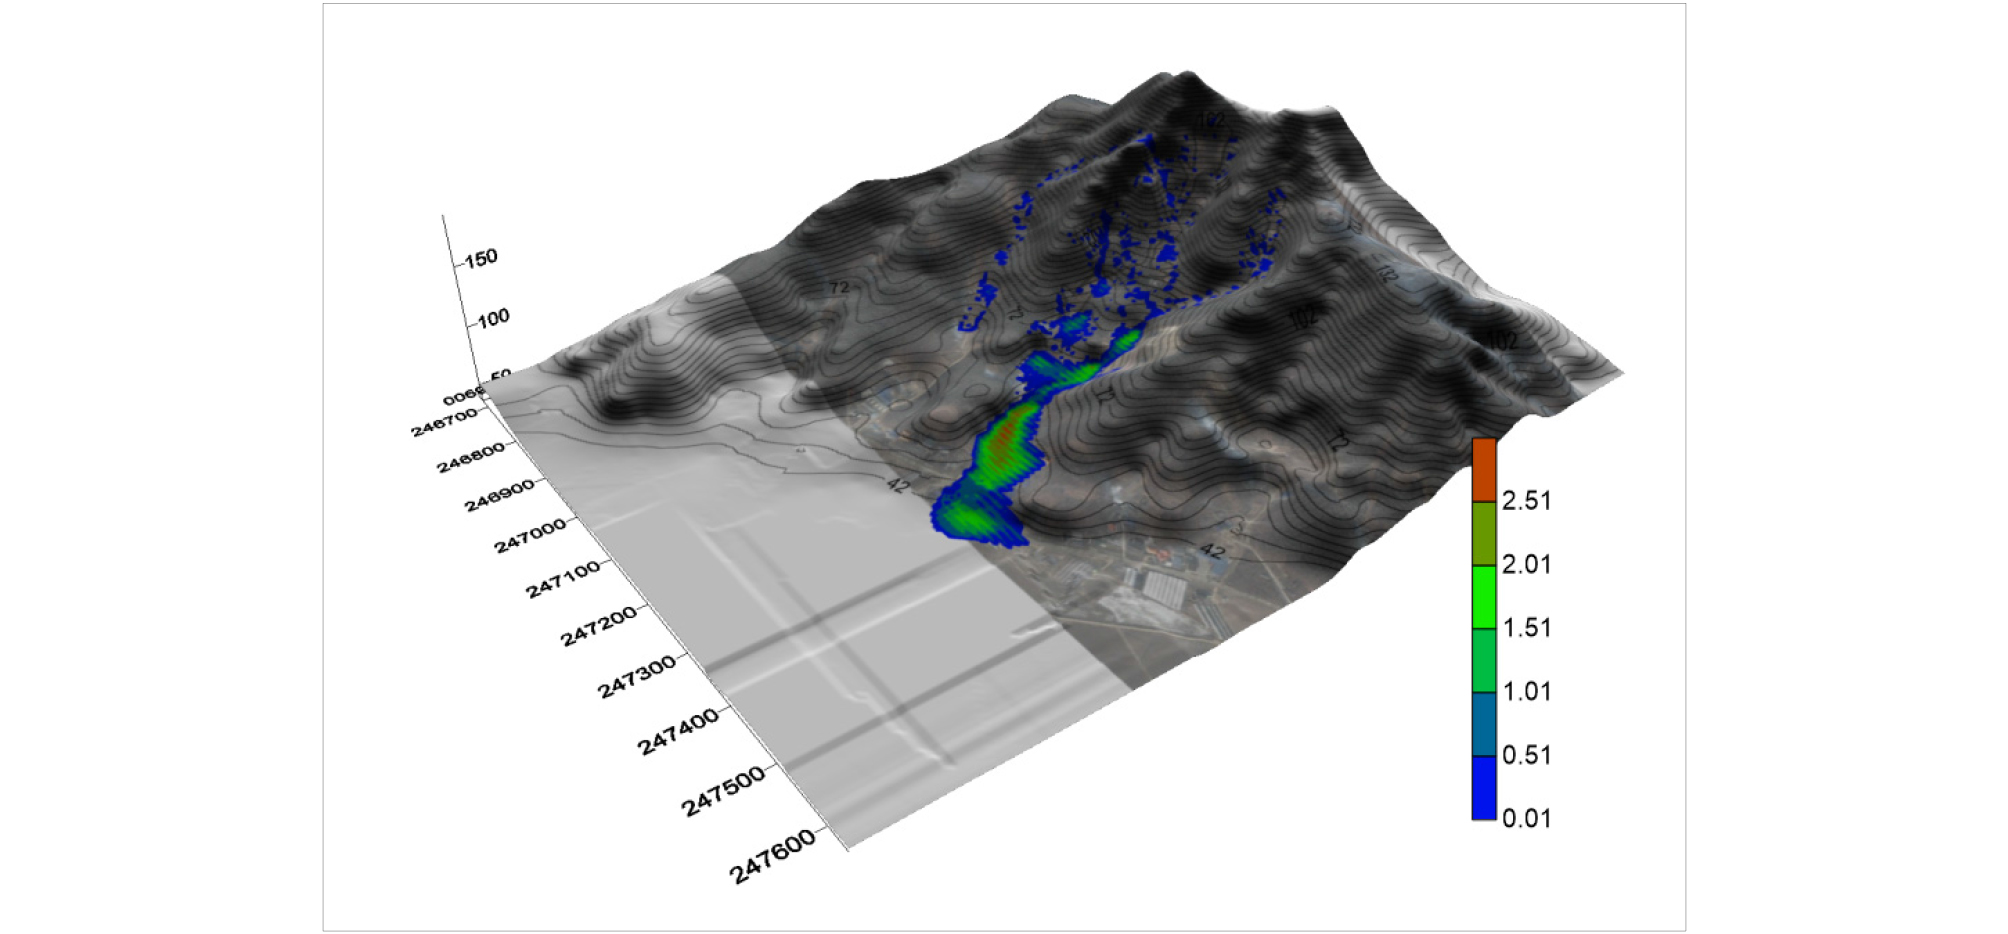
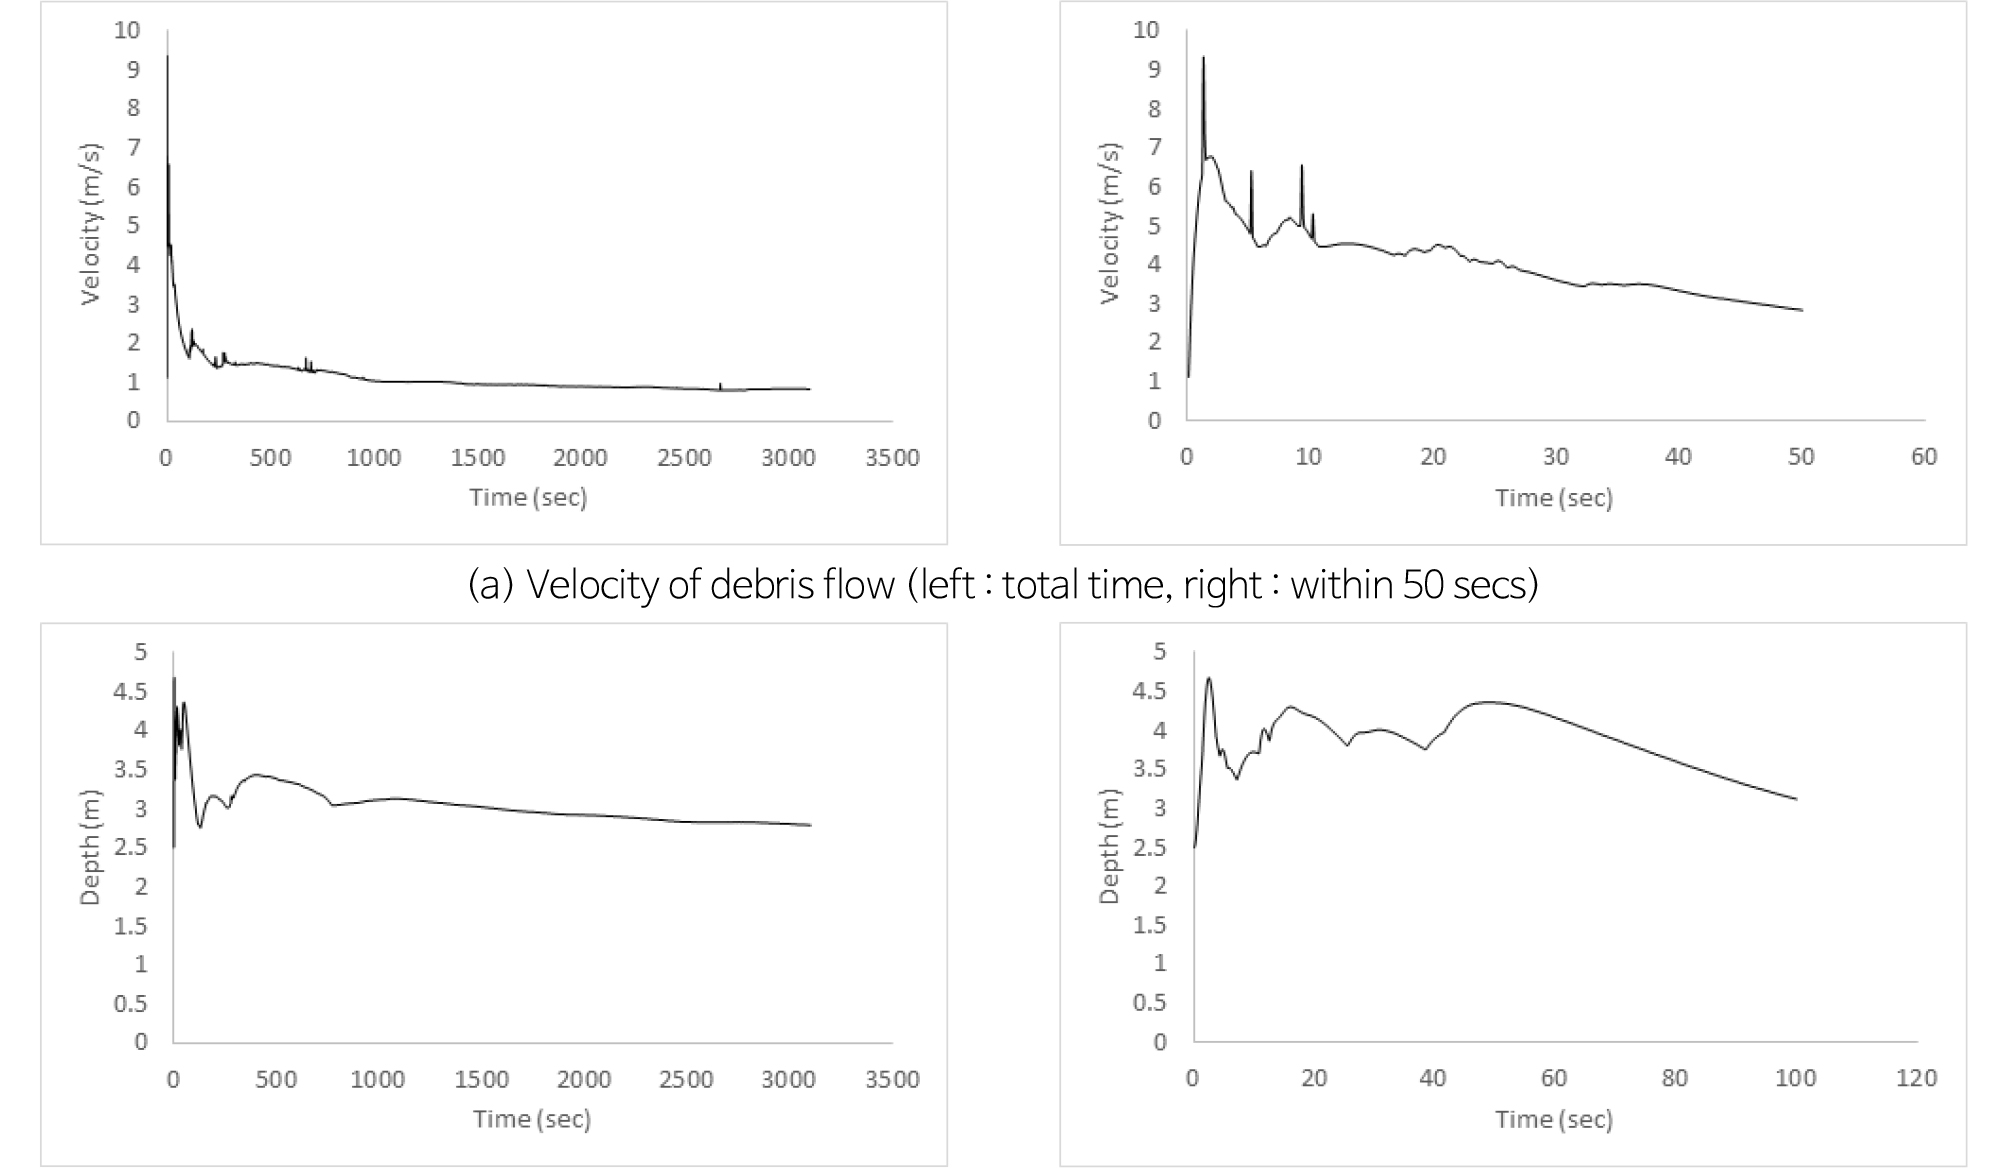
The modeling results are consistent with the actual debris flow run-out shown in Fig. 10. The calculated maximum velocities and sediment thicknesses of the debris flow are given in Fig. 11. The maximum debris flow velocity is 9.335 m/s, which occurred 1.3 s after movement commenced. After that time, the debris flow velocity showed an abrupt decrease until movement ceased. As also shown in Fig. 11 (b), a maximum sediment thickness of 4.674 m occurred, 2.5 s after transport commenced. This subsequently decreased and increased repeatedly. After debris flow movement had ceased, the maximum sediment thickness was ~2.7 m in the upper part of the valley where the village is located. This concurs with an average observed thickness of ~2.7 m, as indicated by the red shading in the right side of Fig. 10.
Conclusions
We investigated an area of landslides near Hadari in Yeoju city. The characteristics of the debris flows were recorded during field surveys. The results of numerical analysis are consistent with data obtained in the field. Debris flow modeling used input data for location, yield stress, and sediment thickness, obtained from field surveys. Results show that the maximum debris flow velocity of 9.335 m/s occurred 1.3 s after movement commenced. The maximum thickness of the debris flow sediment was 4.674 m, 2.5 s after the start of the debris flow.
