

Introduction
Study Area
Materials and Methods
Device Manufacture
Classification of Test Areas
Results and Discussion
Electrical Resistivity Survey Results and Interpretation
Injection and Suction Test Results and Analysis
Slug Test Results and Analysis
Conclusions
Introduction
Technology to remediate contaminated soil has been widely developed in the United States since the 1980s (KOSSEG, 2001), and now, efforts are being made to apply many technologies internationally, including in Korea. Remediation methods can be broadly divided into on- and off-site treatments according to whether treatment is possible within the contaminated site. In-site treatment is either ex-situ (involving excavation) or in-situ (without excavation) (Kim, 2009).
Between 1982 and 2008, 1,135 projects decontaminated soil at Superfund sites in the United States: 53% (598 projects) applied treatments underground, and 47% (537 projects) used above-ground treatments (Jang et al., 2020). The rate of in-situ technology applied at Superfund sites was on average 33.5% (21~47% each year) between 1985 and 1990, 49% (41~61% each year) from 1991 to 2000, and 63.6% (44~79% each year) from 2001 to 2005, thus showing a gradually increasing trend (Ministry of Environment, 2007; Jang et al., 2020).
The Korean Soil Environment Conservation Act (2020) states that, in principle, contaminated soil should be remediated on-site. On-site methods proposed for use in Korea include in-situ methods like bioventing, biodegradation, phytoremediation, natural attenuation, chemical oxidation, electrokinetic separation, soil flushing, solvent extraction, and electrode heating (Ministry of Environment, 2007). Chemical oxidation and soil flushing are relatively quick methods that offer efficient remediation within a short period, and they are mainly applied in the in-situ remediation of oil-contaminated soil.
The quality of soil should be considered during in-situ decontamination, which can be affected by geological factors such as the constituent rocks of the study area, the degree of weathering, and various characteristics such as particle size distribution, coefficient of uniformity, and relative density that vary by region. Coarse, loose soil and soil with a high uniformity coefficient have high permeability; they allow cleaning agents to move relatively easily and spread evenly, resulting in high remediation efficiency.
However, soil with a low uniformity coefficient, fine-grained, dense soil, or multi-layered soil comprising fine- and coarse-grained material is difficult to remediate. Only partial remediation thus results, because the movement of the cleaning agent is restricted and it does not spread evenly throughout the soil. It may take a long time to complete the remediation.
Considering cases of remediation being unavoidably difficult because of factors such as impaired remediation efficiency or contamination over a small area, Korean law was revised in 2005 to allow limited off-site treatment (Hwang et al., 2014). In areas where remediation efficiency is lowered owing to the release of contaminated soil or in areas requiring long-term remediation, on-site treatment is avoided to improve site utilization and economic efficiency. Expediting soil remediation and increase the efficiency of underground remediation requires improvement of the delivery rate of the cleaning agent to allow effective delivery to the contaminated soil. There is, therefore, a need to develop an effective delivery method.
The efficiency of underground remediation depends on the delivery speed and range of influence of the cleaning agent. To increase remediation efficiency, the agent should be delivered to the contaminated soil quickly and should penetrate evenly over a wide range without concentrating in part of the contaminated plume. To achieve this, various technical applications and evaluations have been carried out at Superfund sites (EPA, 1995; Purdue ECT Team, 2007).
The Korean Ministry of Environment have studied enhanced in-situ remediation using pneumatic fracturing (Ministry of Environment, 2011). Several related patents have been registered, such as methods of remediating contaminated soil by injecting air or hydrogen peroxide at high pressure (Jang et al., 2020). Pneumatic fracturing involves the injection of highly pressurized air into consolidated contaminated sediments to extend existing fractures and create a secondary network of fissures and channels. This enhanced fracture network increases the permeability of the soil (EPA, 1995). As plasma blasting effectively forms cracks in the ground using relatively low energy, it has long been studied as an alternative to explosives for fracturing rocks (Lee et al., 1997; Chae et al., 2006; Chen et al., 2012). Riu et al. (2019) studied the possibility of fracturing shale bedrock using plasma blasting instead of hydraulic fracturing.
Soil vapor extraction (or vacuum suction) is an in-situ method that removes pollutants from soil by installing suction wells on an unsaturated aquifer to apply vacuum pressure to the soil (Ministry of Environment, 2007). Generally applied pneumatic fracturing only forms macrocracks, and through constant channeling, remediation does not proceed effectively through cracks other than major cracks. Remediation efficiency is also reduced by evenly injecting the remediation agent into areas outside the contaminated plume.
This study considered improving the delivery of soil remediation agent into the ground by simultaneously combining pneumatic fracturing, plasma blasting, and vacuum suction (PPV). The resulting PPV method gained the following advantages from its combined components: vacuum suction allows effective targeting of the contaminated plume; plasma blasting overcomes the limitation of microcrack formation by pneumatic fracturing, allowing continuous pressure injection to be induced. In other words, forming a dense crack network in which macrocracks and microcracks are combined and applying a pressure gradient to the contaminated plume ultimately facilitated the injection of the remediation agent and increased remediation efficiency.
This study aimed to identify the fluid transfer characteristics of the PPV method—which was developed to improve the mobility of the soil remediation agent—and to verify its effectiveness. A qualitative evaluation was conducted by manufacturing a full-scale remediation device and assessing changes in electrical resistivity. In addition, fluid delivery time, fluid injection amount, suction amount, and hydraulic conductivity in the injection and suction wells were quantitatively measured. If the PPV method can improve the duration and efficiency of remediation, in-situ treatment can be recognized in Korea as an economical and effective pollution-treatment method, and can be used more widely in future.
Study Area
The study area is around Dongmak-ri, Sotae-myeon, Chungju-si, Korea, where Jurassic biotite granite is widely distributed. To confirm the geological distribution and ground conditions, four survey holes (BH-1 to BH-4) were drilled (Fig. 1). The drilling investigation identified three main components of the stratum: colluvium, a weathered zone (weathered soil, weathered rock), and bedrock (soft, moderate, and hard).
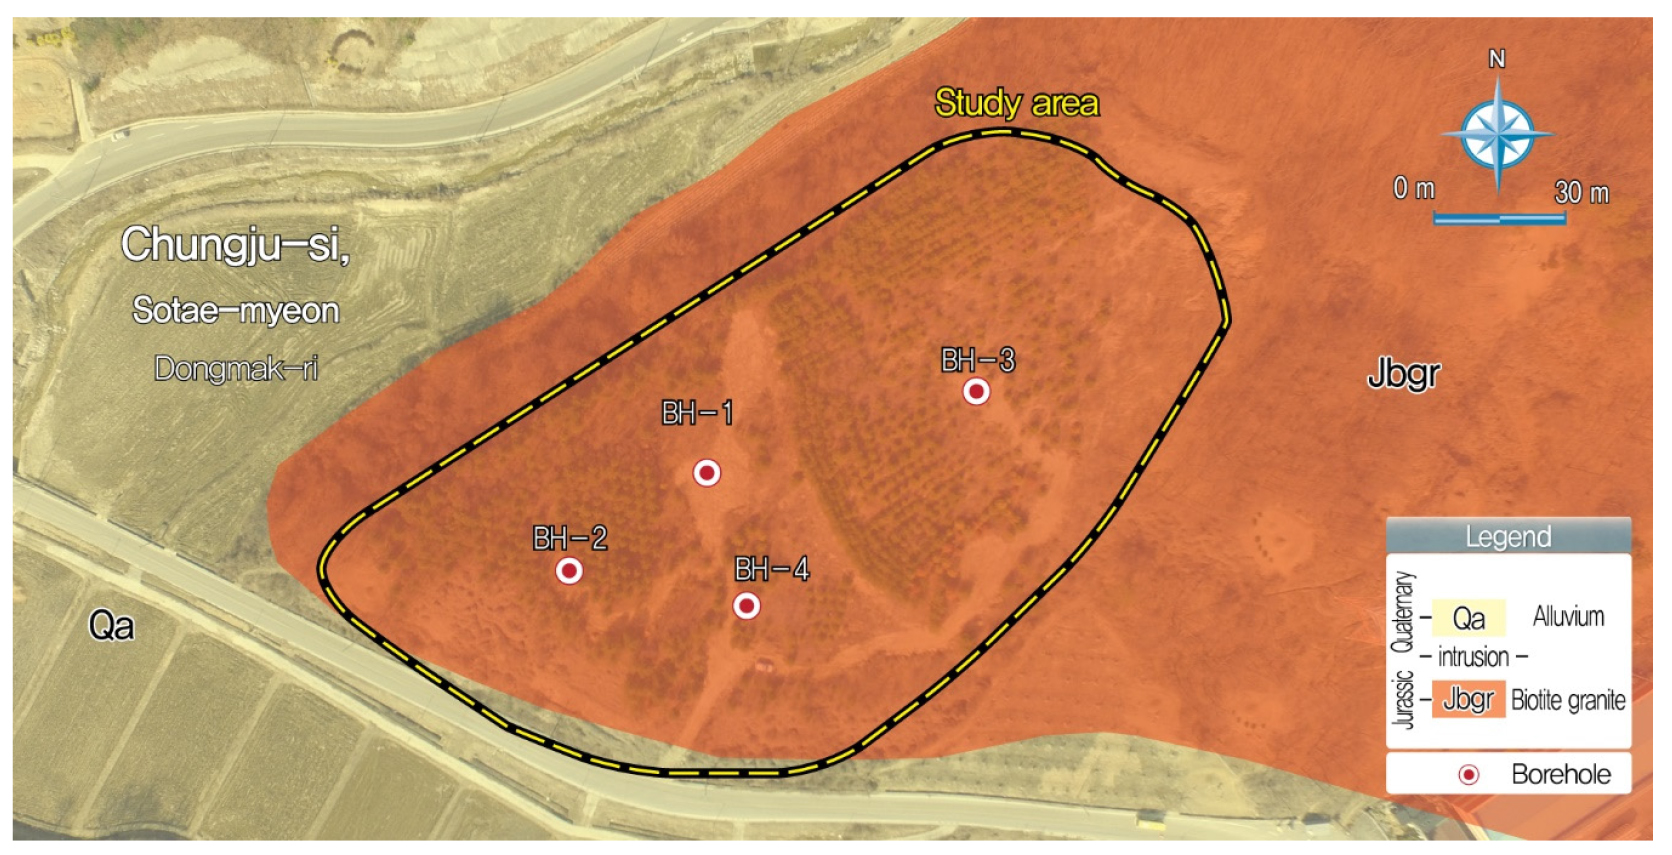
Colluvium is a soil sedimentary layer created by gravity and about 0.4~0.5 m of colluvium is distributed at the top. Below this is the weathered zone, the main test target, comprising about 4.2~7.0 m of yellowish brown to dark brown pebbly sand or silty sand. The underlying bedrock is dark gray biotite granite at about 4.6~7.5 m below the surface. Standard penetration testing of the weathered-rock soil layer in the study area gave an N-value of 0.3 m/50 blows or less, thus confirming is very high relative density. The groundwater level is about 7.34~8.95 m below the surface, and thus below the weathered rock that determines the transmission characteristics (Table 1).
Table 1.
Drilling survey results
Materials and Methods
Device Manufacture
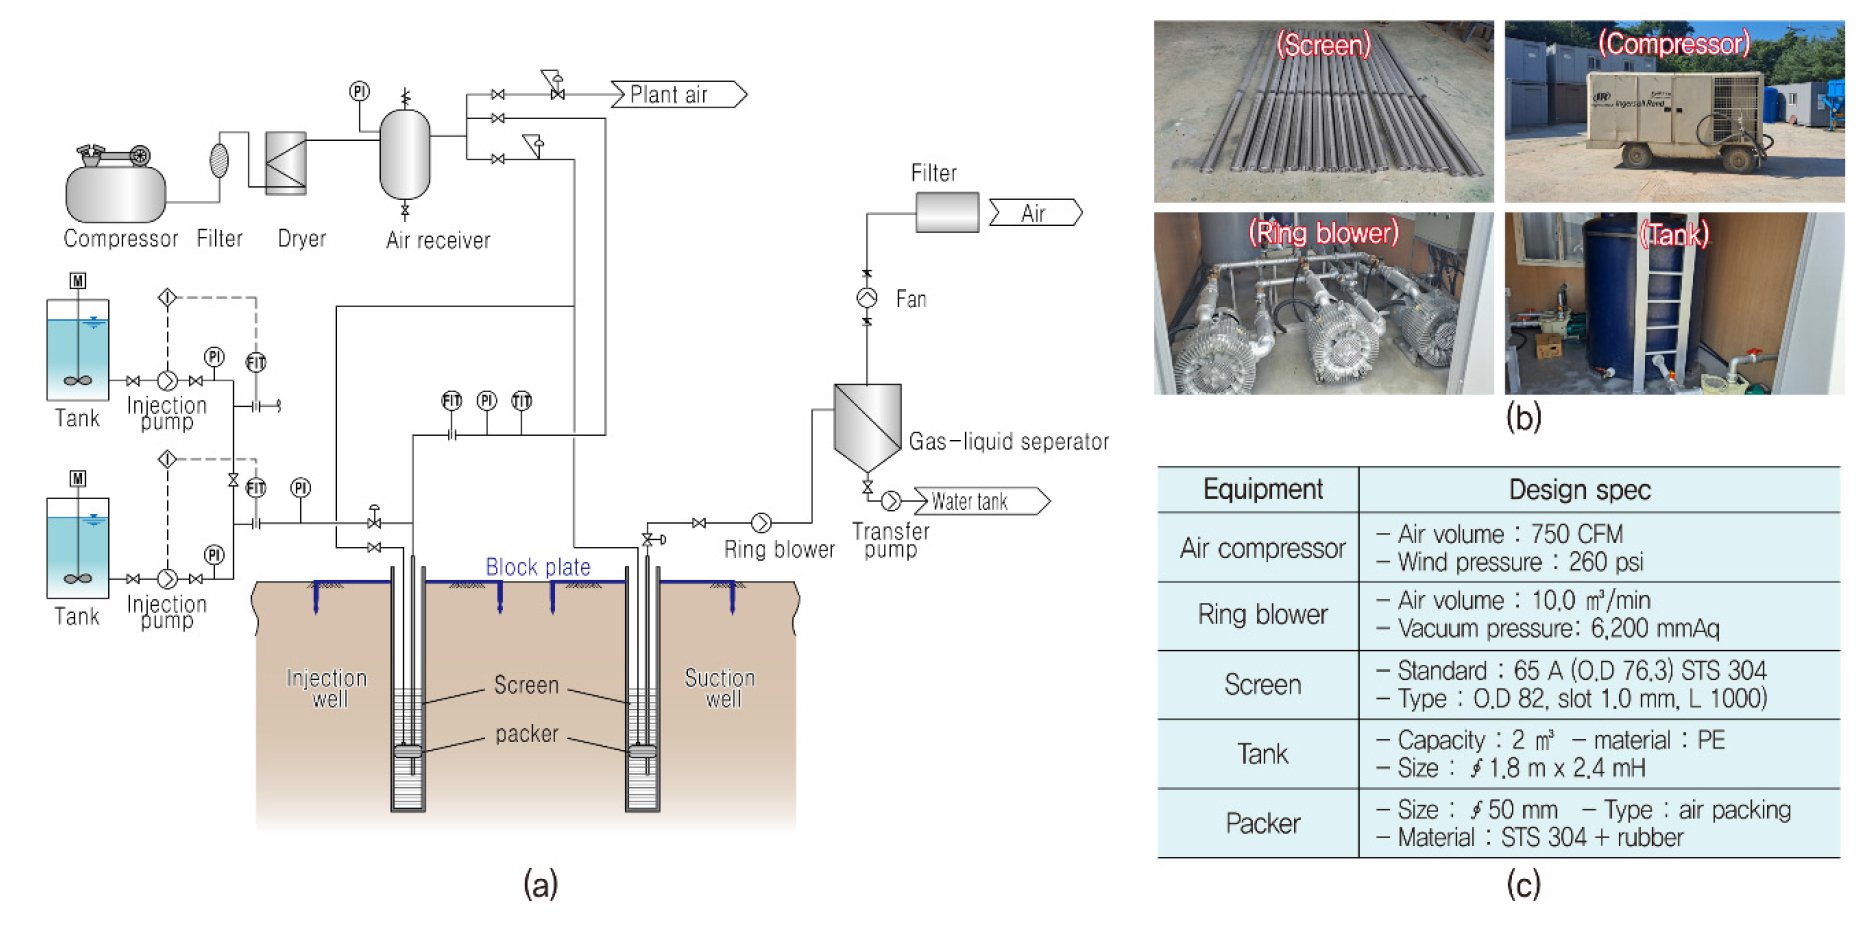
The PPV apparatus capable of combining pneumatic fracturing, plasma blasting, and vacuum suction has two main parts: a set of devices for pneumatic fracturing and vacuum suction, and another set of devices for plasma blasting.
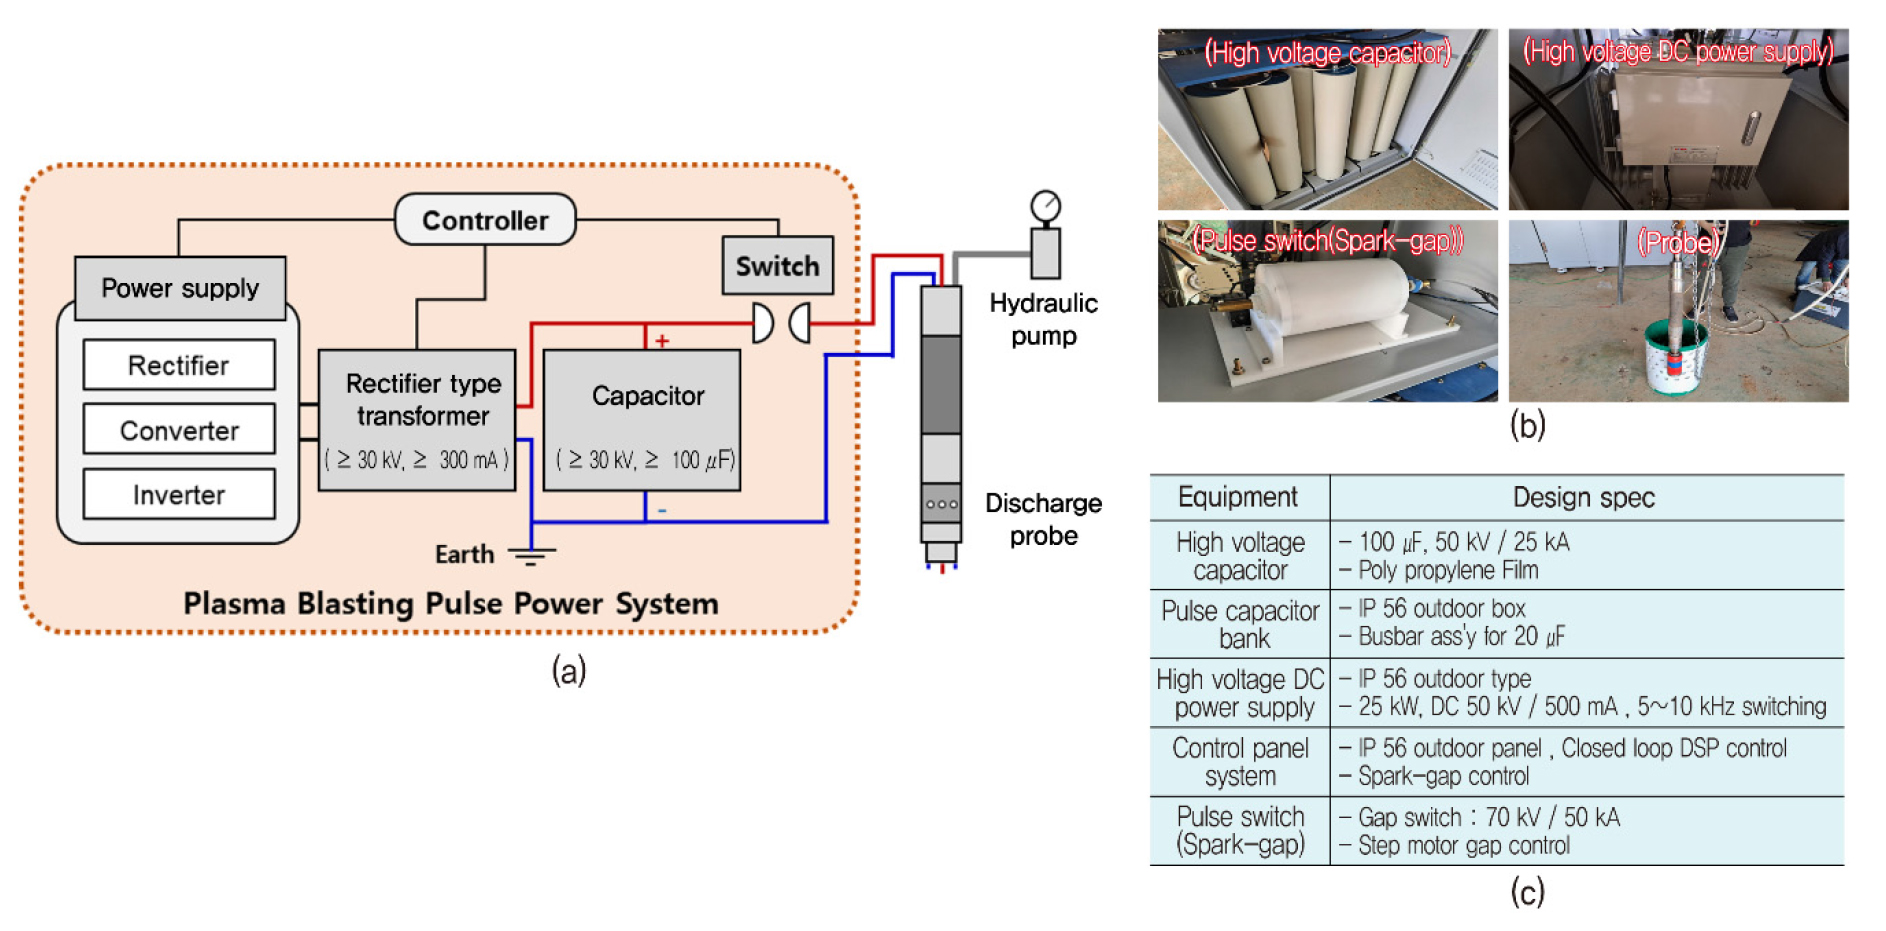
The first set includes an air compressor, a tank for storing remediation agent, an air receiver, an injection pump, a vacuum suction pump, a gas-liquid separator, and an air filter. There is also a screen, packer, and pressure block plate for use in the injection and suction wells (Fig. 2). The set of devices for plasma blasting includes a high-voltage capacitor, a power supply, a high-voltage power cutoff, a spark gap switch, a plasma discharge probe, and a charge/discharge LCD screen (Fig. 3).
Classification of Test Areas
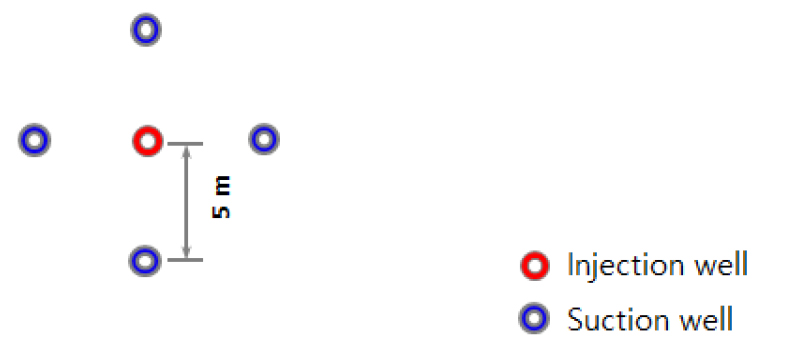
The test area was divided into three areas for comparison of three process regimes: PPV alone (PPV-I), a commonly used chemical oxidation method alone (control A), and PPV and chemical oxidation performed sequentially (PPV-II and control B) (Fig. 4). Each test area had one injection well and four suction wells so that the irregular underground flow characteristics could be assessed as fully as possible (Fig. 4). Wells were drilled to about 3 m below the surface based on the results of the drilling survey.
At each test area, electrical resistivity surveying, fluid injection and suction tests, and slug tests were performed to compare the control and experimental methods. To ensure smooth testing and to minimize each test’s influence on the others, electrical resistivity surveying was conducted for control B and PPV-II. injection and suction tests were conducted for control B, PPV-I, and PPV-II. slug testing was in two of the survey boreholes (BH-1, BH-3), control A, PPV-I, and PPV-II.
Electrical Resistivity Survey
In-situ treatment requires a soil remediation agent to be introduced into the ground. As the agent is mostly water, its injection, if efficient, will create a wide zone of low resistivity. Electrical resistivity surveys therefore compared the efficiency of injection for the control and experimental procedures at the same location.
Surveying employed dipole-dipole arrays, which, while vulnerable to noise, is effective due to its high resolution (Kim et al., 2001). This survey method was used here, because there is little noise and high resolution is required. The survey was performed first for control B and then PPV-II.
Two electrical resistivity lines (line-1 and line-2) were placed across the well site, passing the injection well and the suction wells (Fig. 5). Each line was about 23 m long, and the electrode spacing was 1 m. There were 20 electrodes to record stable deep data considering the detectable depth (Table 2).
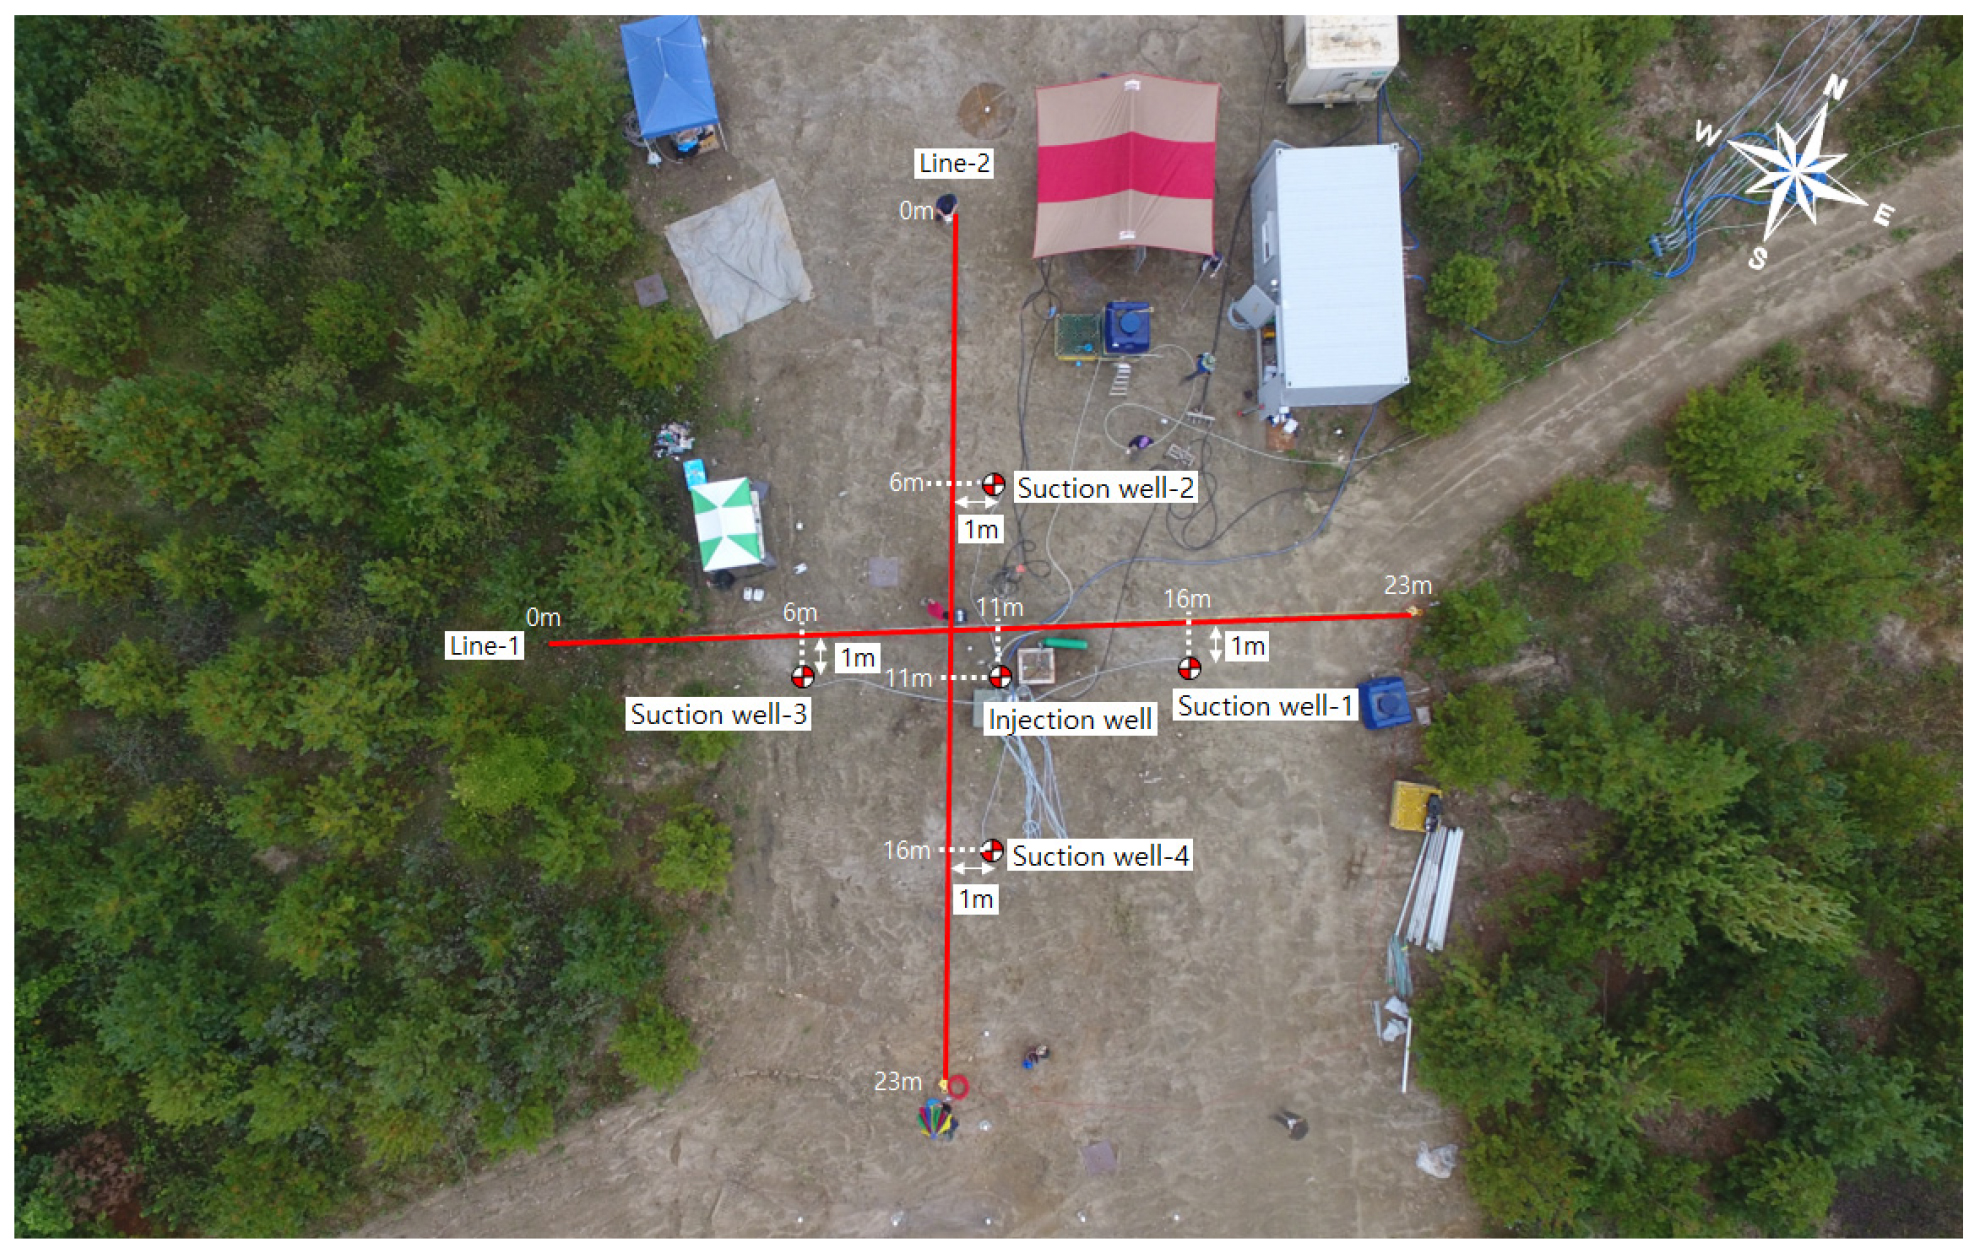
Table 2.
Electrical resistivity survey parameters
| Index | Electrode array | Electrode spacing (m) | Length (m) | Electrode separation | Measurement |
| Line-1 | Dipole-dipole | 1 | 23 | 20 | Before and after PPV |
| Line-2 | Dipole-dipole | 1 | 23 | 20 | Before and after PPV |
Injection and Extraction Tests
The injection and extraction tests considered experimental groups PPV-I and PPV-II and control groups A and B to evaluate the PPV method. The injection amount, injection time, suction amount, and suction time were monitored. The experimental groups used pneumatic fracturing pressures of 490 and 980 kPa considering the device’s field operation conditions. Fracturing was performed five times for each case. Vacuum suction applied a pressure of 20 kPa and the plasma discharge applied five discharge shots at 20 kV. Fluid injection for the control and experimental procedures used gravity injection in the same manner under atmospheric pressure, assuming a common construction (Fig. 6, Table 3).
As the study area was not contaminated, hydrogen peroxide, a remediation agent used mainly for oil contamination, was not used. Instead the injection fluid was water with added ink to allow visual inspection and sodium chloride to confirm changes in electrical conductivity in the suction well and thus assess fluid flow.
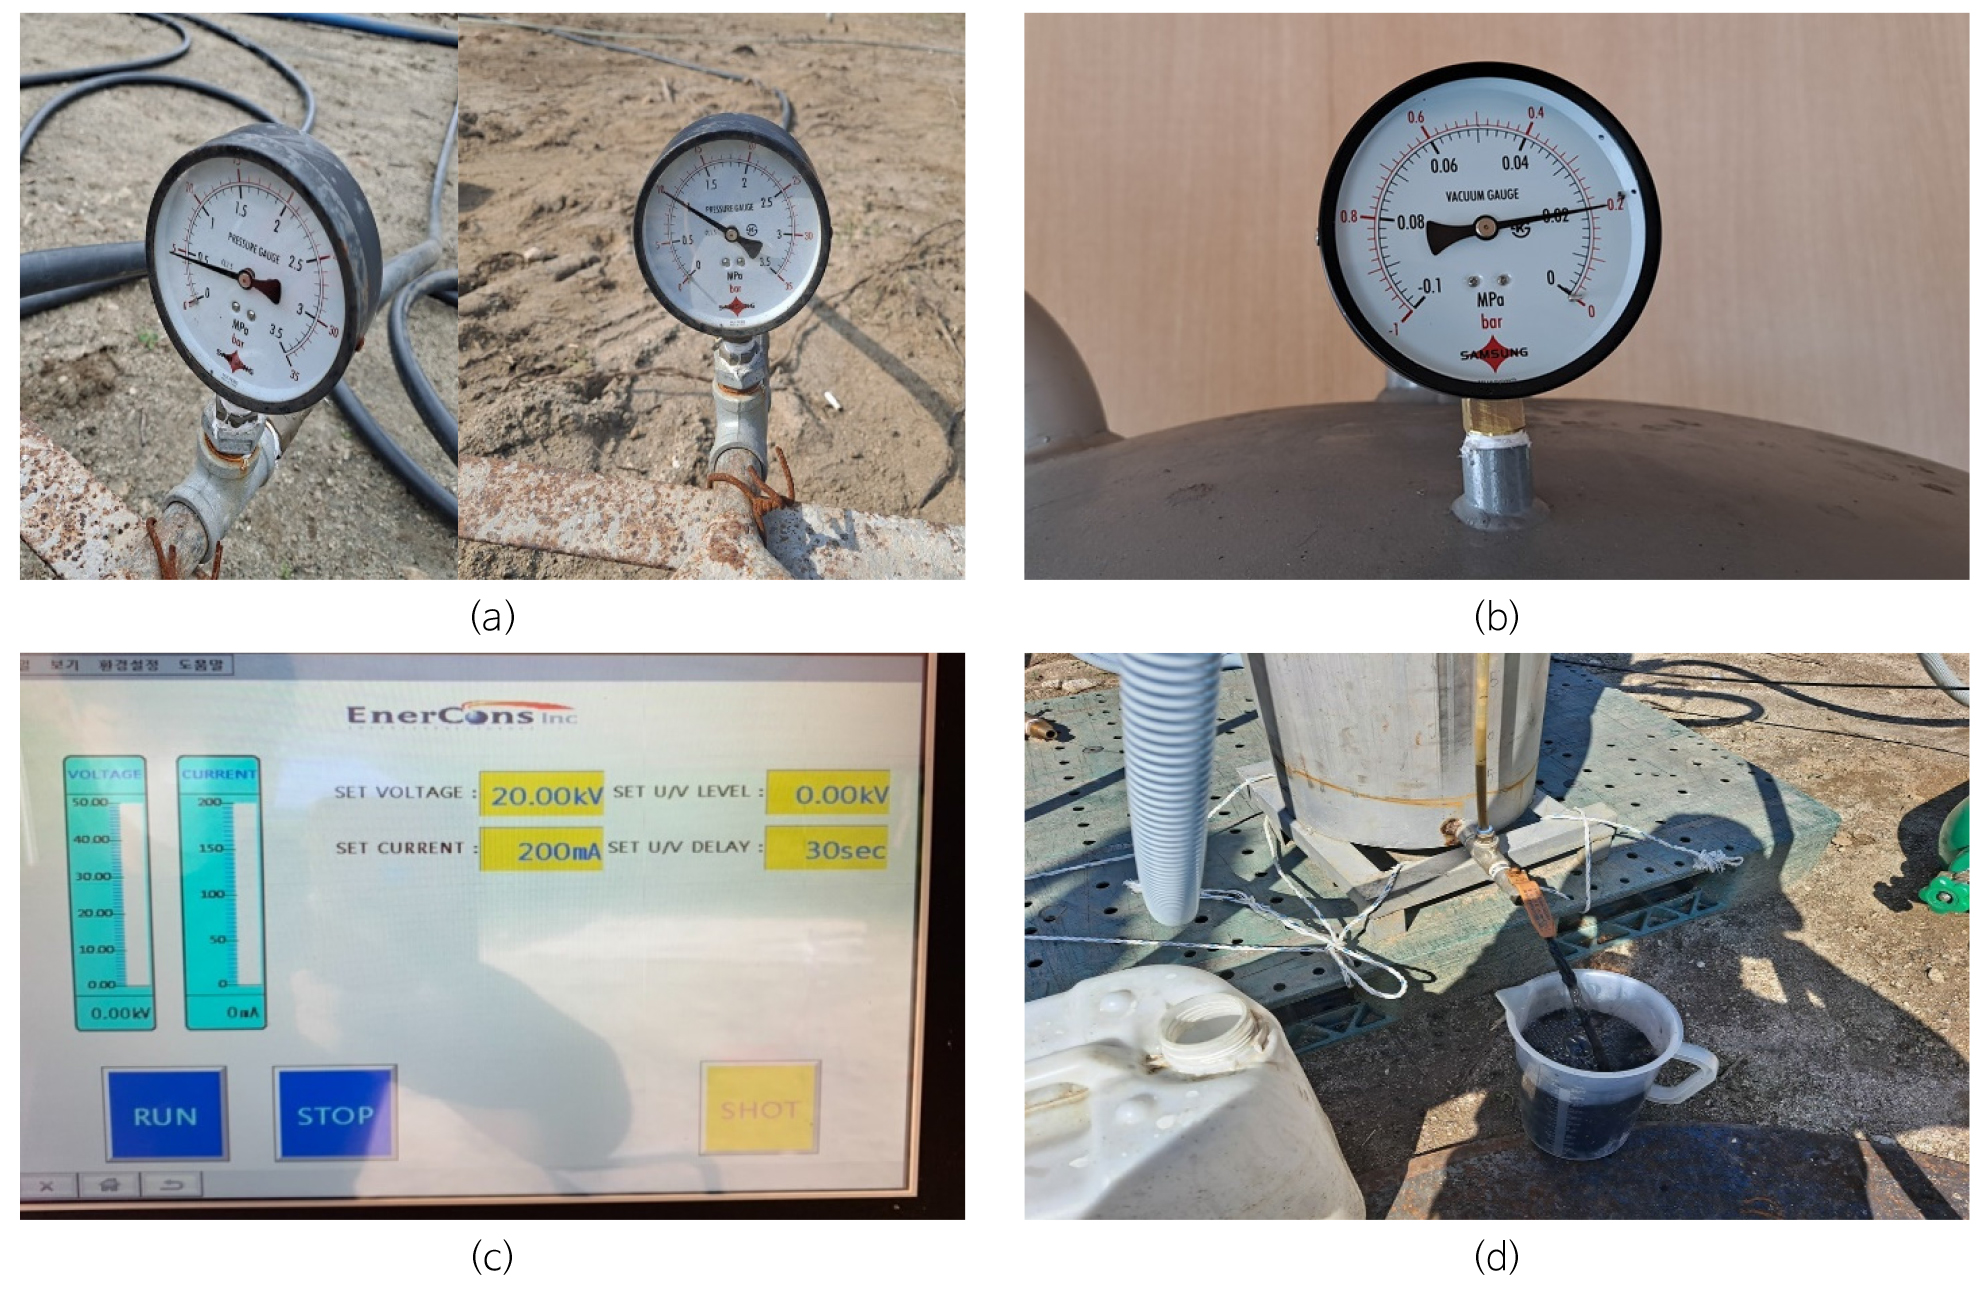
Table 3.
PPV and control test conditions
Slug Tests
Slug tests assessed the permeability coefficient of the study area and compared the changes in permeability coefficient between the experimental and control procedures. The experiment involves injecting water into the well at a rapid rate and then raising the water level. The groundwater level returned to its original state as it discharged to the surrounding aquifer. Slug testing can obtain hydrological parameters by measuring changes of groundwater levels (Han, 1998).
The water level change was induced by instantaneous injection of water into the injection well, and the degree of restoration of the water pressure to the original state was measured with a groundwater datalogger (diver). Data analysis was performed using AQTESOLV software, and the solution was applied by Bouwer and Rice (1976) method. Slug tests performed in boreholes BH-1 and BH-3 checked the permeability coefficient for the original underground condition. Other slug tests were performed in the injection wells (Fig. 7) to evaluate the permeability coefficients for the experimental and control situations.

Results and Discussion
Electrical Resistivity Survey Results and Interpretation
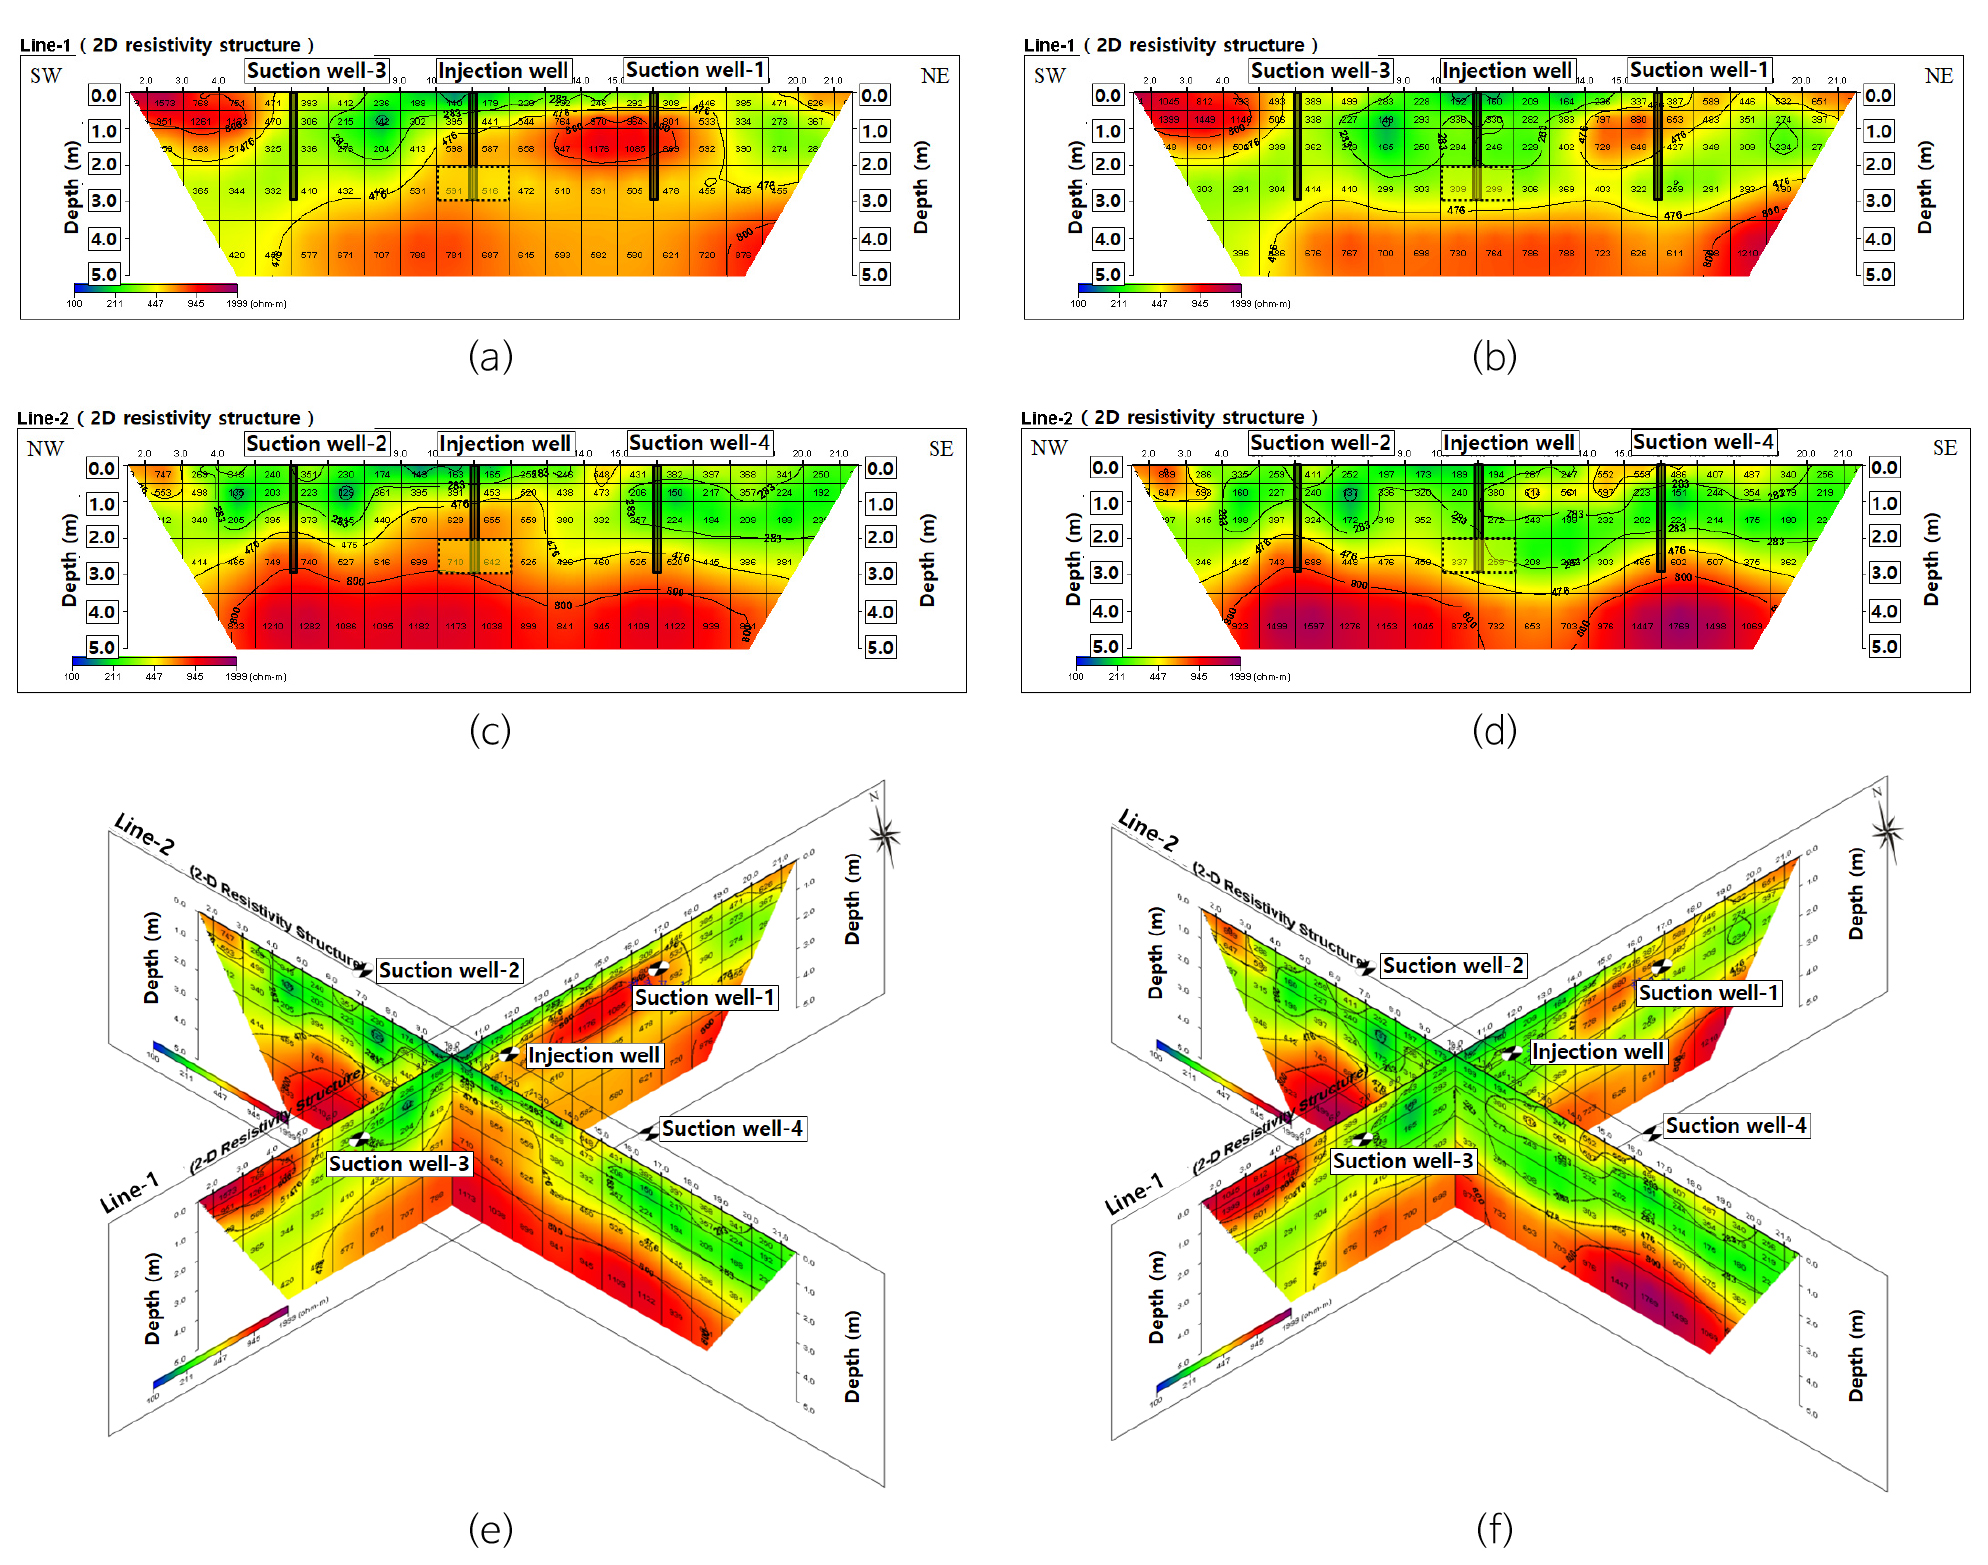
The electrical resistivity and drilling survey results for the test site found that resistivity of less than 200 ohm-m indicates the soil layer, resistivity between 200 and 800 ohm-m indicates the weathered zone, and resistivity above 800 ohm-m indicates bedrock (Fig. 8). Comparing the resistivity measured in control B and PPV-II confirms that the resistivity of the weathered zone was generally lowered by PPV-II and that low-resistivity anomalies were distributed widely (Fig. 8a, 8b, 8c, 8d).
Confirming the resistivity structure allowed changes in the resistivity between the injection well and suction wells 1 and 4 to be clearly identified. The changes in resistivity indicate smooth diffusion of the injection fluid toward the two suction wells owing to the inhomogeneity of the ground. Overall, in the bedrock distribution at 3.0 m below the surface showed no clear change in resistivity after the control B and PPV-II procedures, but there was a large change in the weathered zone (the main test section), because the diffusion of the injected fluid in PPV-II was generally good. Fence diagrams further compare the electrical resistivity results and display the changes in resistivity for control B and PPV-II (Fig. 8e, 8f).
Changes in resistivity were analyzed quantitatively using the ratio of the changes in resistivity due to PPV-II and control B (Fig. 9). Electrical resistivity indicates the degree to which current flows for a given voltage. The smaller the resistivity value, the better the current flows. Therefore, in this experiment, the degree of diffusion of the fluid was determined by comparing the electrical resistivity values. The specific resistance reduced by a maximum of about 2.5 times in the sections between the injection well and suction well-1 and between the injection well and suction well-4. The main reduction was around 1~3 m below the ground surface. The specific resistance in the sections between the injection well and suction well-2 and between the injection well and suction well-3 also showed notable changes of about 1.5~2.0 times.
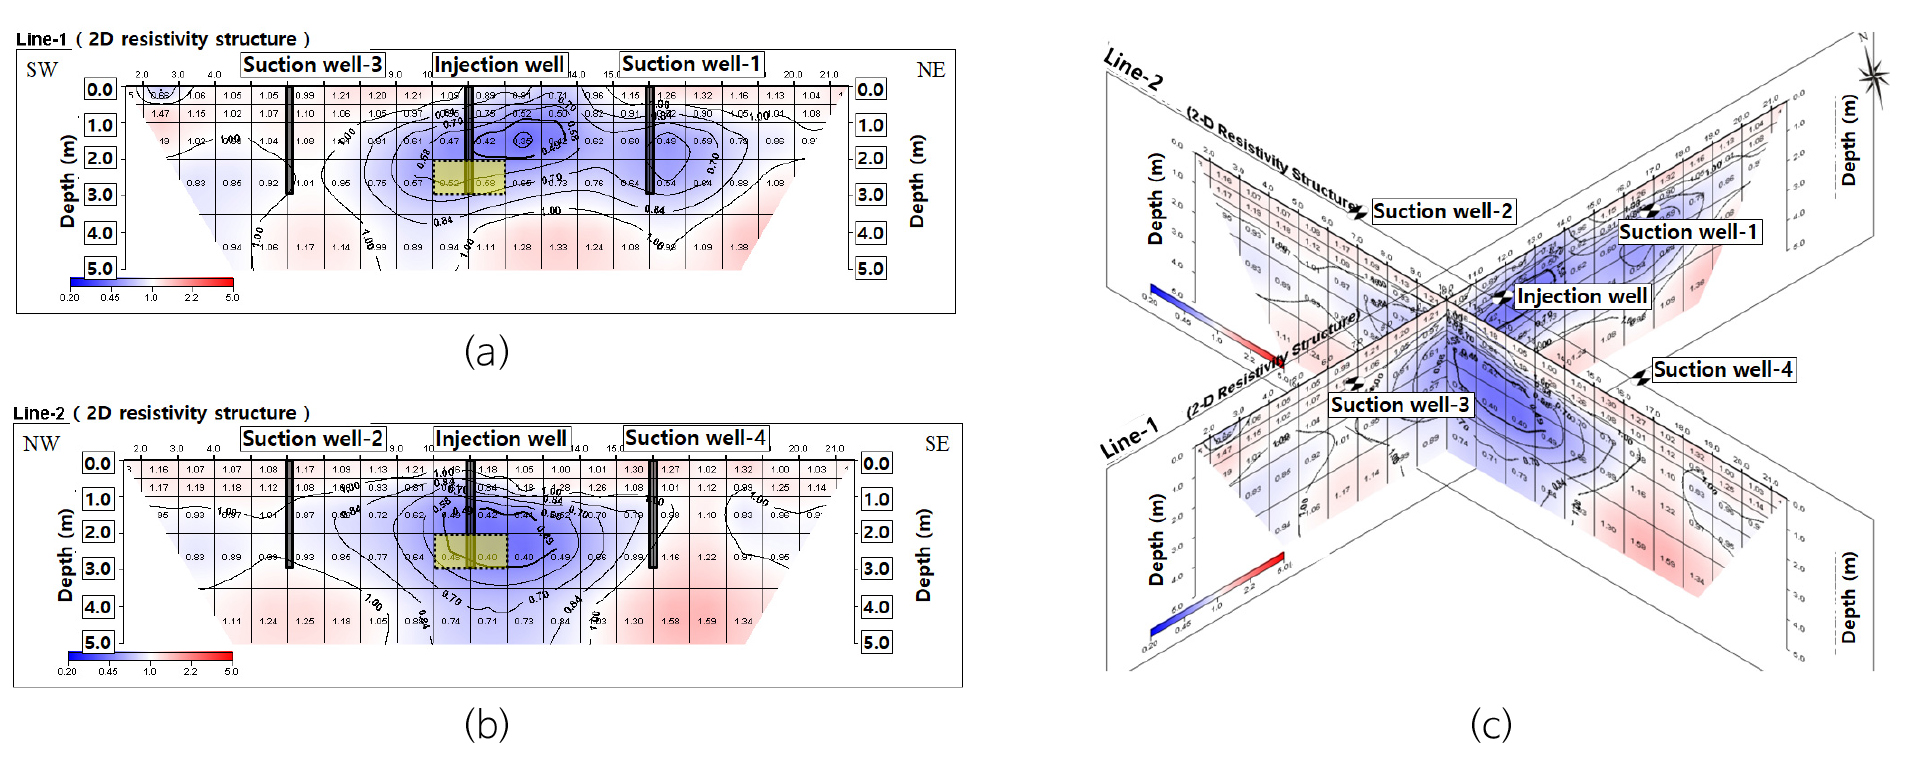
The specific resistance changed clearly in the sections between the injection well and the suction wells, indicating increased diffusion of fluid owing to the PPV method. This is attributable to suction accelerating fluid flow between the injection well and the suction well as well as in the surrounding ground. Overall, these results qualitatively confirm that the PPV method significantly increased the efficiency of fluid transfer in subsurface soil compared with the control method.
Injection and Suction Test Results and Analysis
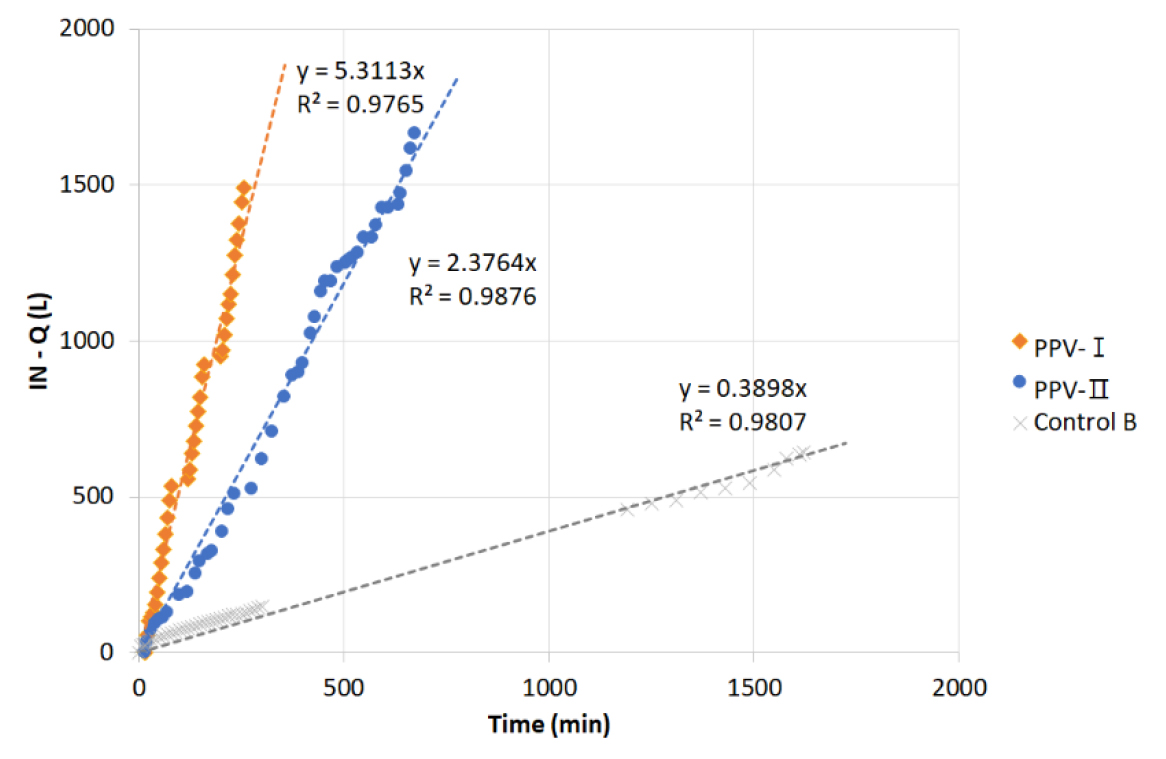
The time required for fluid injection and suction depends on changes in transfer characteristics such as the degree of fracture formation in the ground and permeability. Consider the injection flow rate and injection time: control B took 1,622 min (about 27 h) to inject 642 L of fluid. The test was performed on the basis that the experimental procedure achieved more than twice the injection flow rate of the control group: PPV-I injected about 1,490 L in 255 min, and PPV-II injected about 1,665 L in 675 min, before the experiment was terminated. Table 4 lists the test results for the injection flow rate, injection speed, and suction flow rate with respect to injection time.
Table 4.
Injected amount (IN-Q), flow rate, injection speed (IN-S) and suction flow rate (EX-Q) with respect to injection time for control B, PPV-I, and PPV-II
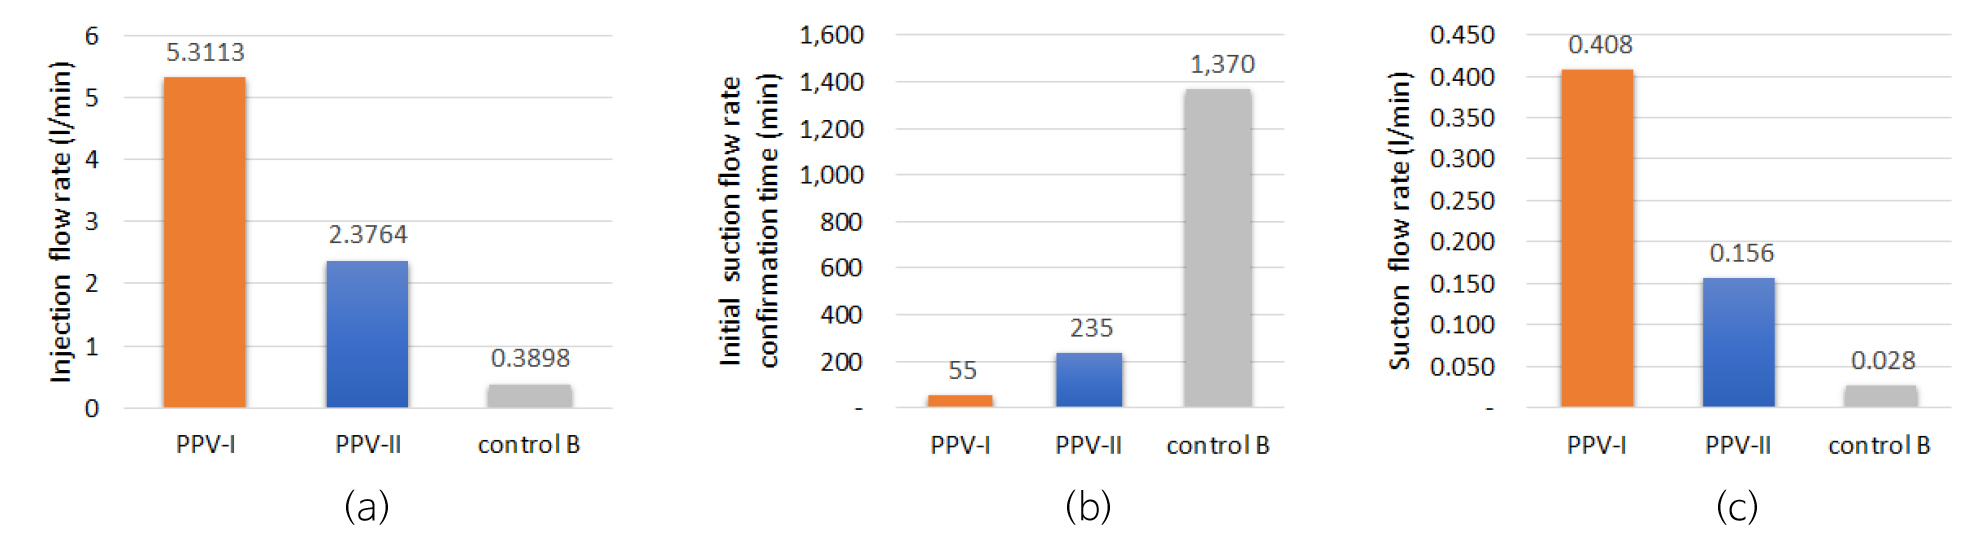
Plotting the injection flow amounts for the control and experimental methods with respect to time showed coefficients of determination of between 0.9765 and 0.9876, indicating strong positive correlations (Fig. 10). The slope of the fitting line represents the injection flow rate. The experimental procedures (PPV-I and PPV-II) had injection flow rates 6.096~13.626 times greater than control B (Figs. 10 and 11a).
Initial suction flow rate confirmation time was defined as the time taken for the injected fluid to first reach the suction well. It was 1,370 min from the start of the experiment for control B, 55 min for PPV-I, and 235 min for PPV-II. Compared with that for control B, the suction times for PPV-I and PPV-II were respectively 2,490.9% and 583.0% quicker (Fig. 11b).
The suction flow amount is the volume of injected fluid that flowed into the suction well and was sucked out. This was about 6.7 L for control B (taking 240 min), about 75.4 L for PPV-I (taking 185 min), and about 65.5 L for PPV-II (taking 420 min). The corresponding suction flow rates were about 0.028, 0.408, and 0.156 L/min, respectively, indicating that PPV-I and PPV-II had rates 1,459.9% and 558.6%, respectively, greater than control B (Fig. 11c).
Overall, the PPV method showed significantly improved fluid transfer compared with the control group. Comparing the injection flow rate, suction time, and suction flow rates for control B and PPV-II at the same location considering the heterogeneity of the ground shows that PPV increased fluid transfer efficiency by 558.6% to 609.6%. As various factors are considered here, a single efficiency improvement value cannot be formally calculated using a simple average. However, as the improvements over the control method are similar, their average (584%) seems representative. In other words, PPV improves the injection and suction of remediation agent by about 5.8 relative to conventional chemical oxidation (Table 5).
Table 5.
Comparison of fluid transmission in PPV-II and control B
Slug Test Results and Analysis
As the permeability coefficient varies greatly with the test location, care must be taken in selecting the control group. To minimize this fluctuation here, slug tests were performed in adjacent boreholes (including control A) to evaluate the permeability coefficients of the ground both originally and after control and PPV procedures. Fig. 12 gives the results.
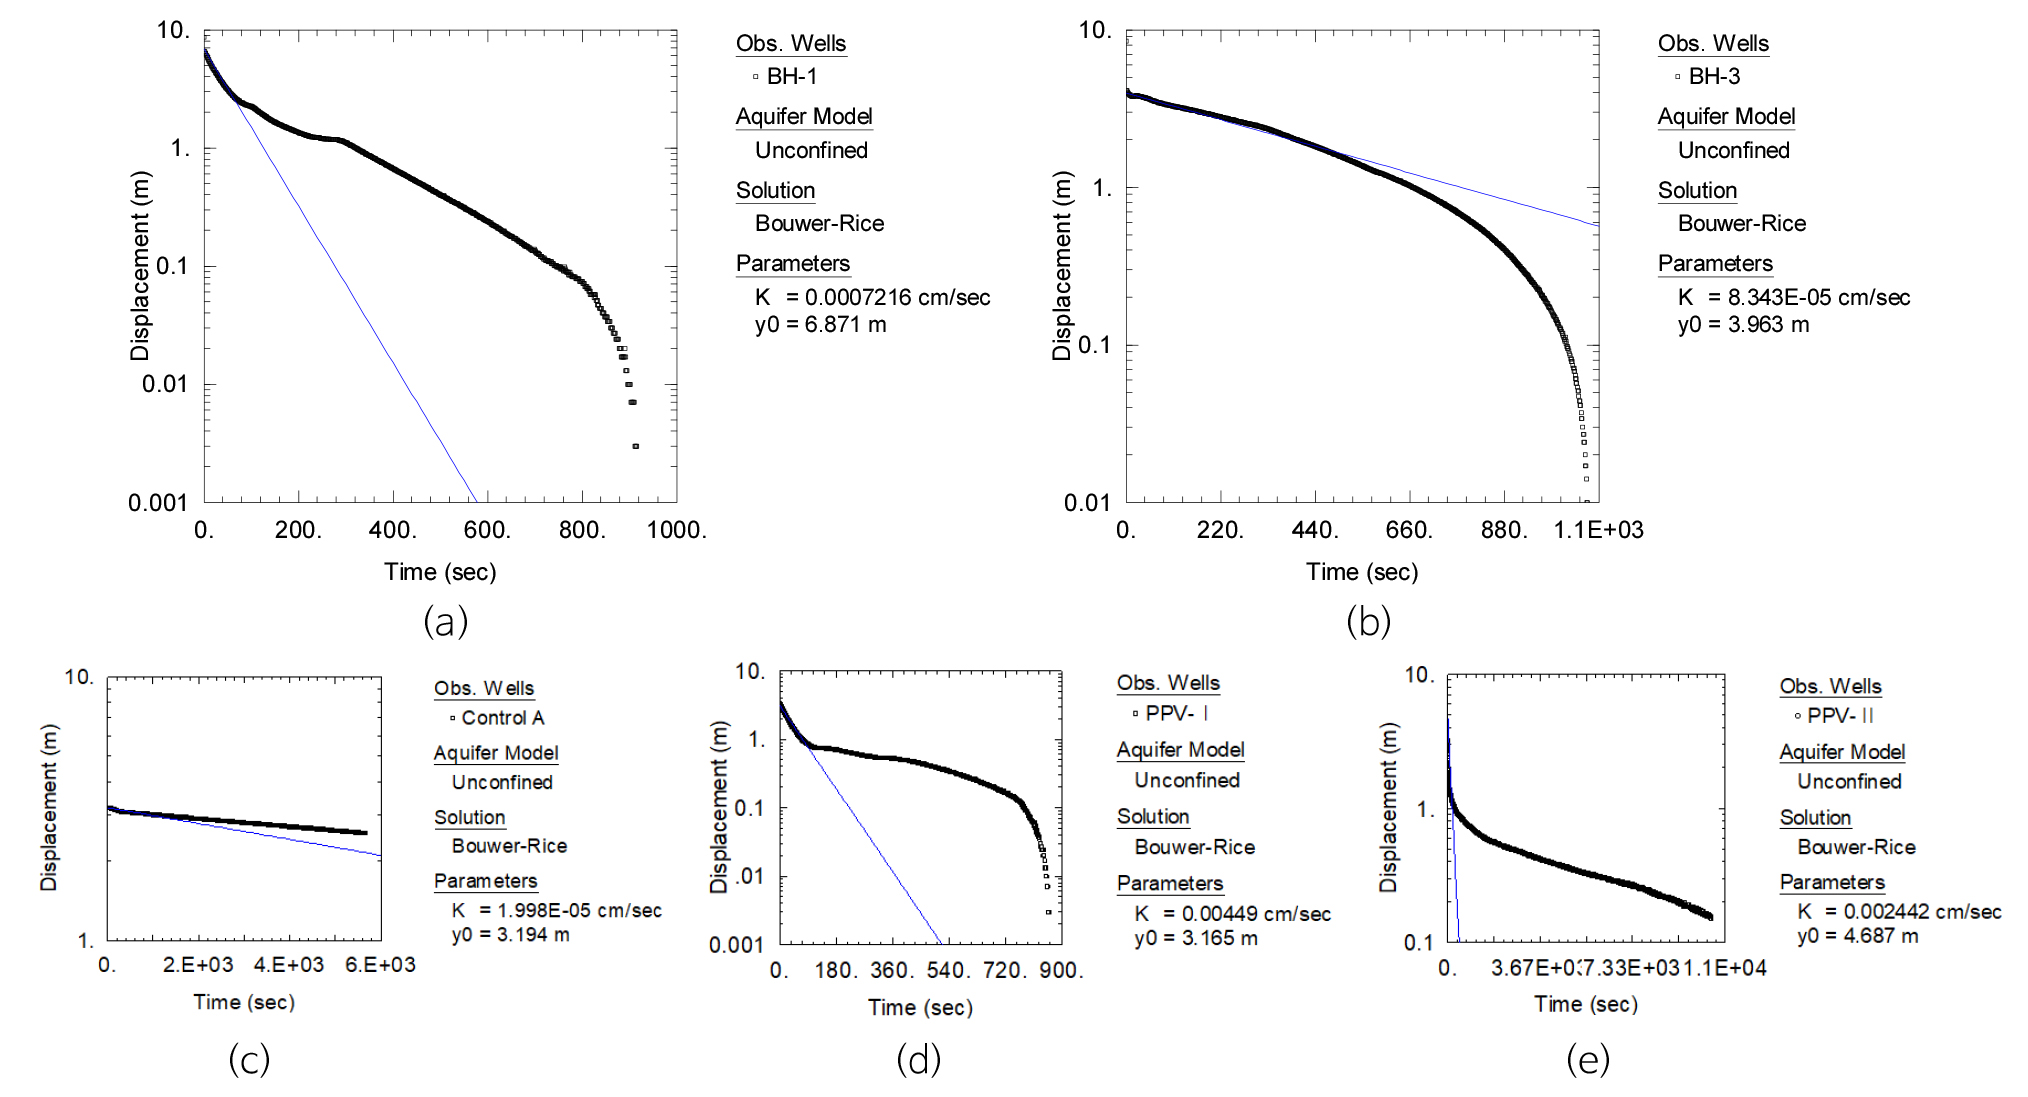
Values for hydraulic conductivity calculated from the test results for control groups such as control A including survey boreholes BH-1 and BH-3, ranged from 2.0 × 10⁻⁵ to 7.22 × 10⁻⁴ cm/s, with an average of 2.75 × 10⁻⁴ cm/s. The hydraulic conductivity of the experimental group was 2.44 × 10⁻³ to 4.49 × 10⁻³ cm/s, with an average of 3.46 × 10⁻⁴ cm/s. Applying PPV improved hydraulic conductivity by about 12.6 times compared with the control group (Table 6). This improvement of hydraulic conductivity, assuming a hydraulic gradient of 1:1, cannot be perfectly connected with the observed improvement of underground fluid diffusion. However, it was quantitatively confirmed that there was a significant improvement in water permeability due to the application of PPV.
Table 6.
Slug test results and evaluation
Conclusions
This study explored fluid transfer during combined application of pneumatic blasting, plasma blasting, and vacuum suction (PPV), and verified its effects.
Electrical resistivity surveying identified bedrock 3.0 m below the surface; its resistivity results did not clearly differ between control B and PPV-II. In contrast, results for the weathered zone, the main test section, differed substantially owing to thorough diffusion of the injected fluid in PPV-II.
Quantitative evaluation of the changes in resistivity considered the ratio of the change owing to PPV-II to that owing to control B. In the section between the injection and suction wells, the decrease in resistivity due to PPV was about 1.5~2.5 times greater than that due to the control, with the main reduction at about 1~3 m below the surface. These results qualitatively confirmed that PPV significantly more greatly increases fluid transfer efficiency in the subsurface soil section than the existing method.
Considering the heterogeneity of the ground, the injection flow rate, suction time, and suction flow rate were compared at the same location for control B and PPV-II. The PPV method increased fluid transfer efficiency more than the control method; it achieved about 5.8 times greater injection and suction effects than the control method.
Hydraulic conductivity assessed through slug tests was on average 2.75 × 10⁻⁴ cm/s for the control and 3.46 × 10⁻³ cm/s for the experimental method. Therefore, applying PPV appears to achieve a 12.6 times greater conductivity than the control.
Overall, this study confirmed qualitatively and quantitatively that the PPV method can significantly improve injection and suction efficiency by promoting cracking in the ground and improving water permeability compared with the established method of chemical oxidation.
Although improving underground fluid diffusion is a major factor in improving remediation efficiency, the fluid transfer rate and remediation efficiency are not rigidly linked. Therefore, it is necessary to assess remediation efficiency by comparing the existing method and the PPV method in a future study of actual decontamination.
