

Introduction
Research Methods
Assumptions and Equilibrium Equations
Experimental Observations and Laboratory Data
Results
Effect of Pressurization Rate on Crack Radius
Effect of Injection Rate on Crack Radius
Conclusions
Introduction
Hydraulic fracturing is a technique used to stimulate the production of hydrocarbon resources, as well as the creation of new fracture pathways to enhance geothermal heat mining (Tester et al., 2006; Montgomery and Smith, 2010). A section of a borehole is isolated and then the fluid is injected until the internal pressure overcomes the strength of the rock, and fractures are induced. However, the fractures are oriented depending on the direction of the in-situ stresses. Hubbert and Willis (1957) were the first to attempt to explain the mechanics behind hydraulic fracturing, and their experimental work showed how the fractures are oriented perpendicular to the least horizontal stress. Moreover, they proposed an elastic solution to relate the breakdown pressure with the tensile strength of the rock and the horizontal stresses. Due to this relationship with horizontal stresses, hydraulic fracturing has also been used as a tool to estimate horizontal stresses (Fairhurst, 1964). However, determining the tensile strength of the rock at the point of injection has been problematic. To avoid this issue Bredehoeft et al. (1976) suggested carrying out subsequent injection cycles so that the tensile strength of the rock becomes zero in the subsequent cycles, and then the horizontal stresses can be estimated. However, a drawback of the elastic model is that it does not consider the effect of fluid infiltration. Although this assumption might be correct under specific conditions, it is not true for other cases when the injection fluid is of low viscosity. Haimson and Fairhurst (1967) introduced a new relation that incorporates Biot’s theory of poroelasticity to account for the effect of fluid infiltration on the stresses around the borehole. Biot’s poroelastic parameter is a material property, and therefore it has to be determined for each rock. One of the main assumptions in the elastic and poroelastic models is that the rock acts as a continuous medium. However, natural fractures are often encountered in rock and they violate the assumption of a continuous medium. Later, Rummel and Winter (1983) developed a solution based on fracture mechanics that included a system of bi-wing fractures emanating from the borehole. The fractures are also subjected to fluid pressure, and fracture extension occurs when the stress intensity factor at the fracture tip equals the critical value of the fracture toughness. Dégué and Ladanyi (2000) also presented a relation for breakdown prediction based on fracture mechanics but tailored for cylindrical geometries. This relation assumes the existence of multiple radial cracks originating from the borehole towards the outer diameter. Moreover, because the cracks are assumed to have the same radius or length, the problem can be divided into two, cracked and uncracked zones. Solutions for the equilibrium equations between these zones can be obtained using Quasi-static and Linear Elastic Fracture Mechanics (LEFM) methods. An advantage of these approaches is that they consider the geometry of a hollow cylinder, which is useful when estimating breakdown pressures for laboratory tests that use cylindrical samples. However, the determination of the crack radius or length can represent a difficulty in the application of this method.
This work explores the applicability of the equations proposed by Dégué and Ladanyi (2000) for the estimation of breakdown pressure for cylindrical samples tested under triaxial conditions. The equations were evaluated using two groups of hydraulic fracturing tests injected under constant pressurization rate and constant injection rate. Later, the obtained relations were used to predict breakdown pressures for different tests. Details of the mathematical assumptions and the testing conditions are as follows, as well as the results and main findings.
Research Methods
Assumptions and Equilibrium Equations
Dégué and Ladanyi (2000) dealt with the problem of a hollow cylinder with internal (ri) and external radius (r0) subjected to an internal (pi) and external pressure (p0) (Fig. 1). For this, they assumed the existence of a set of densely and equidistantly spaced radial cracks that start from the inner hole and have all the same length. The injection fluid can access the cylindrical sample only through the radial cracks, applying a normal pressure on the crack walls. This pressure can be a portion of the internal pressure, and it is controlled by a factor, 0 ≤ f ≤ 1. The case of f = 0 corresponds to one where there is no fluid infiltrating into the cracks, and therefore the fluid pressure acts only on the internal hole wall. On the other hand, the case when the injection fluid is acting on the cracks is denoted by f = 1, and represents hydraulic fracturing. Dégué and Ladanyi (2000) provided relationships for the cracked and uncracked radial zones. However, the complete solution for the equilibrium equations where r = re was addressed using two different methods; the Quasi-static and the Linear Elastic Fracture Mechanics (LEFM) approaches.
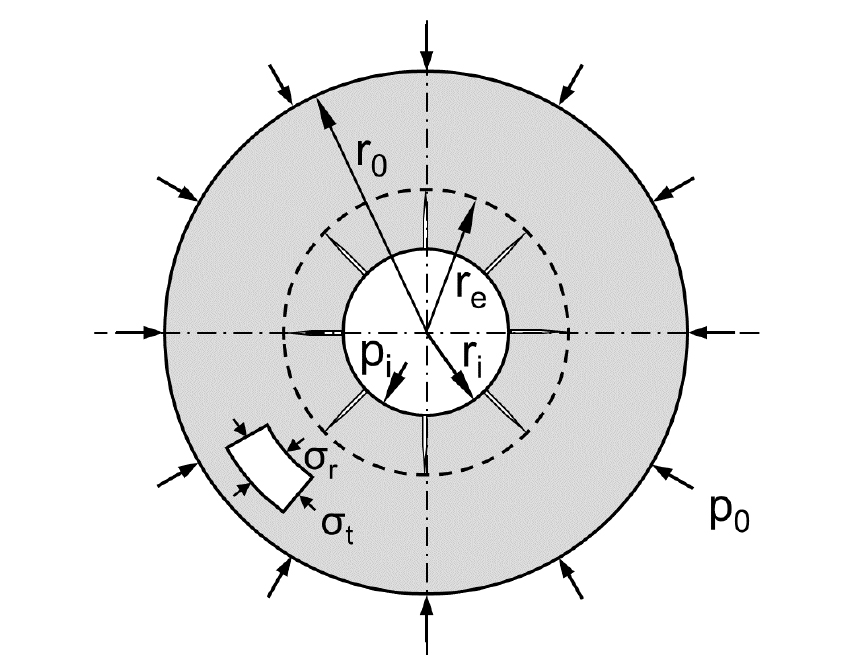
Fig. 1.
Cross section of a cylindrical sample indicating notations used in the equations (modified after Dégué and Ladanyi, 2000).
The solution for the internal pressure using the Quasi-static approach is given in Eq. (1) (Dégué and Ladanyi, 2000).
where, pi and p0 are the internal and external pressures respectively, T0 is the tensile strength, ri and r0 are the internal and external cylinder radii, re is the crack radius, and f is the degree on which the pressure acts on the cracks. Note that the tensile strength has a negative sign. Then, since f = 1 represents hydraulic fracturing, the solution for the ultimate internal pressure or breakdown pressure can be written as follows (Eq. (2)).
Similarly, Dégué and Ladanyi (2000) also gave a solution for the equilibrium equations between the cracked and uncracked zones using a LEFM approach, which is presented in Eq. (3).
The last two equations can be used to predict the breakdown pressure when the crack radius is known. However, the crack radius can also be calculated from the above equations. Using the Quasi-static solution in Eq. (2), the crack radius re can be obtained straightforwardly. However, solving re from the LEFM relation (Eq. (3)) yields a complex solution. Therefore, only the equation from the Quasi-static approach was used to obtain re, and the obtained relation is shown in Eq. (4). Once more, note that T0 is negative.
From Eq. (4), only the positive result has a physical meaning, and hence this solution alone was adopted in the calculations presented here. Moreover, Eq. (4) reveals how the crack radius is not a material property, and it changes with testing conditions. Despite the tensile strength being a material property, the ultimate internal pressure (pi) or breakdown pressure depends on the pressurization rate and the injection rate (Zoback et al., 1977; Zhuang et al., 2019). Therefore, the degree of fluid infiltration represented here by the crack radius, becomes dependent on the injection scheme.
Experimental Observations and Laboratory Data
The effect of the injection fluid infiltration on the breakdown pressure has been recognized earlier. Haimson and Fairhurst (1967) introduced an equation that considers the fluid infiltration through Biot’s poroelastic parameter. However, Biot’s coefficient is considered a material property, with different values even for different types of the same rock. Furthermore, Rummel and Winter (1983) also considered the effect of water infiltration and preexisting fractures by presenting a relationship based on LEFM, where a bi-wing symmetrical fracture originating from the borehole. On the other hand, fluid infiltration resulting from injection under either injection rate control or pressurization rate control has been noted. Kim et al. (2020a) reported observations of injection fluid infiltration for hydraulic fracturing tests using water (1 cP) and oil (152 cP). The observation of the infiltrated areas was aided by the addition of a fluorescent material to the injection fluids. After breakdown, the cylindrical samples were cut transversely to expose the infiltrated areas for water and oil injection under pressurization rates of 0.01 and 0.1 MPa/s. Fig. 2 shows these cross sections with estimations of the radii for the infiltrated areas delimited with dashed red circles. For water, the infiltrated area covered the entire cross section after breakdown for both pressurization rates. However, under oil injection, the infiltrated area decreased with increasing pressurization rate, with estimated radii of 9.8 and 6.2 mm for pressurization rates of 0.01 and 0.1 MPa/s, respectively. These radii for oil injection were estimated based on the circular cross section where the fluid fully infiltrated. The infiltration was not uniform, and it followed the direction of fracture extension, promoted by a denser microcrack population along that direction.
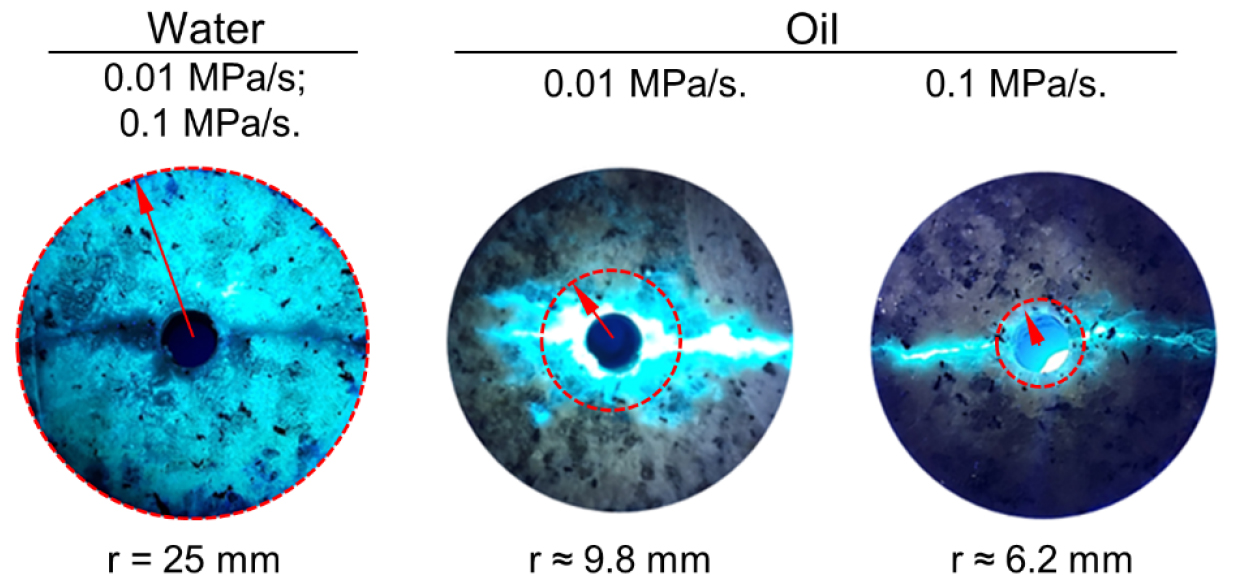
Fig. 2.
Fluid infiltration area for water and oil under different pressurization rates. Fluorescent material was added to aid the visualization of the infiltration area that appears in light blue. The estimated infiltrated area is delimited with dashed red circles (modified after Kim et al., 2020a).
In order to explore the applicability of the solutions presented by Dégué and Ladanyi (2000), we considered the experimental cases presented by Diaz et al. (2016); Kim et al. (2020a); and Zhuang et al. (2020). Kim et al. (2020a) carried out hydraulic fracturing tests using cylindrical samples of Pocheon granite under different confining pressures and pressurization rates. This granite comes from the Pocheon region in South Korea, which has been said to be composed of 35.9% of plagioclase, 35.7% of quartz, 25.8% of microcline, and 2.6% of biotite based on X-ray diffraction measurements (Diaz et al., 2016). Moreover, Pocheon granite has an average Young’s modulus and Poisson’s ratio of 57.03 MPa and 0.27, respectively. The mean uniaxial compressive strength is 202. MPa, while the mean Brazilian tensile strength is 7.7 MPa (Kim et al., 2020b). The samples had 50 and 100 mm in diameter and height. Cases performed under confining pressures of 5, 10, 15, and 20 MPa, and pressurization rates of 0.01, 0.1, 1 and 5 MPa/s were selected and they are summarized in Table 1.
Table 1.
Hydraulic fracturing tests under different confining pressures and pressurization rates (modified after Kim et al., 2020a)
In addition, Zhuang et al. (2019) performed hydrofracturing tests using also cylindrical samples of Pocheon granite, and presented relationships between the breakdown pressure and the injection rate. Then, one of these data sets was selected and used to relate the crack radius re and the injection rate. Finally, this relationship was tested using a different set of experiments carried out under the same testing conditions presented by Diaz et al. (2016), where cylindrical samples of Pocheon granite were hydrofractured under 0 and 25.6 MPa of confining and vertical pressure, and 25 and 50 mm3/s of constant injection rate.
Results
Effect of Pressurization Rate on Crack Radius
The calculation results for the crack radius re using Kim et al. (2020a) tests are presented in Fig. 3. These results include four different sets of tests carried out under different confining pressures (σc) of 5, 10, 15, and 20 MPa, and under different pressurization rates of 0.01, 0.1, 1 and 5 MPa/s. The reported indirect tensile strength of 6.1 MPa for the rift plane of weakness of Pocheon granite was used as the tensile strength T0 in these calculations. Moreover, these results are contrasted with the calculations from Dégué and Ladanyi (2000), that are based on the experimental work presented by Zoback et al. (1977). Overall, both results present a decreasing trend on re with increasing pressurization rate. However, the re values for Kim et al. (2020a) tests are considerably larger than those presented by Dégué and Ladanyi (2000). The reason is that these tests utilized different sizes of cylindrical samples. Zoback et al. (1977) used cylindrical samples of Ruhr sandstone with 3 and 6 cm in diameter and height. On the other hand, Kim et al. (2020a) used cylindrical samples of Pocheon granite with a diameter and height of 5 and 10 cm. This explains the difference in the resultant re values. However, for each group of tests, the values of re remained within the ranges of the cylinder’s thickness (internal and external radii). Moreover, the confining pressure plays an important role on the crack radius. For example, for a pressurization rate of 0.1 MPa/s, the values of re increase with increasing confining pressure. Finally, at lower pressurization rates of 0.01 and 0.1 MPa/s, the calculated re values returned similar values in both sets of tests with Ruhr sandstone and Pocheon granite.
The relations for each confining pressure presented in Fig. 3 can be employed to obtain re values for a given pressurization rate, and later used to compute the breakdown pressure. To test this, we selected two different tests carried out by Diaz et al. (2016) under a constant pressurization rate of 0.1 MPa/s. The tests were carried out under a confining pressure of 5 MPa, and a vertical pressure of 25.6 MPa, and both tests resulted in a breakdown pressure of 14.1 MPa (Diaz et al., 2016). Employing the relation for a confining pressure of 5 MPa shown in Fig. 3, a pressurization rate of 0.1 MPa/s returns an re value of 12.82 mm. Then, using Eq. (2), we obtained a breakdown pressure of 11.48 MPa, a value lower than the reported pressure of 14.1 MPa. This difference can be attributed to the testing conditions. Although both sets were carried out under a confining pressure of 5 MPa, the vertical pressure was 15 MPa for the relations drawn in Fig. 3 (Kim et al., 2020a), and 25.6 MPa for the two cases used to test the relation (Diaz et al. (2016). Moreover, the tensile strength could also have affected these calculations, as it plays an important role on the breakdown pressure.
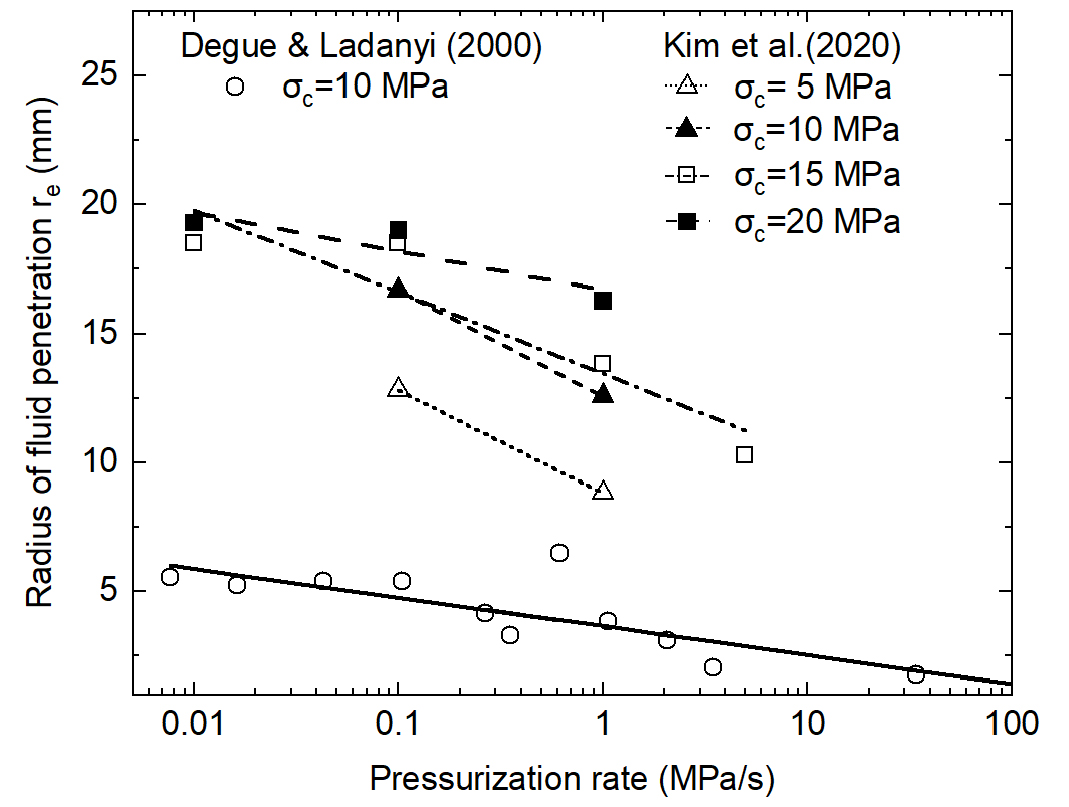
Fig. 3.
Radius of fluid penetration versus pressurization rate for calculations based on Kim et al. (2020a) and Dégué and Ladanyi (2000). The samples were tested under different confining pressures (σc).
Fig. 4 shows the relation between the ultimate internal pressure or breakdown pressure and the fluid penetration or crack radius for different tensile strengths. The relations shown here are adjusted to the samples’ geometry and testing conditions, with an internal and external radius of 4 and 25 mm, and a confining pressure of 5 MPa. All curves converge at 5 MPa of breakdown pressure because this is the confining pressure used in these tests. The dashed horizontal line represents a breakdown pressure of 14.1 MPa, as the one reported by Diaz et al. (2016) for the tests carried out under a pressurization rate of 0.1 MPa/s. Then, these relationships evidence how a greater tensile strength implies a larger crack length, re. In other words, since the re value of 12.82 mm, resulted in a low prediction of the breakdown pressure of 11.48 MPa, it is plausible that the actual tensile strength of the rock was greater.
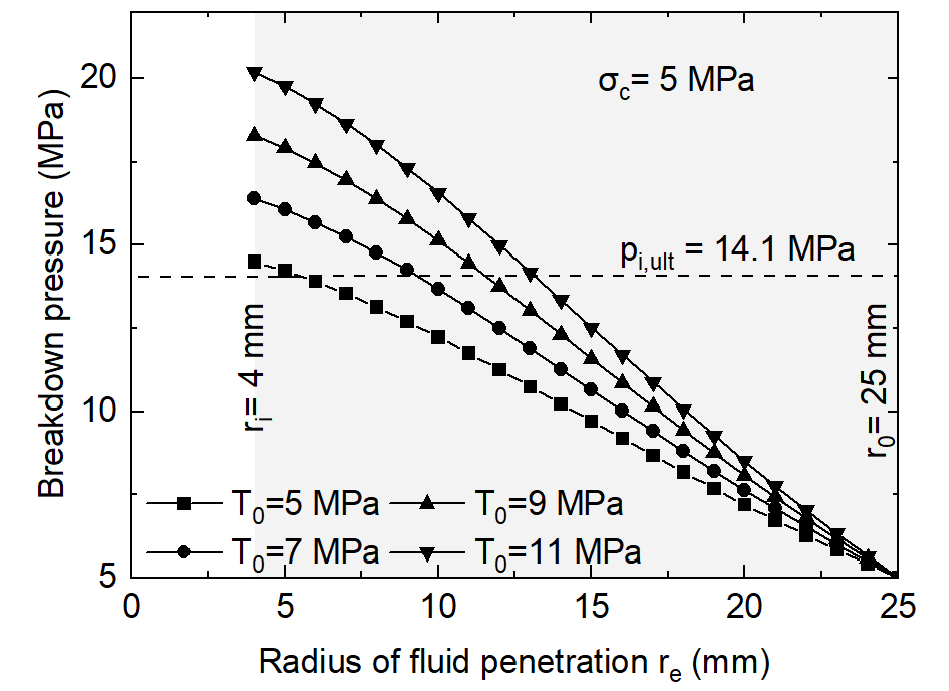
Fig. 4.
Breakdown pressure versus crack length or radius of fluid penetration for different tensile strengths estimated using Eq. (2). The curves are tailored to the samples geometry of internal and external radius of 4 and 25 mm, respectively.
Effect of Injection Rate on Crack Radius
Due to this difference in the testing conditions of the two sets of tests carried out under pressurization rate control, we selected an alternative group of tests carried out under the exact same conditions. However, these tests were injected under constant injection rate. Zhuang et al. (2019) showed relationships between breakdown pressure and injection rate for hydraulic fracturing and sleeve fracturing tests. We selected the set carried out using R specimens to draw a relation with the radius of fluid penetration. R specimens are Pocheon cylindrical granite samples cored perpendicular to the rift plane of weakness. Therefore, fractures developed along the grain plane. The relation between breakdown pressure and injection rate for the selected cases is shown in Fig. 5a. Then, these breakdown pressures along with an indirect tensile strength of 8.8 MPa were used to estimate the re values shown in Fig. 5b. Similar to the previous results for pressurization rate, the radius of fluid penetration decreased with increasing injection rate. Again, it is important to note that this relation between re and the injection rate was tailored for this set of samples specifically.
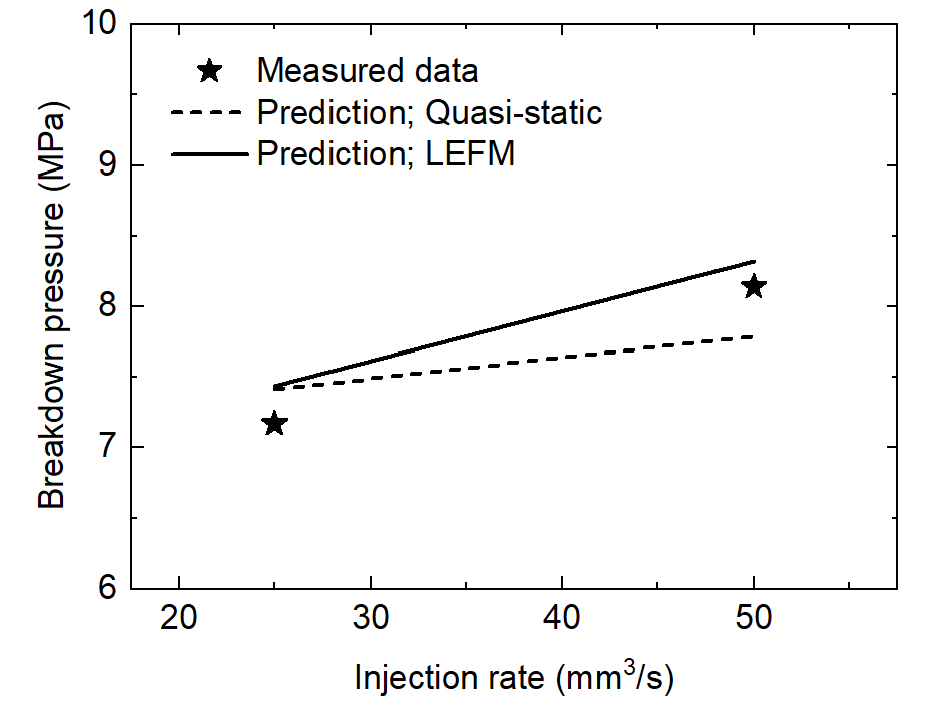
Then, two different cases tested also under constant injection rate were selected to verify the relationship presented in Fig. 5b. Diaz et al. (2016) among other tests, presented two cases injected under 25 and 50 mm3/s using R samples, which yielded breakdown pressures of 7.17 and 8.14 MPa. Using the relation in Fig. 5b, we obtained re values of 7.31 and 6.16 mm. These values were used to predict the ultimate internal pressure or breakdown pressure using Eqs. (2) and (3). The results are shown in Fig. 6, and both are in good agreement with the measured data. However, the LEFM approach returned better predictions with an average error of 3.02% compared to the 3.84% from the Quasi-static solution.
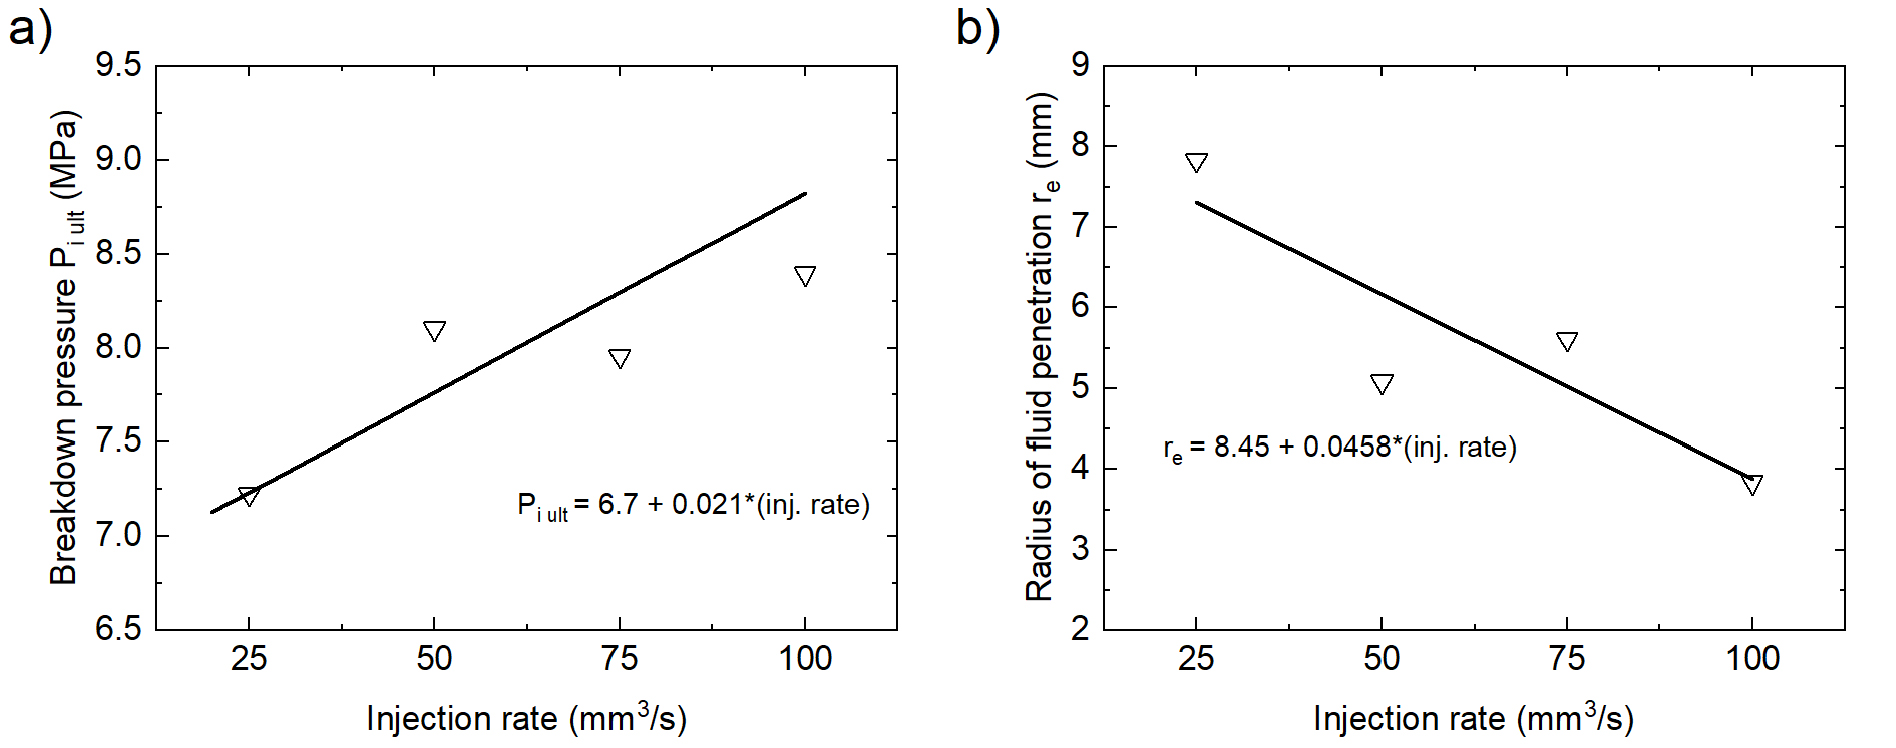
Fig. 5.
a) Breakdown pressure against injection rate for cylindrical samples of Pocheon granite (modified after Zhuang et al., 2019). b) Crack length or radius of fluid penetration versus injection rate.
The analysis presented here has shown the applicability of the Quasi-static and LEFM approaches to predict breakdown pressure tailored for hollow cylinders. These approaches consider the effect of the fluid infiltration through the radius of the assumed existing cracks. However, as stated before, the crack radius is not a material property because it changes depending on the testing conditions (Eq. (4)). Here, the difficulty in estimating the radius of fluid infiltration was worked out by solving re from Eq. (2), and they used it to back calculate this parameter from a given set of experiments. Later, the obtained relation was employed to predict cases from a different set. The estimated errors showed that this approach yielded good results; especially when using the LEFM solution. However, although the predictions are good, the number of cases used to obtain the relationship was few. Therefore, future applications of this approach should consider larger data sets. On the other hand, this issue with larger errors obtained from the previous set of pressurization rate tests might be solved by selecting tests carried out under not only the same confining pressures but also equal vertical pressures. At the same time, more effort should be put into developing easier ways to measure or estimate the radius of fluid penetration.
On the other hand, the extension of these solutions to field conditions is also of interest. Consider the Quasi-static solution given in Eq. (2). Then, if r0 tends to the infinite, the relation becomes equal to the elastic solution given by Hubbert and Willis (1957) when the horizontal stresses are the same. Therefore, the breakdown pressure prediction for field problems should use alternative solutions that consider the effect of the fluid infiltration area. Nevertheless, the approaches analyzed here have shown to be useful as they consider the geometry of the samples.
Conclusions
We have presented observations on the influence of the fluid infiltration area on the breakdown pressure during hydraulic fracturing, along with an analysis of the applicability of a Quasi-static and a Linear Elastic Fracture Mechanics (LEFM) approach for predicting breakdown pressure when using cylindrical samples subjected to triaxial conditions. Experimental observations have shown various degrees of infiltration under different pressurization rates for laboratory tests using Pocheon granite. At the same time, Dégué and Ladanyi (2000) introduced a relation that considers the fluid infiltration through the assumption of multiple radial cracks from the borehole. Solutions to the equilibrium equations were given based on two approaches, the Quasi-static and the LEFM. Then, the applicability of these relations was explored using two sets of hydraulic fracturing tests under constant pressurization rate and constant injection rate. The main conclusions are as follows. The issue of estimating the radius of fluid infiltration was worked out by solving for this parameter using the Quasi-static relation. The result highlighted the fact that the crack radius is not a material property and it changes with testing conditions. Then, this relation was used to back calculate the crack radius from initial sets of tests, for both pressurization rate and injection rate controlled tests. Later, the relations between the crack radius and the pressurization rate, as well as the injection rate were used to predict breakdown pressures for different tests. The calculations showed better predictions for the injection rate controlled tests than for the pressurization rate controlled tests, with average errors of 3.4% and 18.6%, respectively. This was because the injection rate controlled tests were conducted under the exact same conditions, while the pressurization rate tests differ on the value of the vertical pressure, a parameter that is not considered by the two approaches. Moreover, a sensitivity analysis illustrated the impact of the crack radius and the tensile strength on the breakdown pressure, suggesting the need for a careful estimation of these parameters. On the other hand, for the set of injection rate controlled tests, the LEFM solution offered better breakdown predictions than the Quasi-static solution, with errors of 3% and 3.8%, respectively. Finally, laboratory breakdown prediction considering sample geometry and fluid infiltration is possible, although larger data sets are desirable to validate and derived better relations.
