

Introduction
Study Area and Field Data
Integrated Section
Investigation of Physical Properties
Conclusions
Introduction
Geophysical methods generally consist of detecting contrasts in the physical properties of the subsurface in an attempt to characterize the subsurface environment responsible for these observations. However, the objectives of a specific survey often cannot be met by applying only one geophysical method, as different methods detect different material contrasts in the subsurface. For example, if we are mapping a three-layer aquifer system (clay, sand, and fractured bedrock), electrical methods are best suited to map the clay-sand contact due to its large resistivity contrast, whereas seismic methods are best suited to map the depth to bedrock due to the large seismic velocity contrast across the sand-bedrock contact. Therefore, the inclusion of multiple geophysical methods will detect a broader range of material contrasts in the subsurface and provide a more robust characterization of the subsurface environment.
Shallow seismic reflection (SSR) and ground penetrating radar (GPR) are representative geophysical methods for imaging shallow structures to address environmental, engineering, and exploration problems. As these two methods are based on seismic and radio wave propagation, respectively, they are ideal for both mapping subsurface structures and inferring material properties. SSR has become an increasingly preferred choice for near-surface imaging due to the continued and rapid development of improved field acquisition techniques, data processing capabilities, and interactive interpretation strategies (Yilmaz, 2001; Reynolds, 2011). In addition to the recent developments and advancements in surface wave analyses, SSR has also been broadly applied to provide high-resolution subsurface constraints to address a range of geotechnical problems (Knapp and Steeples, 1986; Kim et al., 1994; Miller and Xia, 1998; Kim and Kim, 2008). GPR is very similar to SSR in terms of both acquisition and processing; however, the two geophysical methods generally possess differing penetration depths into the subsurface. GPR is commonly limited to imaging the upper ~15 m due to the rapid attenuation of high-frequency (MHz–GHz range) radio waves (Van Overmeeren, 1994; Vandenberghe and Van Overmeeren, 1999; Neal, 2004), whereas SSR has traditionally been used to image greater depths (~50 m) due to the much lower dominant frequencies of the seismic waves.
In this study, SSR and GPR data were acquired at the Cheongju–Gadeok site of the Korea National Groundwater Monitoring Network to map the local alluvium water table. These two geophysical datasets were integrated into a single section and then analyzed with local electrical resistivity (ER) measurements to delineate the water table. Integration of the SSR and GPR sections into a single section required depth conversion using their optimum velocities to match the different wavelengths of the two datasets (Baker et al., 2001; Porsani et al., 2006; Sloan et al., 2007; Ju et al., 2014). We selected the water table at the Cheongju–Gadeok site of the Korea National Groundwater Monitoring Network as the target reflector for integrating the SSR and GPR datasets, since this reflector was clearly observed in both datasets and a simple horizontal reflector is preferred for the integration process. We then compared our modeled section to the field section and estimated the physical properties of the aquifer system through a joint simulation of the SSR and GPR observations (seismic velocities, dielectric constants, and porosities).
Study Area and Field Data
Structural deformation, generally related to tectonic processes, may disturb preexisting sedimentary facies and structures, particularly in the near surface. Seismic reflection coefficients estimated within a crystalline old rock terrane are thus not as large on average as those estimated along lithological boundaries in sedimentary environments. However, complicated geological structures and the lack of natural horizontal layering are common at shallow depths, with the reflected seismic waves from these shallow interfaces often lacking in lateral consistency and phase coherence (Klemperer and BIRPS group, 1987). Furthermore, these weaker shallow reflection events are usually overwhelmed by large-amplitude surface waves. Seismic data collected from such a hard rock environment are thus usually characterized by a low signal-to-noise ratio (S/N). We thus selected the water table as our target reflector, because there is little scattered energy from this flat interface (Kirsch, 2009). In such a horizontal layer environment, the acoustic impedance and dielectric constant contrasts across the layer are relatively large, with the reflection energy from this interface generally characterized by a relatively high S/N in both SSR and GPR datasets.
The Cheongju–Gadeok site of the Korea National Groundwater Monitoring Network was selected (Fig. 1a) to test the feasibility of mapping the water table and associated structures with joint seismic and radar methods. The SSR and GPR data were acquired along a 27-m-long line within the yard of the monitoring site, whereas the ER mapping was performed along a 96-m-long line, overlapping the SSR–GPR line and extending outside the fence surrounding the monitoring site. This small site was selected as our test area because the surface is flat along the profile, and the groundwater level is also assumed to be flat (Fetter, 2001). The water level was simultaneously measured with a series of electrical conductivity and temperature measurements in real time and was found to be 12 m deep during the survey period (K-water, 2014) (Fig. 1b).
Geologically, this site consists of Quaternary alluvium overlying Jurassic porphyritic granite (Fig. 2a). The main lithologies interpreted from local drillcore data are weathered soil in the upper 6.8 m (sandy clay and clayey sand), weathered rock in the 6.8–18.0 m depth range, soft rock in the 18.0–44.1 m depth range, and hard rock (porphyritic granite) below 44.1 m depth (Fig. 2b).
Since it is possible to integrate the two data types (SSR and GPR) if the wavelengths and resolutions of two datasets are approximately equal, the data were collected using optimal parameters with respect to the target water table reflection. Common midpoint (CMP) seismic reflection data were collected using a 24-channel ABEM Mark6 system and 100 Hz geophones placed at a 1 m spacing. The Seismic Impulse Source System (SISSY) was used as the source at 1 m intervals along the line, and a total of 27 record were acquired at a 1 ms sample rate in record length of 200 ms. Figure 3 shows a typical seismic record, with weak reflections observed at 92 and 113 ms for the nearest offsets. GPR data were collected using a MALÅ RTA system with a 50 MHz antenna, and traces were recorded at a 0.2 m interval along the line, with each trace consisting of 16 stacked records acquired at a 1.94 ns sample rate in record length of 362 ns. Since random noise overwhelmed our target reflectors, a new radargram was built by stacking sets of three neighboring traces to enhance these weak reflections. Our target reflection events are observed at 114 and 229 ns (Fig. 4a). Another separate GPR CMP survey was conducted to acquire the water table reflection hyperbola, where the root-mean-square (RMS) velocity down to water table was estimated to be 0.11 m/ns (Fig. 4b). This value was used for the radar time-depth conversion.
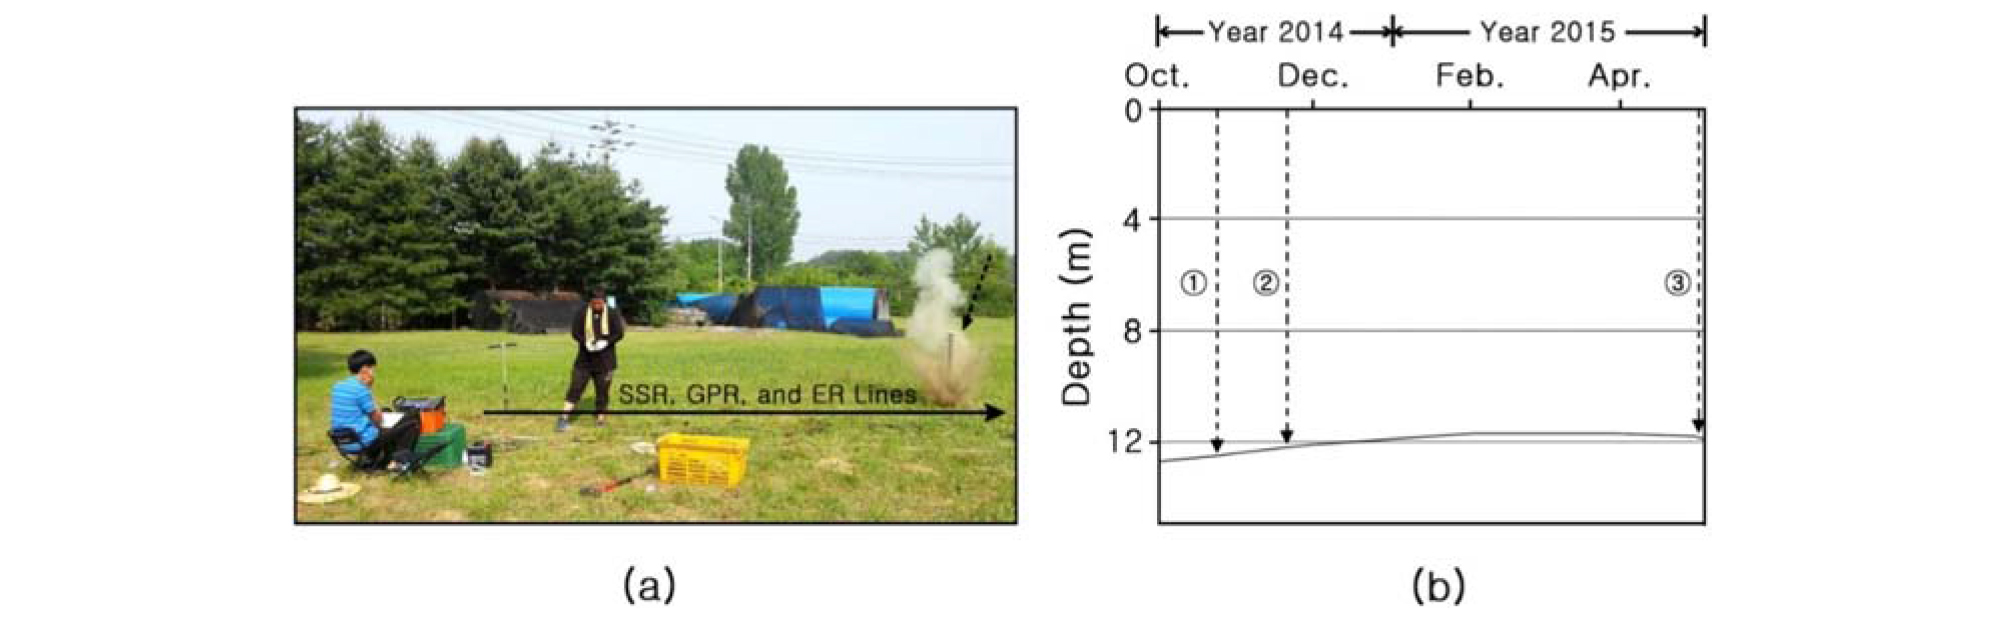
Fig. 1.
(a) Photograph of the test site, which is located on the yard of the Cheongju–Gadeok National Groundwater Monitoring Station. The SSR, GPR, and ER surveys were performed along the same line, indicated by the arrow. The white smoke plume on the right is from the Seismic Impulse Source System (SISSY). (b) Depth of the water table during the observation period. A consistent 12-m-deep water table was observed at the monitoring station throughout the year (K-water, 2014). The numbers ① , ② , and ③ indicate the depths measured on the survey dates for the GPR (Oct. 24, 2014), SSR (Nov. 21, 2014), and ER (May 4, 2015) surveys, respectively.
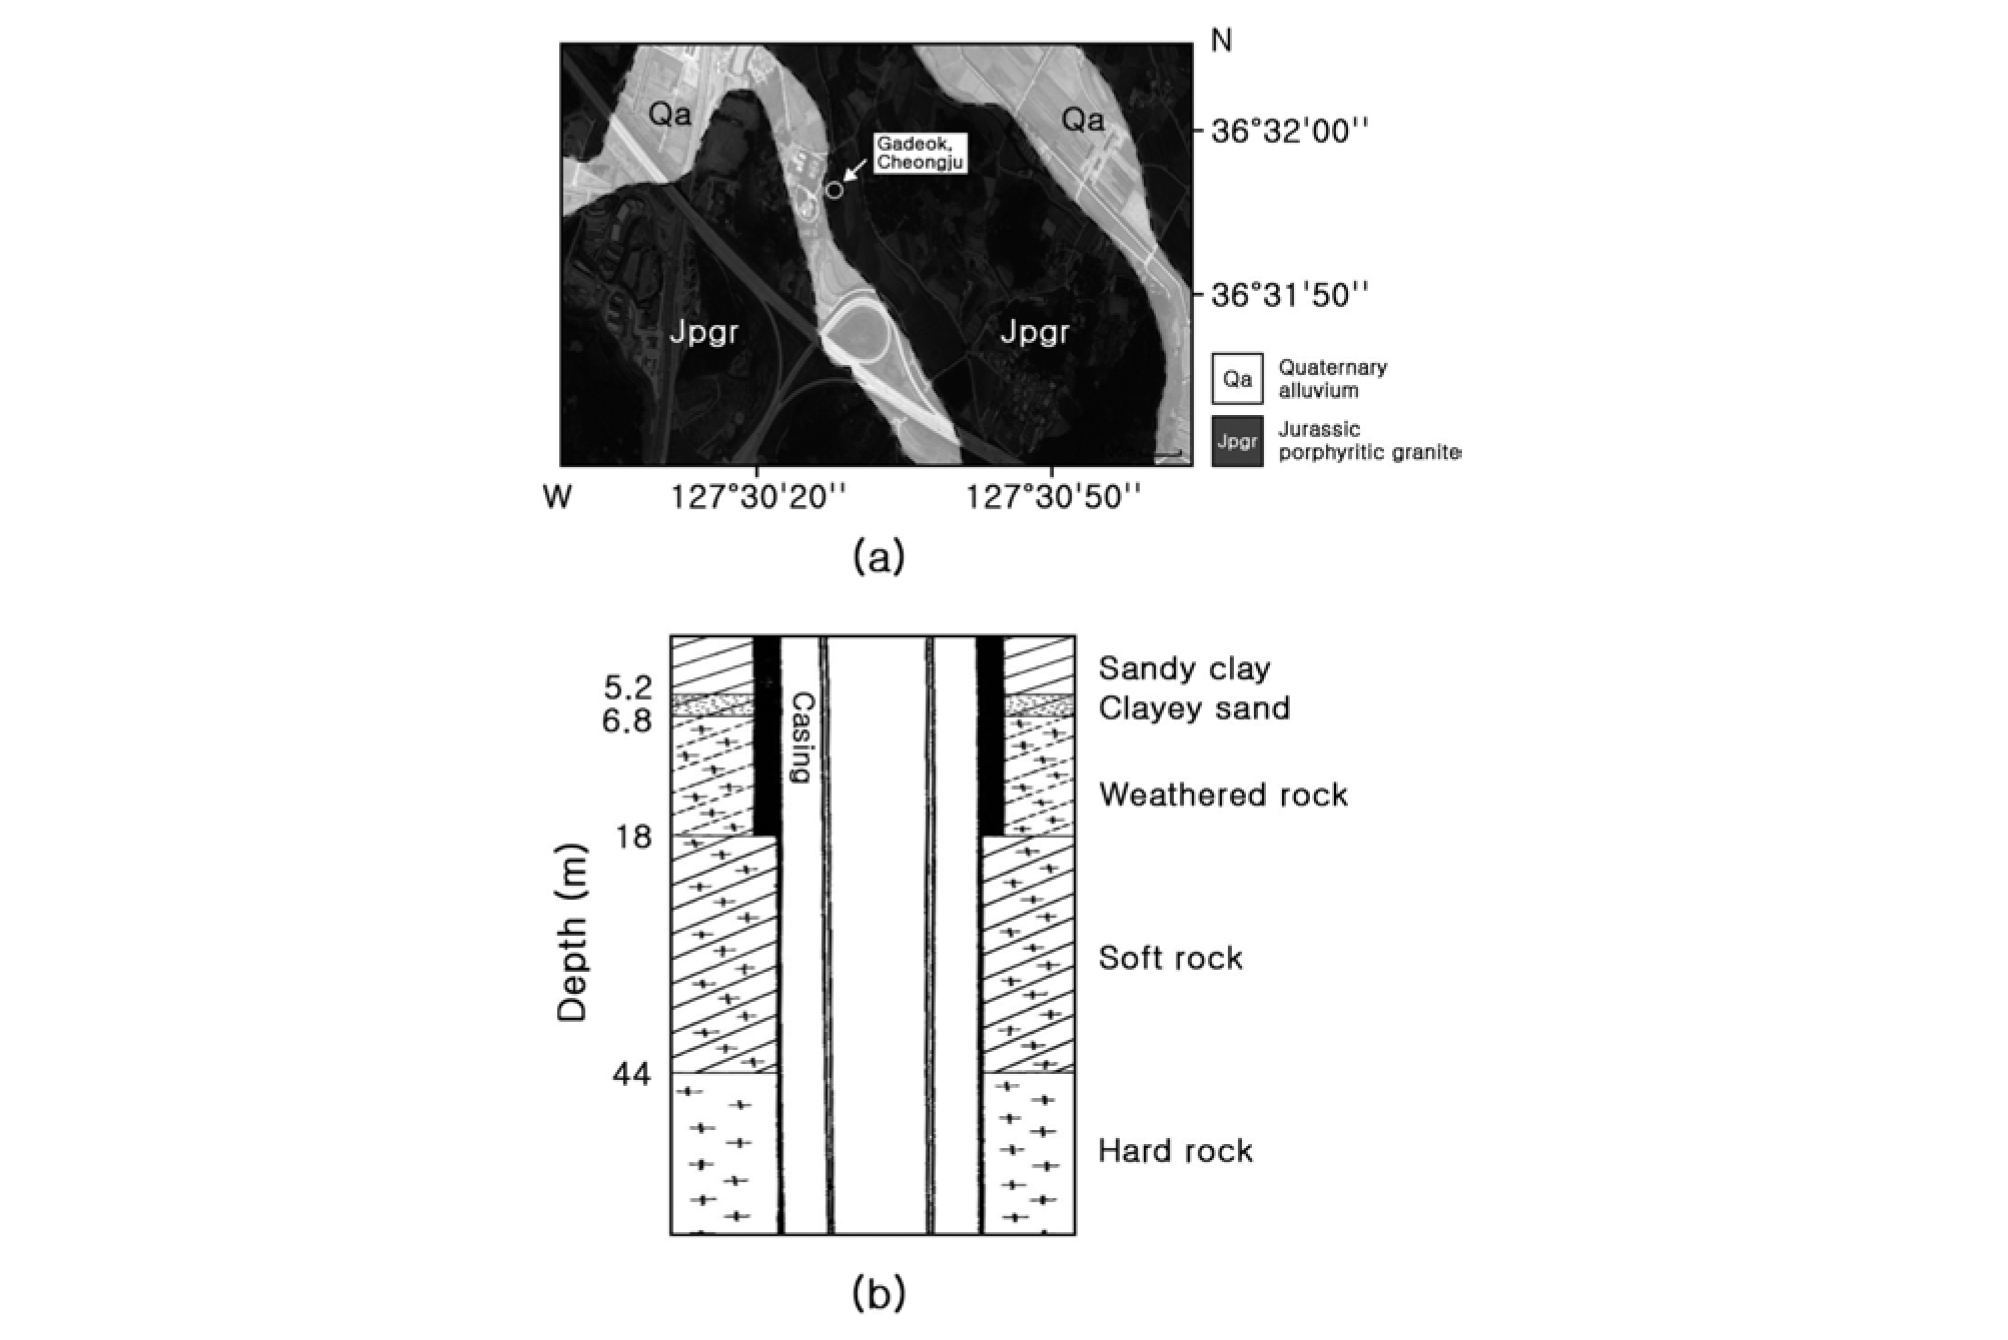
Fig. 2.
(a) Satellite photograph of the Cheongju region, overlain by a geological map (Lee et al., 1980), and (b) drillcore description from a local observation well indicated by arrow in (a). SSR and GPR surveys are primarily focused to delineate the 12.5-m-deep water table within the weathered rock.
Integrated Section
For a wave that reflects off a flat interface at normal incidence, the P-wave and radio-wave reflection coefficients are represented by equations (1) and (2), respectively (Kim et al., 2014):
 (1)
(1)
 (2)
(2)
where V1 and V2 are the P-wave velocities, ρ1 and ρ2 are the densities, and ε1 and ε2 are the dielectric constants for upper (1) and lower (2) layers of the SSR (or GPR) reflection interface, respectively.
As described above, SSR and GPR reflection coefficients for the water table generally possess a large S/N because these reflections arise from the boundary between the unsaturated and water-saturated zones of the aquifer system. Compared with the upper layer, the materials underlying the water table possess a much larger acoustic impedance (product of velocity and density) due to the saturation of water in the pore space (Kirsch, 2009). Dielectric constants are also sensitive to water in the pore space (Reynolds, 2011). Therefore, the SSR and GPR reflections from the water table provide a good interface for integrating the SSR and GPR datasets.
The seismic data were processed using the VISTA2D/ 3D processing software package (Schlumberger Ltd., 2014b) and programs developed in-house. The noise and wavelet distortions from strong shot-generated surface waves and near-surface irregularities were expected in the SSR experiment and addressed accordingly. The basic processing steps employed to image these shallow and weak reflections in Fig. 3 included: removing bad traces (depending on the observable arrivals), radiation filtering, surgical muting, and time-to-depth conversion using the optimum seismic velocities. Two weak reflections are observed at 92 and 113 ms for the nearest offsets. To further enhance these weak reflections, we conducted a surgical mute to remove the upper zone, as indicated by the dashed line in Fig. 3. The GPR data were processed using the REFLEXW software package (Sandmeier-geo Ltd., 2014), which was then converted to SEG-Y format using the VISTA2D/3D package (Schlumberger Ltd., 2014b). Given that the respective trace spacings for the SSR and GPR datasets were 0.5 and 0.2 m, the neighboring three traces (i.e., 1–3, 3–5, and 5–7) of the GPR data were stacked to build new traces that approximately matched those in the SSR data; this also improved the S/N of the GPR data, thus enhancing the near-surface weak reflections that were present.
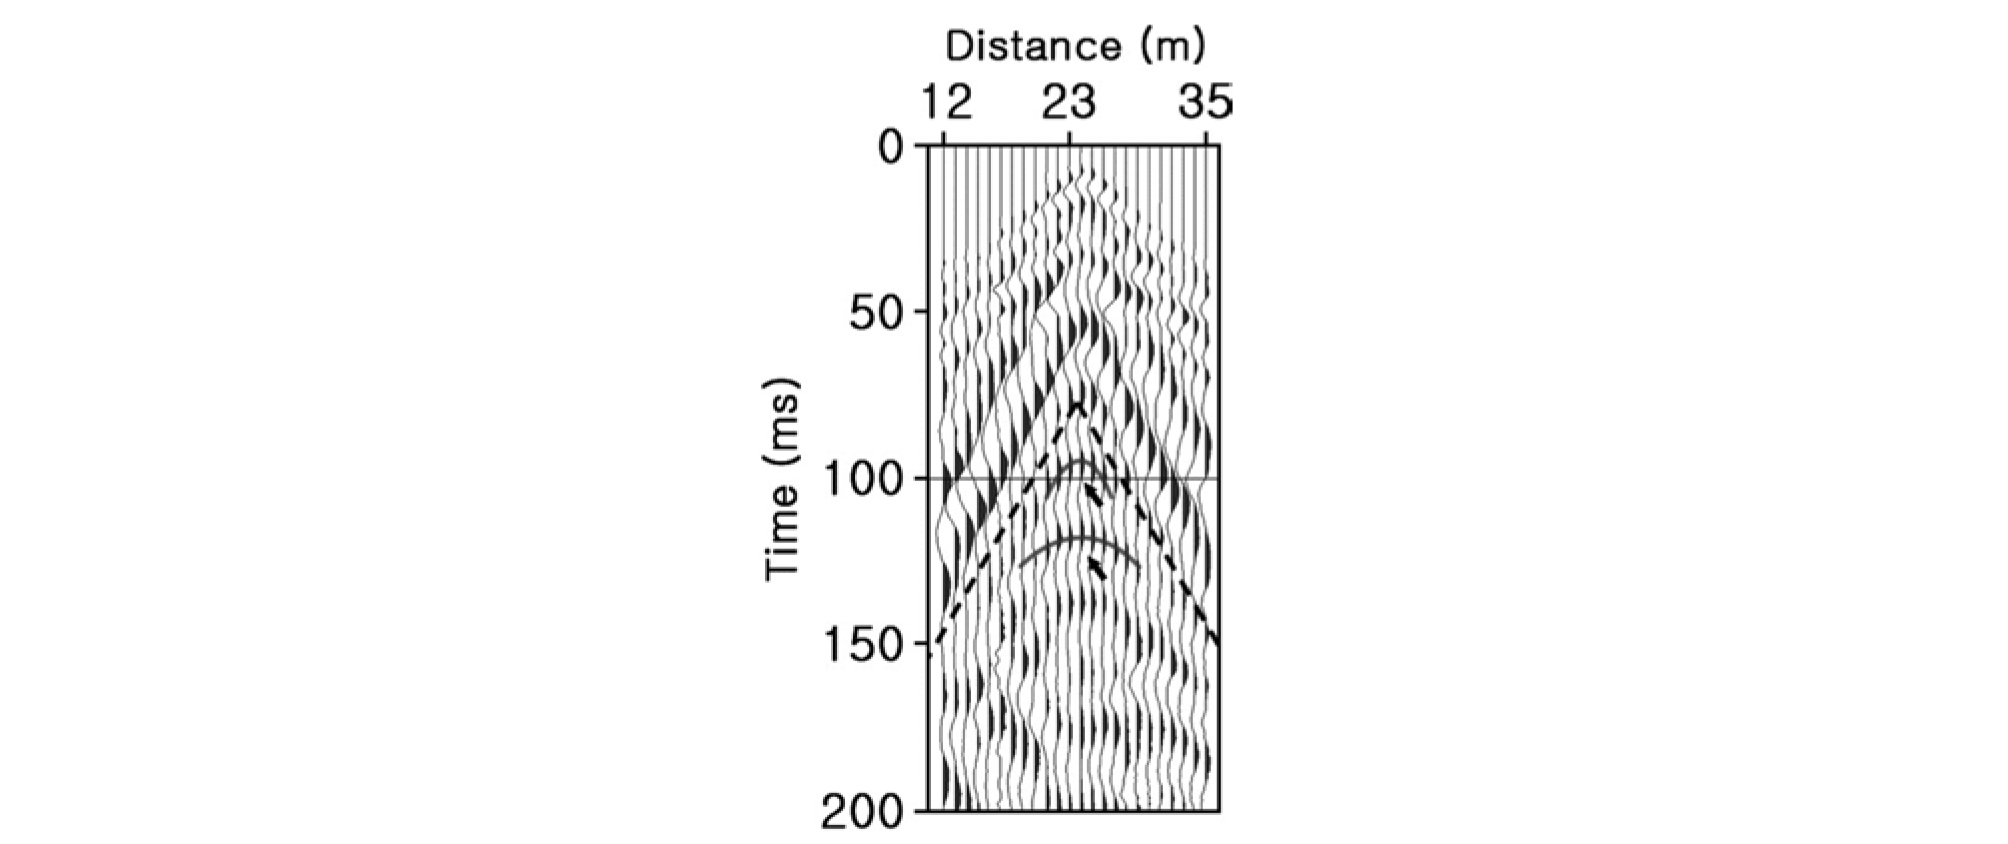
Fig. 3.
Typical SSR field record, collected with a SISSY source. The zero-offset reflections at 92 and 113 ms, indicated by the arrows and gray hyperbolas, are hidden or distorted by the surface waves and subsurface irregularities. Surgical muting was applied to remove the signal above the dotted line and improve the S/N of the target reflections.
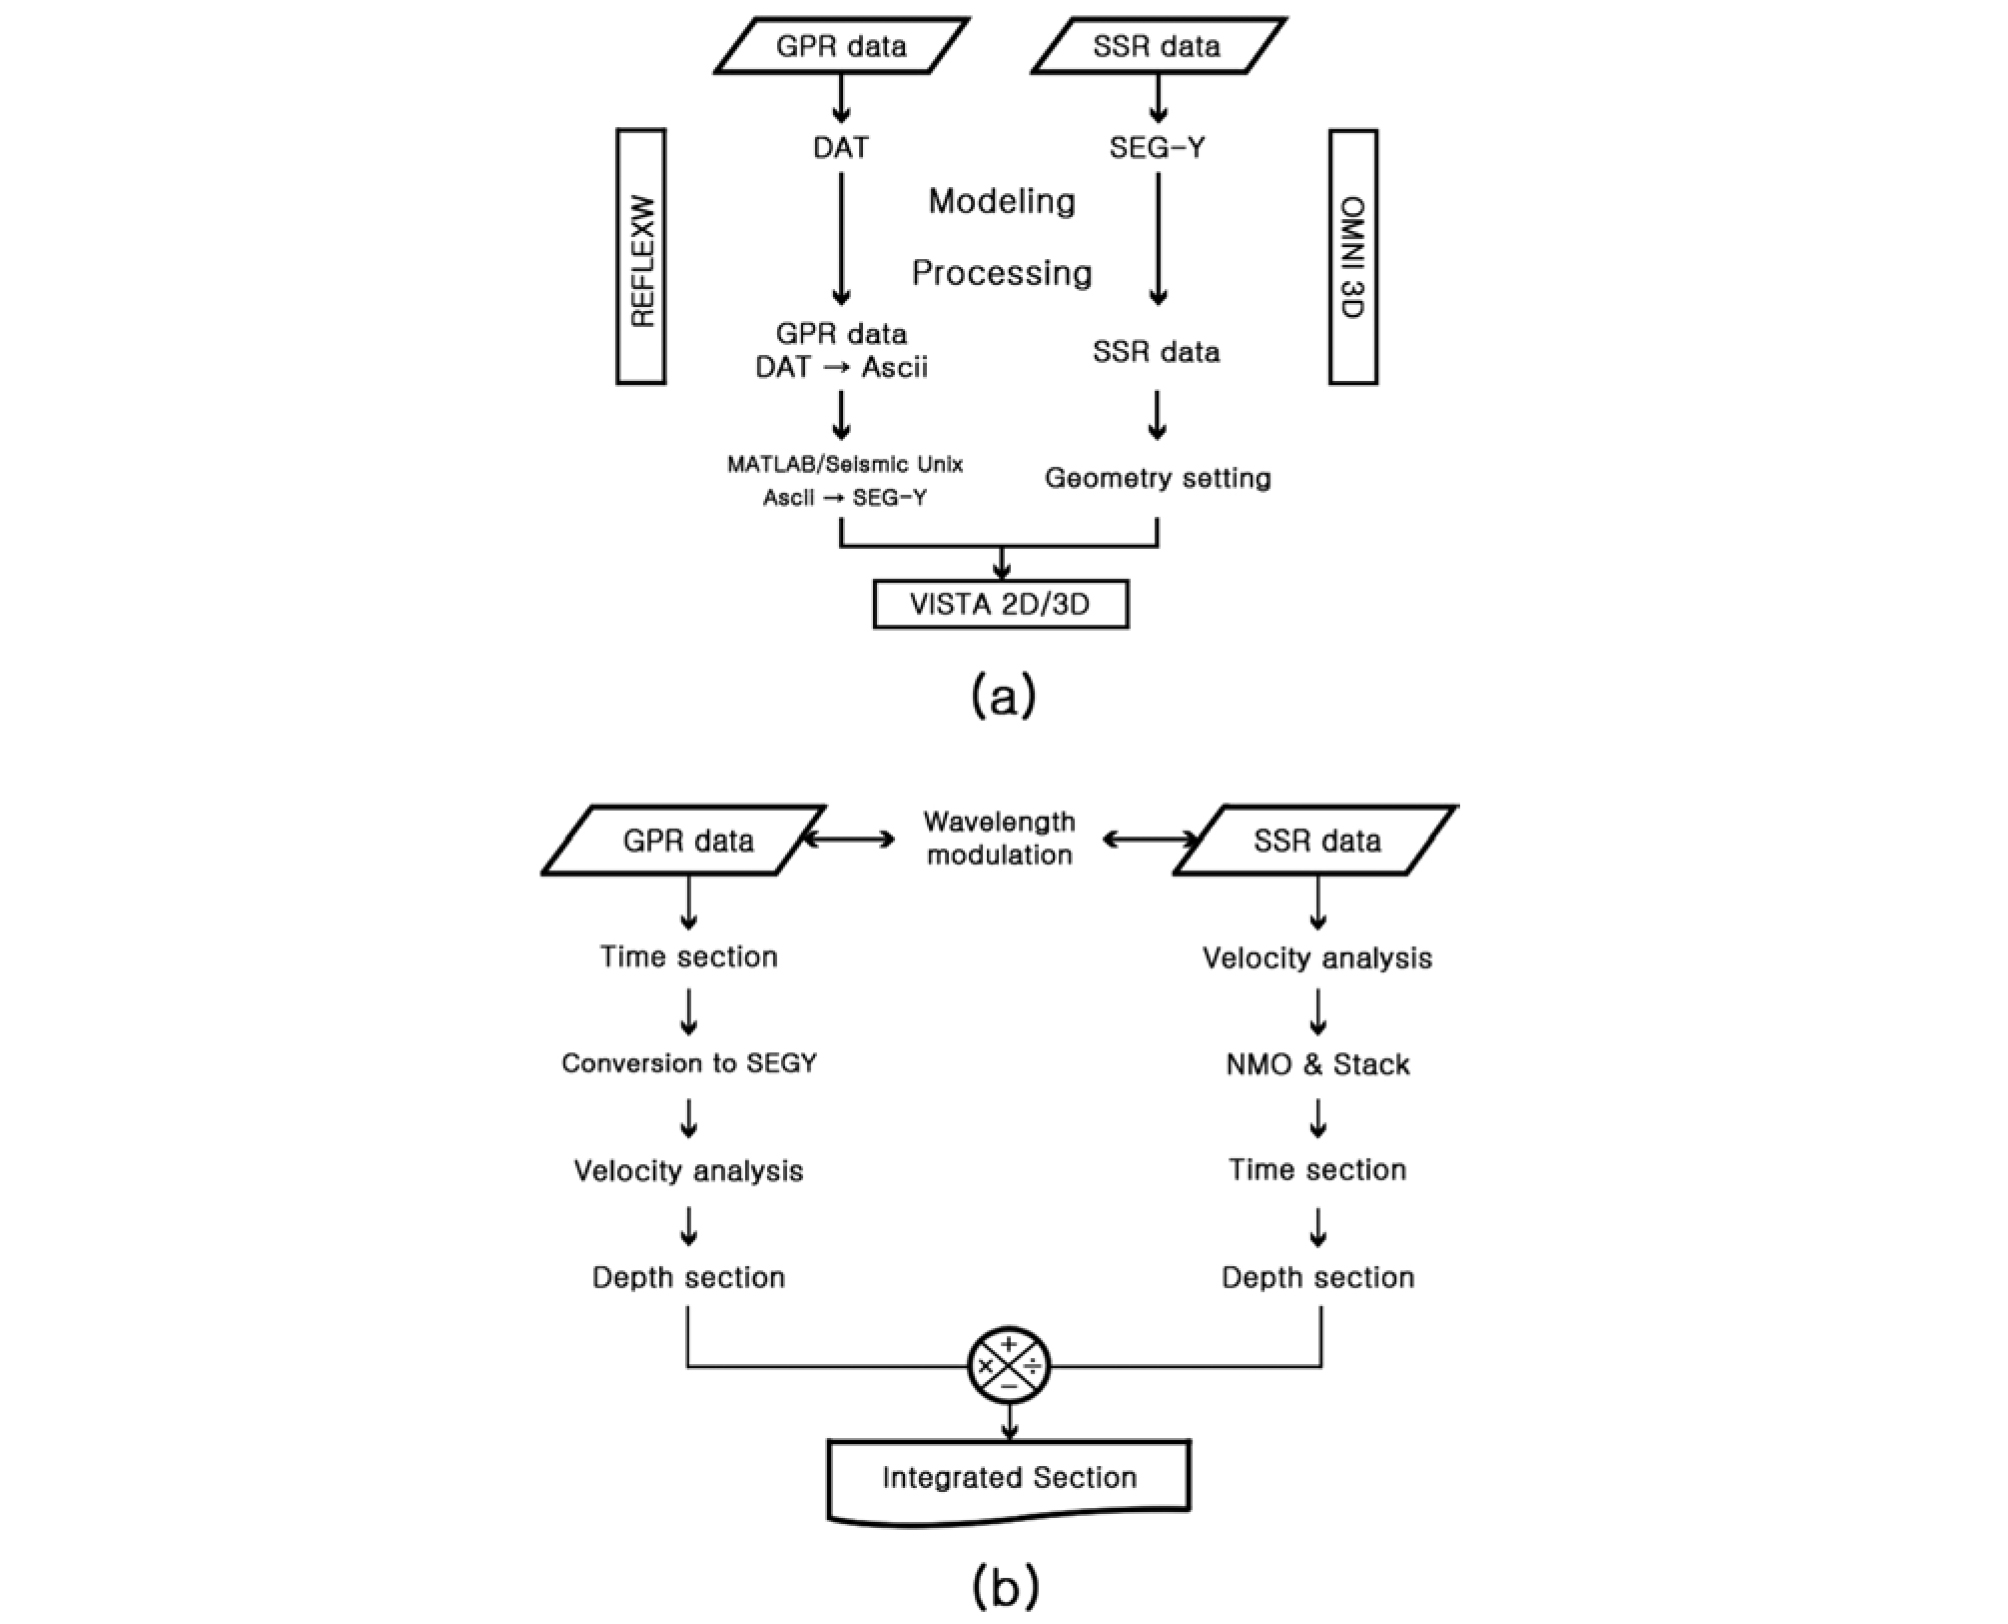
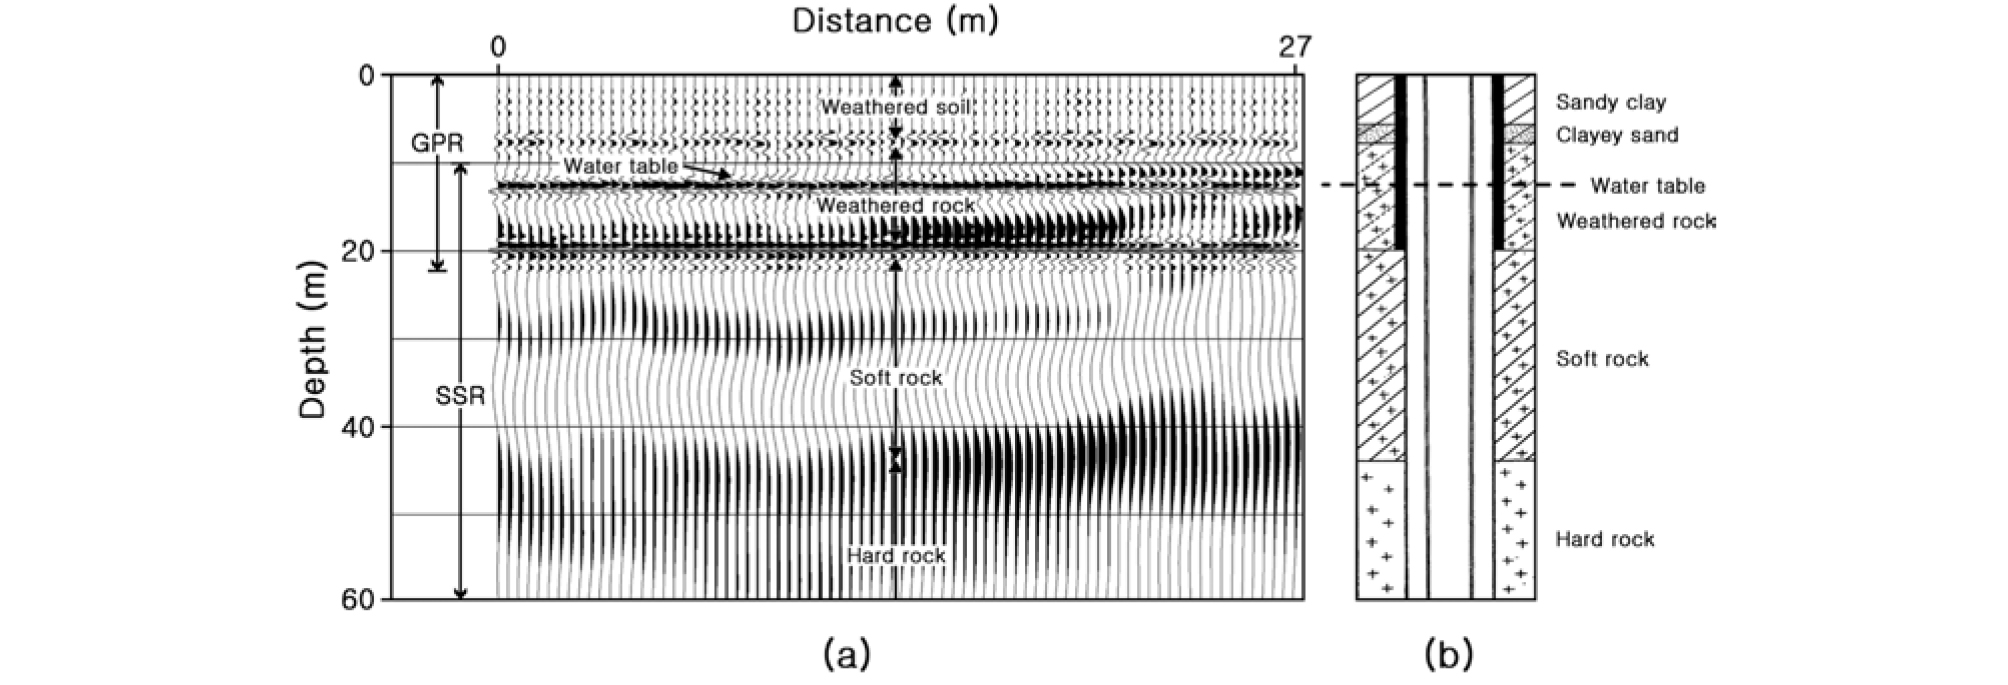
Integration of the SSR and GPR datasets into a single section required depth conversion of the two datasets, as well as SSR and GPR reflectors that possessed similar wavelengths. The depth conversion was a necessary step, as the two datasets were acquired at quite different timescales. As for the wavelengths, a seismic wavelength of 3.9 m was calculated from the dominant frequency of 100 Hz and seismic velocity of 390 m/s for the 12.5-mdeep water table, whereas a radar wavelength of 3.2 m was calculated from the electromagnetic velocity of 0.11 m/ns from the CMP GPR hyperbola (Fig. 4b) and a central frequency of 35 MHz. The similarity of these two wavelengths suggests that it is feasible to integrate the SSR and GPR datasets. Figure 5 shows the flowcharts that were employed in this study during the processing and integration of the two datasets. In the integrated section (Fig. 6), the interfaces at 6.8 and 12.5 m depth are GPR reflections, whereas the interfaces at 12.5, 20, and 40 m depths are SSR reflections; note that the 12.5 m interface is observed in both the SSR and GPR datasets, and this is the reflector we used to integrate the two datasets. The lack of GPR reflectors below 12.5 m depth is likely due to the rapid attenuation of the high-frequency radio waves, which we attribute to the presence of near-surface clay layers. The SSR reflections below the water table are elongate because we modulated the wavelength with respect to the overlying water table.

The reflection events in the integrated section correlate well with the facies identified from the drillcore: upper sandy clay (weathered soil), water table, porphyritic granite (weathered rock), soft rock, and hard rock (Fig. 6). The distinct identification of the water table at 12.5 m depth in both the SSR and GPR datasets highlights the large acoustic impedance and dielectric constant contrasts across the water table interface. This SSR and GPR reflection event is comparable to the water table level of 12 m that was measured on the survey dates (GPR: Oct. 24, 2014; SSR: Nov. 21, 2014) (Fig. 1b). The deeper weathered rock–soft rock (18 m depth) and soft rock–hard rock (44 m depth) contacts also correlated well with the drillcore facies, although the seismic resolution becomes degraded because of the elongation of the reflection wavelet with depth. The seismic reflections at 30 m depth, which are discontinuous and weak, likely arise from local fracture zones within the soft rock layer.
Investigation of Physical Properties
A simplified synthetic SSR–GPR section was constructed from the four key reflection interfaces observed in the integrated section (weathered soil, weathered rock, soft rock, and hard rock), with their respective interfaces situated at 6.8, 18, and 44 m depths; the 12.5-m-deep water table is included as another reflection interface (Fig. 6).
The seismic synthetic data were simulated with a 100 Hz source Ricker wavelet, 24 channels at a 1 m spacing, 1 m shot interval, and 1 ms sampling interval, using the OMNI3D software (Schlumberger Ltd., 2014a). The GPR data were synthesized with a 50 MHz central frequency, 20 cm common offset, and 1.94 ns sampling interval, using the REFLEXW software (Sandmeier-geo Ltd., 2014). The GPR data were then reformatted to SEG-Y for a time-todepth conversion, using the VISTA 2D/3D seismic software (Schlumberger Ltd., 2014b).
The optimum seismic velocities (vseismic), dielectric constants (ε), and porosities (φ) for the model were inverted to determine the best fit between the synthetic model and the observations. Initial values of vseismic = 1,500 m/s and ε= 81 were selected for the water in the model. The properties of the other layers (sand, clay, and porphyritic biotite granite) were derived from the values listed in KSEG (2011) and are presented in Fig. 7. As shown in equations (3)–(5), the speeds of the radio waves and seismic velocities are dependent on the porosity of the substrate, with an increase of water content causing a nominal decrease in vradio when εm (matrix) and εw (pore mw water) are fixed (Reynolds, 2011).
Fig. 7.
Simplified SSR–GPR model derived from the main reflections identified in the integrated section (Fig. 6). The best-fit seismic velocity (vseismic= 1,000 m/s) and dielectric constant (εr= 16) of the saturated weathered rock layer (below the water table) were determined through a joint simulation to fit the synthetic section to the field section.
 (3)
(3)
 (4)
(4)
 (5)
(5)
Here we fix vseismic and εr for the weathered soil, dry weathered rock (above the water table), soft rock, and hard rock layers in our model. We then invert to iteratively optimize the values of vseismic and εr for the saturated weathered rock layer (below the water table) by varying φ for this layer when v (matrix) and vf (pore fluids) are mfixed. The best-fit values of vseismic = 1,000 m/s, εr= 16, and φ = 0.32 for the saturated weathered rock layer yielded an integrated synthetic section (Fig. 8) with the closest fit to the field section (Fig. 6a). The water table at 12 m depth appears to be a fully overlapped event from the SSR–GPR integration. Such a close fit verifies the reliability of the input aquifer model (Fig. 7).
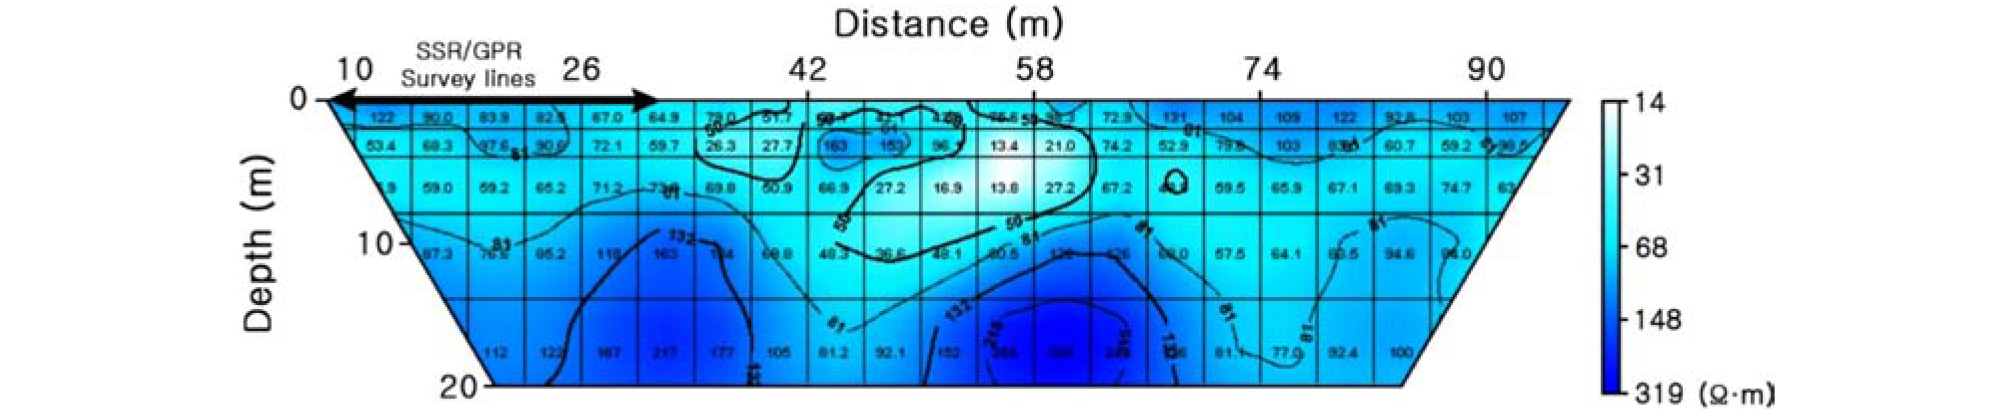
The optimized porosity of 0.32 is in the range of 0.25–0.4 that is generally observed for biotite granite (Han, 1998). This value likely represents the bulk physical properties of the soft rock layer, which includes the intensively developed fracture zone. Such a high porosity is supported by the low ER values (<200 Ω·m) observed down to the base of the weathered rock layer (~18 m depth) (Fig. 9), which is below the water table (Fig. 6).

Fig. 8.
Integrated synthetic section, derived from the SSR and GPR data. The water table and the other interfaces were modeled to match the field section observations (Fig. 6). The SSR and GPR reflection relating to the water table interface, which is coincident with the reflection in the field section (Fig. 6), yields a porosity of 0.32.
Conclusions
SSR and GPR data collected at the Cheongju–Gadeok site of the Korea National Groundwater Monitoring Network were successfully integrated to produce a single depth section. While the SSR data are unable to effectively discern structures in the shallow zone (upper ~10 m) due to the lower seismic frequencies (~100 Hz), the penetration depth of the GPR data is limited to the near surface (upper ~15 m) due to the rapid attenuation of the high-frequency radio waves. Integration of these two geophysical datasets thus allows us to characterize the subsurface structure of the aquifer system from the surface to ~50 m depth. The water table, mapped at 12 m depth, was detected by both the SSR and GPR methods, and served as the key pinning point to integrate both datasets into a single depth section by matching their respective wavelengths.
The physical properties of the weathered rock layer underlying the water table were inferred through the simulation of the SSR and GPR data, assuming a simplified aquifer model. The best-fitting seismic velocity, dielectric constant, and porosity for this weathered rock layer are vseismic = 1,000 m/s, εr = 16, and φ = 0.32, respectively.
