

Introduction
Materials and Methods
Study Area
Groundwater Flow Modeling
Results and Discussion
Without Sand Dam
With Sand Dam
Summary and Conclusions
Introduction
In mountainous areas with ephemeral and intermittent rivers, water harvesting is indispensable to secure ecological, agricultural, industrial, and domestic water supply demands in dry periods (Subagyono and Pawitan, 2008; Ertsen and Hut, 2009; Lasage et al., 2015; De Trincheria et al., 2018). In this regard, sand storage dam is a successful water harvesting technology particularly in arid and semiarid environments (Quilis et al., 2009; Jadhav et al., 2012; De Trincheria et al., 2016). Sand dam harvests excess water, stores excess water mainly in the sand, to overcome drought periods in an ephemeral river (Lasage et al., 2008, 2015; Quinn et al., 2019). Studies also show that sand dams help to overcome water scarcity during long-term climate changes (Aerts et al., 2007; Ryan and Elsner, 2016). Water harvesting using sand dams has several more advantages including minimizing evaporation, groundwater recharge, less pollution, and simplicity of construction (Baurne, 1984; Ertsen and Hut, 2009; Stern and Stern, 2011; Villani et al., 2018).
In aquifers that have a full connection with the river, a sand dam may be considered as managed recharge (Quinn et al., 2019). Even though it is difficult to quantify, several researchers confirmed that the seepage from the riverbed and riverbank recharges the surrounding aquifer depending on the groundwater head (Hoogmoed, 2007; Hut et al., 2008; Quilis et al., 2009; Quinn et al., 2019). This phenomenon may last throughout the year. Consequently the groundwater level in the sand dam area increases (Yifru et al., 2018; Quinn et al., 2019). As the water table increases the natural vegetation-indigenous trees and riparian plants will get more water and live longer. The ecosystem restored and biodiversity has the potential to increase with the increase in groundwater level after the sand dam construction (Stern and Stern, 2011; Ryan and Elsner, 2016).
Evaporation from sand is relatively low (Hellwig, 1973; Hut et al., 2008; Quinn et al., 2019). This makes the water available for a long time but it is dependent on the depth of the accumulated sand. Coarse gravel sand can be filled with water to 35 percent of its volume (Lasage et al., 2008; Maddrell and Neal, 2012). As the water level in the sand storage decrease to a few centimeters, the evaporation loss becomes significantly low (Baurne, 1984). And thus taking into consideration this concept in the study and construction of a sand dam is essential.
Evaporation from sand is relatively low (Hellwig, 1973; Hut et al., 2008; Quinn et al., 2019). This makes the water available for a long time but it is dependent on the depth of the accumulated sand. Coarse gravel sand can be filled with water to 35 percent of its volume (Lasage et al., 2008; Maddrell and Neal, 2012). As the water level in the sand storage decrease to a few centimeters, the evaporation loss becomes significantly low (Baurne, 1984). And thus taking into consideration this concept in the study and construction of a sand dam is essential.
Usually, more than one sand dam built in sequence to maximize the local storage capacity in a wider area or watershed scale. However, the total effect of the sand dam in the area may not be the aggregate sum of all the dams built. The result is site-specific and different for each sand dam. Therefore, it is important to evaluate each sand dam based on the specific site condition by including the most possible details in the numerical models (Quilis, 2007). If the sand dam site selection, height, downstream protection, and other hydrological changes are not studied well and acted accordingly the disadvantages may outweigh.
Sand dam technology has a long-time history and implemented all over the world (Baurne, 1984; Hut et al., 2008; Yifru et al., 2018). The application is more common in arid and semi-arid areas. Recently it is widely used in Ethiopia and Kenya dry riverbeds to increase the local storage capacity for small irrigation schemes and drinking purposes. The community gets water from the sand dam area in different ways. The most common water abstraction ways are using embedded pipe near the bottom of the sand dam wall on the downstream side, using pumping wells installed on the riverbank, and in the rural area of Africa scoop holes are also other ways (Borst and de Haas, 2006; Quinn et al., 2018; Villani et al., 2018). However, the studies on hydrogeology and the effect of a sand dam on the groundwater level are limited (Aerts et al., 2007).
This work focuses on the assessment of the effect of the sand dam on the groundwater level in Chuncheon, South Korea. The groundwater head was evaluated using the MODFLOW model before and after the construction of a sand dam. The effect of groundwater abstraction and conductivity of sand material on the fluctuation of the groundwater table was also assessed.
Materials and Methods
Study Area
The location of the sand dam has a substantial effect on its effectiveness. To bring the desired hydrological impact the location should be selected cautiously (Ryan and Elsner, 2016). The selection of a sand dam site is practically similar to any surface water-storing dams. Keeping the length of the dam wall short, maximized storage in a minimum surface area, accessibility, suitable slope that maximize storage and accumulation of sand, good material type in the riverbed, social aspect, and water availability are the key issues need to be addressed in the selection process (Nissen-Petersen, 2000; Nissen-Patterson, 2006; Pauw et al., 2008).
To minimize the length of the dam but get the maximum possible storage without submerging large area of land or valuable property the site should be a narrow valley or deep gorge. The upstream area should be large enough and ideal slope to store the maximum amount of sand. The availability of local construction materials and thickness of the riverbed are also important things to consider (Baurne, 1984).
The current study area has a pronounced elevation difference, which varies from 350 m to 240 m above sea level. Fig. 1 shows the topography and model boundary of the study area. The elevation difference downstream and upstream of the dam site is easily noticeable. The slope difference along the river (from point A to point B) is also depicted in Fig. 1. Since the DEM is 30 × 30 m of horizontal resolution, it is not easy to see the gorge. However, the overlain contour is based on field data and it shows the elevation difference and the gorge clearly.
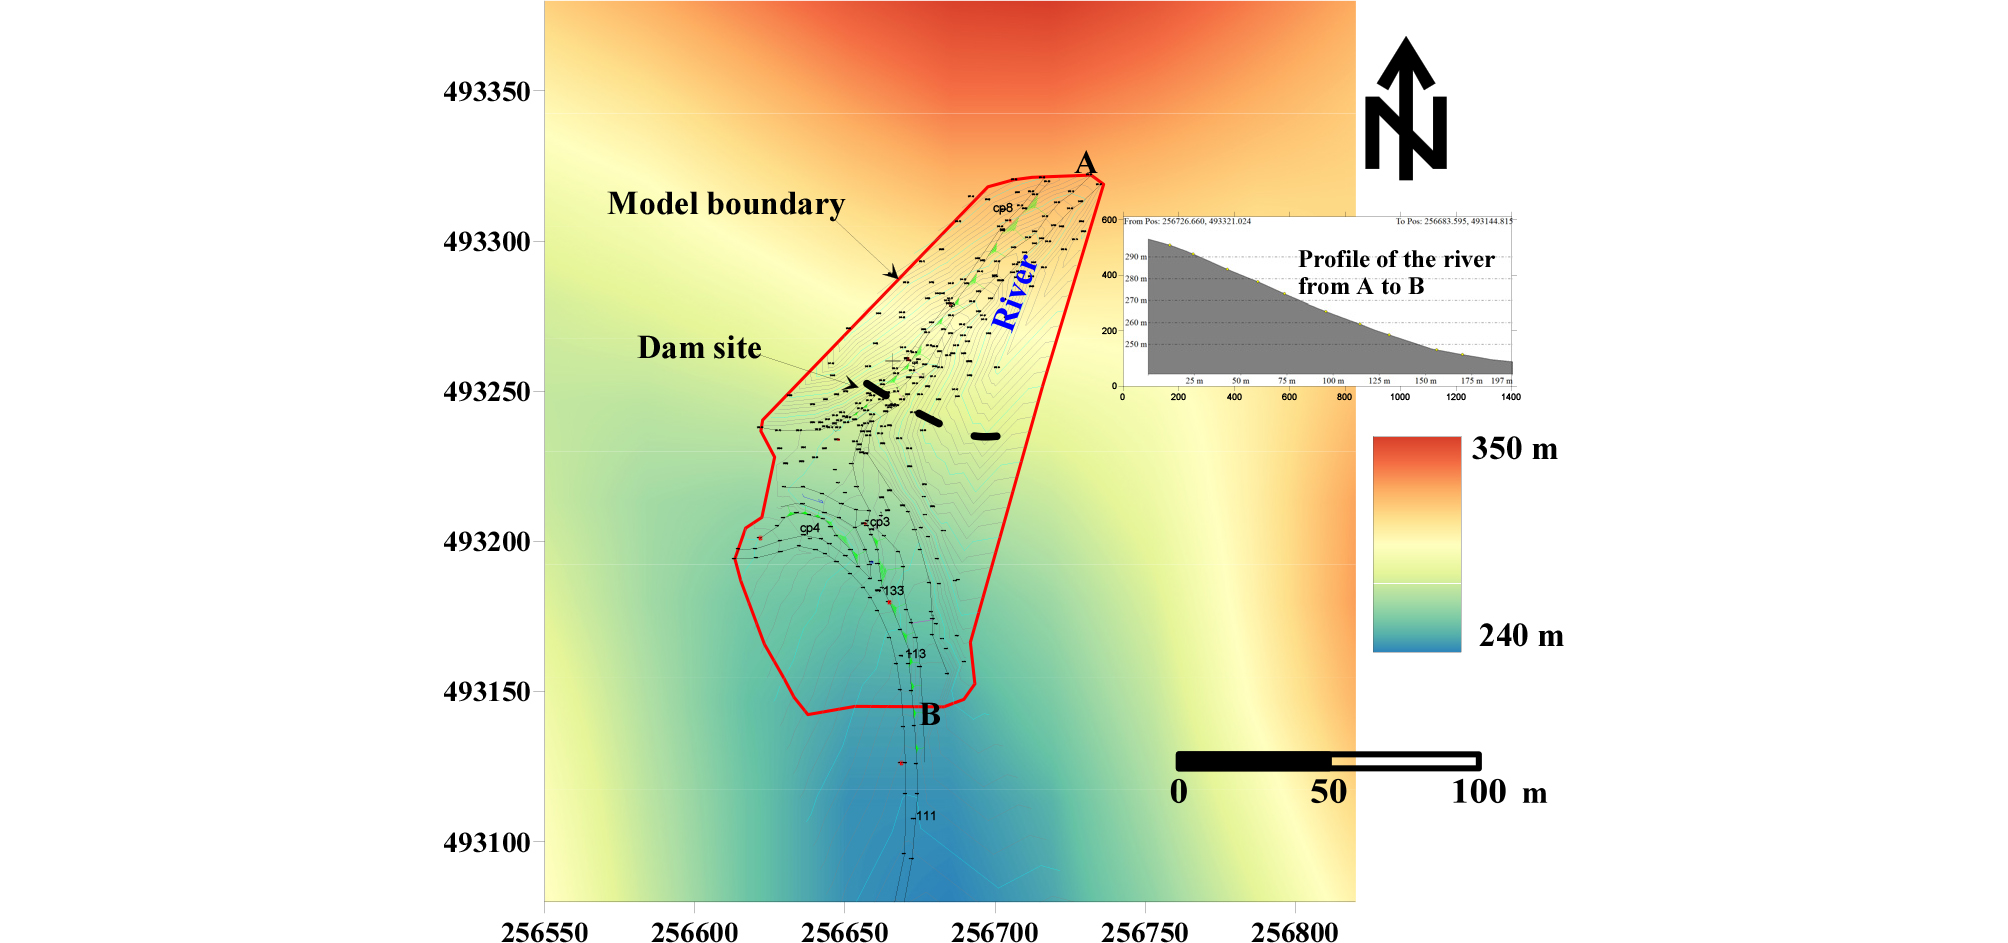
A river, which runs from north to south, crosses the conceptualized model area. The river has an average discharge of 1,755.27 m3/day. The flow in this river is seasonal; it has almost zero flow rate in dry periods. This data does not include the low flow in the winter. The flow measurement is mostly ignored at the winter low flows.
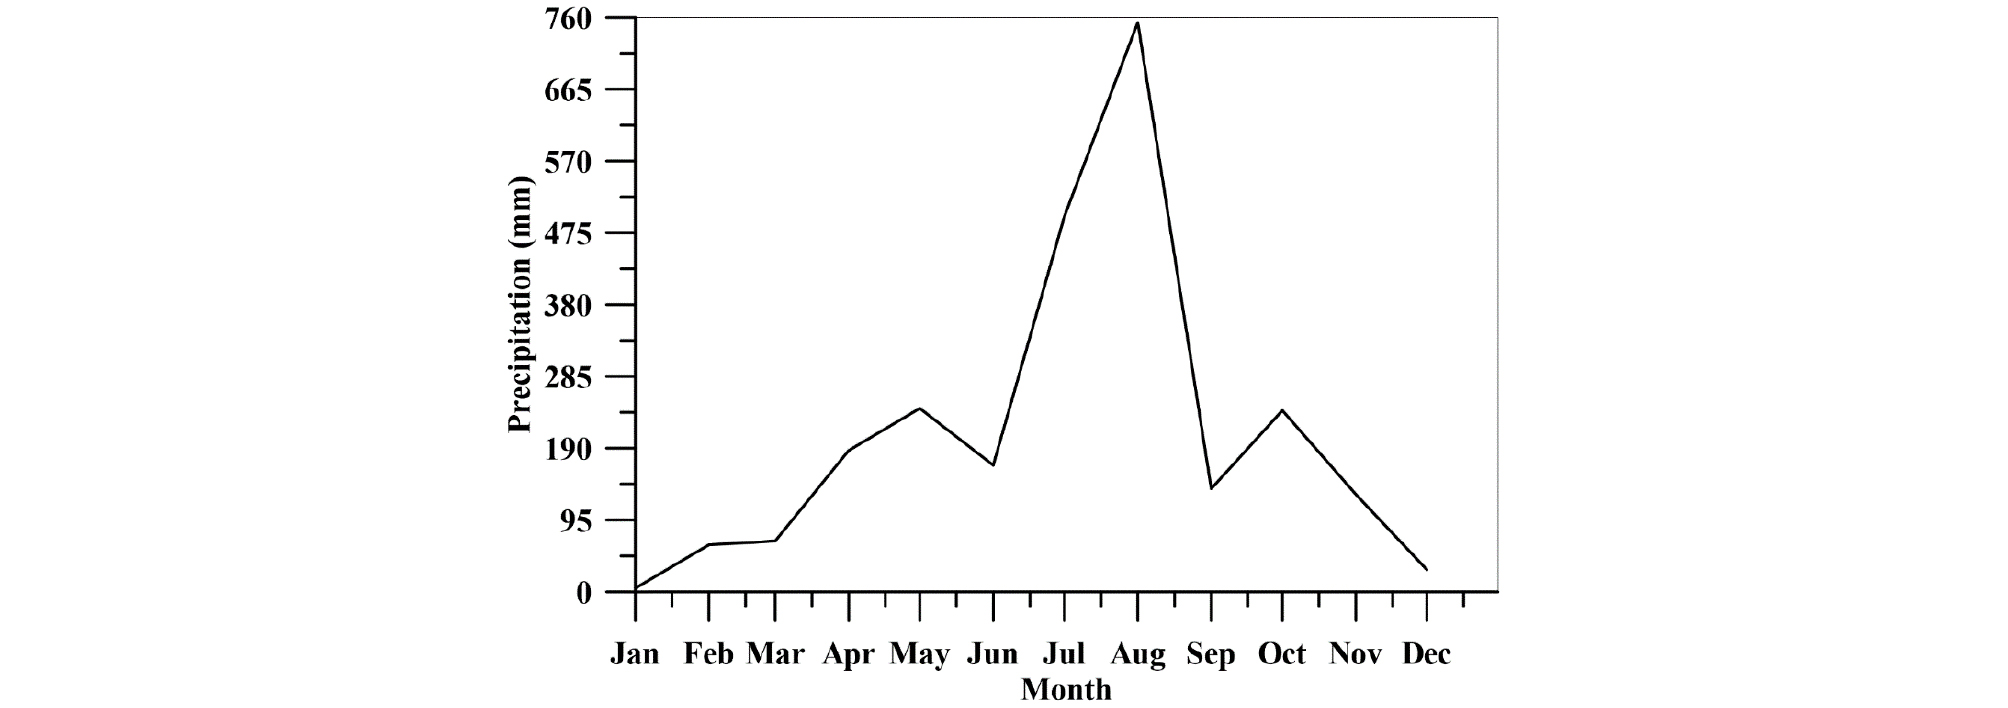
Fig. 2 shows the average monthly precipitation pattern of the study area. The precipitation in the area varies from zero to 750 mm per month. The area gets the majority of the precipitation from June to September. The maximum precipitation occurs in August. In the modeling, the precipitation is used to approximate the groundwater recharge.
Groundwater Flow Modeling
The effect of a sand dam on the groundwater level was tested by modeling a small area near the proposed sand dam site using the MODFLOW model. The MODFLOW solves the three-dimensional flow of groundwater of constant density through porous earth material which can be described by Eq. (1) (Langevin et al., 2003).
where, Kxx, Kyy, Kzz are principal components of the hydraulic conductivity tensor in x, y, z special directions, W is the source or sink, Ss is specific storage (1/L), h is the hydraulic head (L), and t is time.
The model is built as a single layer with a depth of 100 m and discretized into four mathematical layers to see the fluctuation of the groundwater level with different scenarios developed. The model has a 100 × 100-cell size which resulted in 21320 active cells. The river flow was modeled using a river package in MODFLOW. The river package was used to simulate the influence of the river water level on groundwater. The package needs river stage, riverbed bottom, and conductance, which are all difficult to measure. In this model, riverbed bottom was approximated from DEM, river stage from measured data, and the conductance is set by trial and error. The entrance and the exit of the river are assigned as specified head boundary (by parallel flow concept) and the rest of the model is considered as a no-flow boundary.
Surface recharge is another important boundary condition. In this study, the recharge was approximated from the precipitation in the area and applied to the upper-most active cells. Nearly 20 percent of the precipitation was considered as surface recharge.
In this study, six numerical models were built based on the current site information and some assumptions. The first two models are bases used to understand the groundwater condition before the construction of the sand dam and with no pumping wells. The second two models were built to evaluate the effect of the sand dam on the groundwater level with and without pumping. And the last two models were built to assess the effect of the material with and without pumping wells. All six models are based on the same grid size and surface recharge.
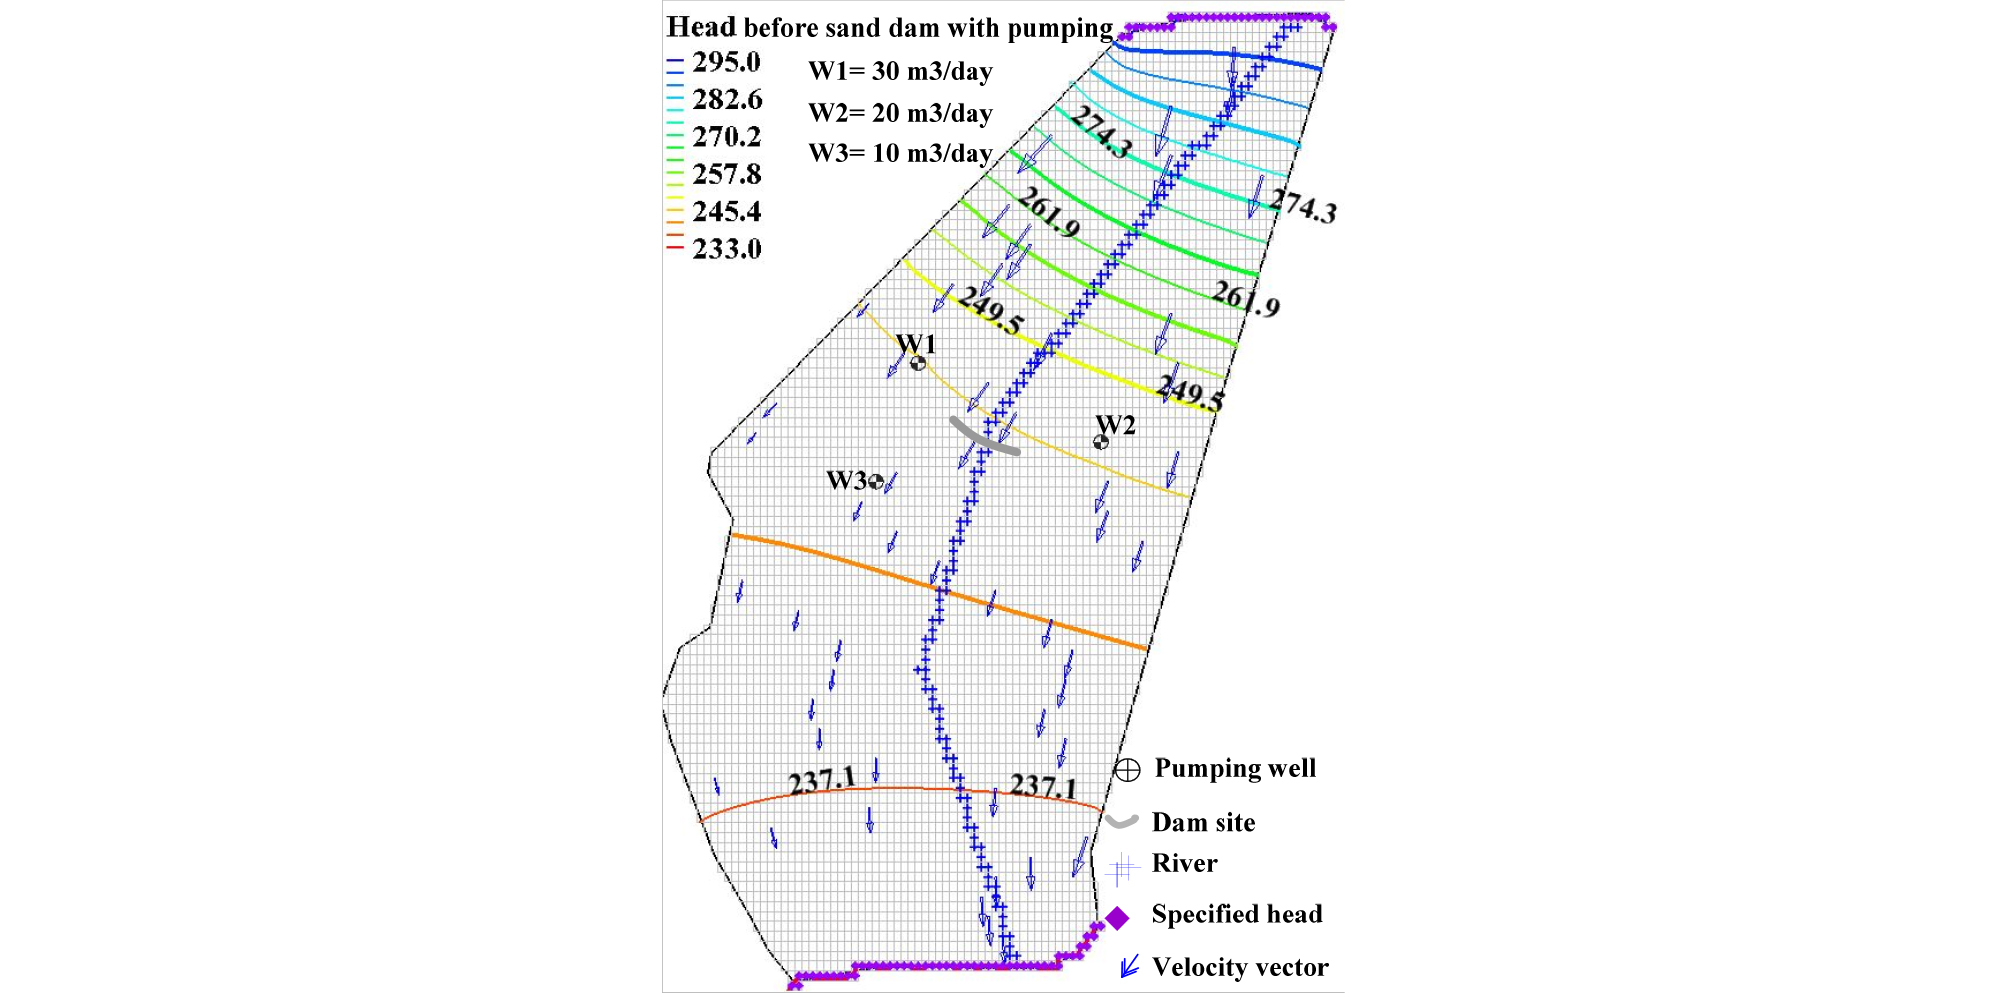
To understand the groundwater head in the study area before the construction of sand dam two models were built. The first model represents the site condition with no sand dam and no pumping wells. It was built to have a good background on the natural hydrological condition and use it as a base of comparison (as a reference). On the second model, three pumping wells with a pumping capacity of 10, 20, and 30 m3/day were included using the well package of MODFLOW. Two of the wells with the higher pumping capacity are placed on the upstream area of the proposed sand dam site, the other one at the downstream.
Results and Discussion
The model results are presented in Figs. 3 to 9. The presented results are the head contours of each scenario developed including the base scenario. The discussion is focused on the comparison of the head contours with the base scenario.
Without Sand Dam
The first scenario-the simulated groundwater flow head contours before the sand dam construction with no pumping is presented in Fig. 3. As can be seen from the figure, the head varies from 295 m to 233 m. The head variation follows the topography and has moderate variation from upstream to downstream in general. The head around the sand dam site is 253.8 m. However, the head change is sudden from the dam site to downstream of it. The reason is mainly the elevation change. As the flow vectors show, the flow is from north to south parallel to the river flow and the river and aquifer interaction is at limited places with a river leakage of 602.4 m3/day. At the upstream and downstream section of the model, the flow is to the river, around the dam site the flow is from the river to the aquifer.
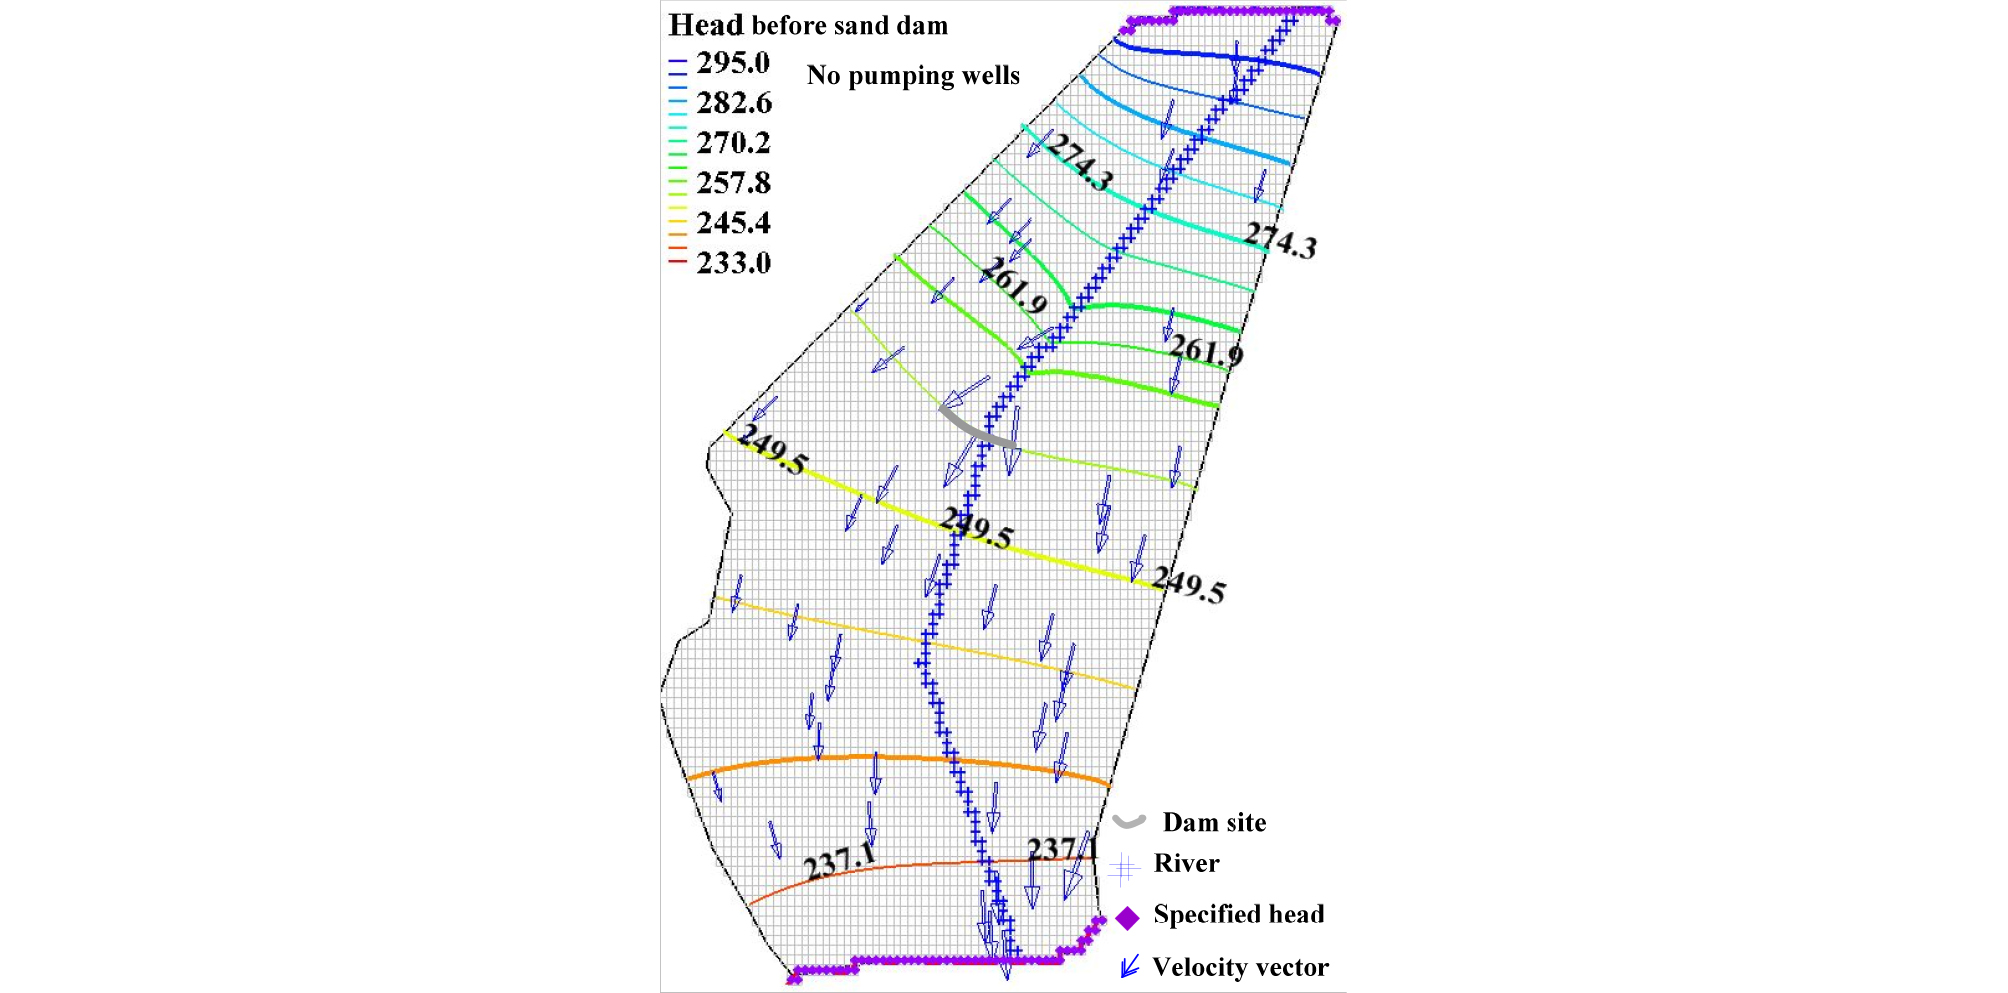
Fig. 4 shows the simulated groundwater potential of the second model-after the pumping wells are added. The head shows a substantial change; at the sand dam site, the head dropped to 245 m, which is eight meters less than the head before the pumping is applied. Especially downstream of the dam site the head dropped due to the pumping. The river linkage, in this case, is almost zero. From this, it can be inferred that groundwater potential is limited to abstract around 60 m3/day without affecting the groundwater level.
With Sand Dam
A sand dam height should be limited so that the water level and the maximum flood level will be not higher than the riverbank. The flood level is a serious case in the sand dam fixing process. If the flood level rises above the height of the riverbank after the construction of the sand dam, the area will be endangered from flood risk, erosion, and failure of the sand dam. The sand dam constructed in this study area has a height of three-meter at the wings and two-meter in the middle (spillway).
The third, fourth, and fifth models were after the sand dam construction-considering the increase in the water level of the river in the upstream area. The riverbed around the dam was also elevated due to the accumulation of sand and considered in the model and therefore, the head increase considered as constant head cells.
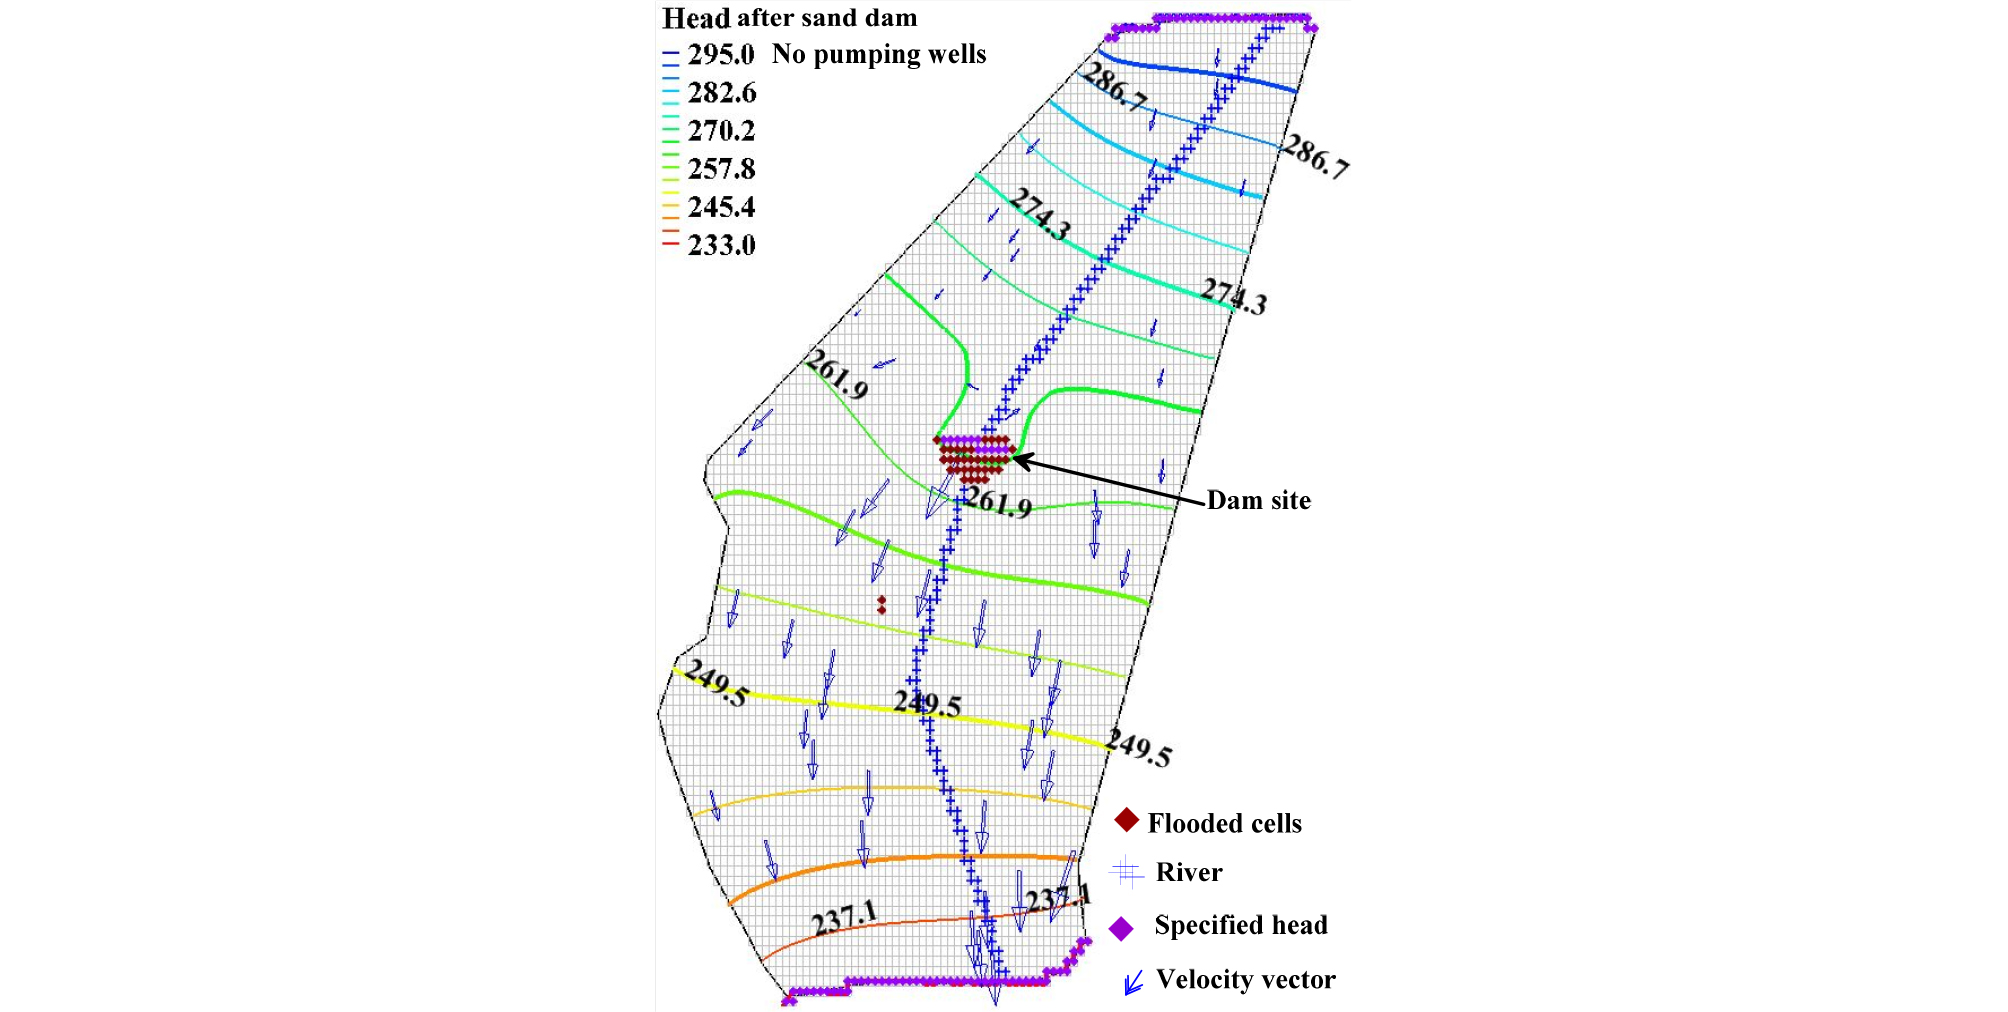
Fig. 5 shows the simulated groundwater head after the construction of a sand dam. Compared to the first case (Fig. 3) here the head shows significant change especially closer to the sand dam both in upstream and downstream of the dam. At the dam site, the head increased to 267.5 m. In the dam area and downstream of it, the model shows flooded cells. The river leakage is also reduced to 34.24 m3/day.
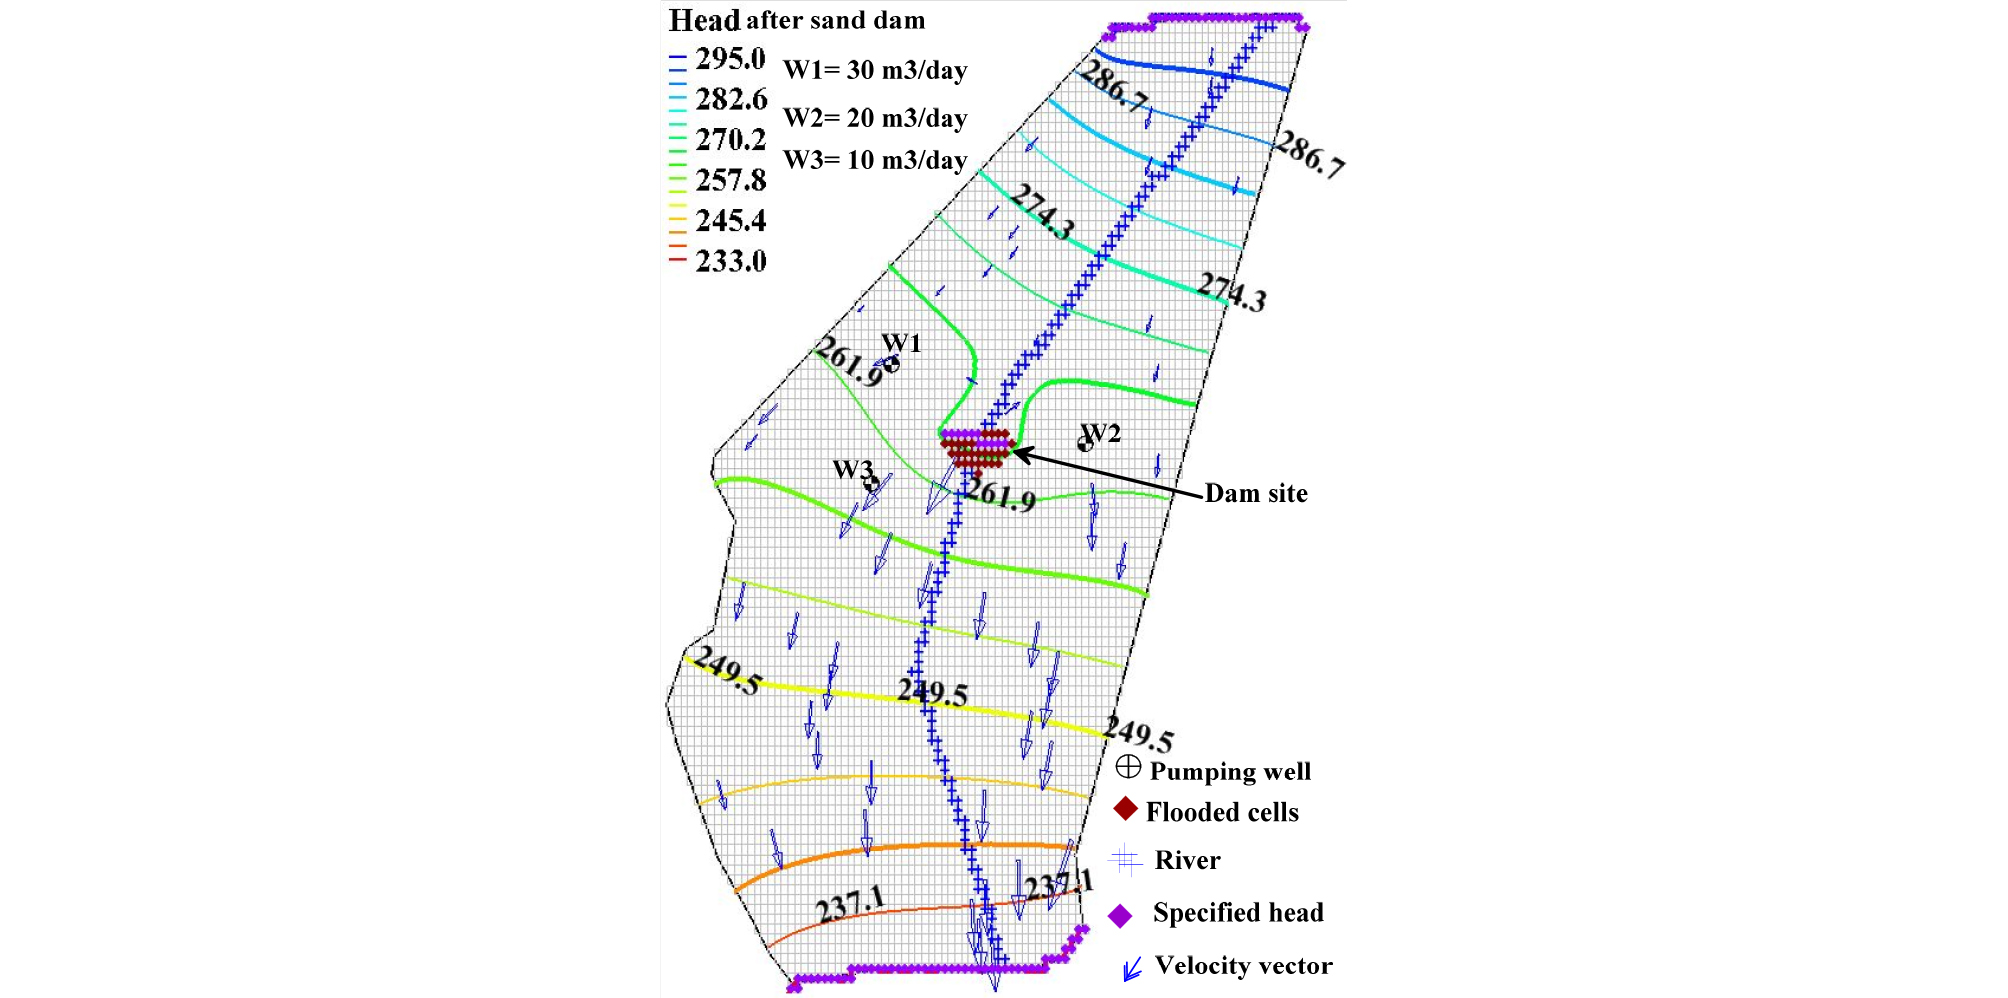
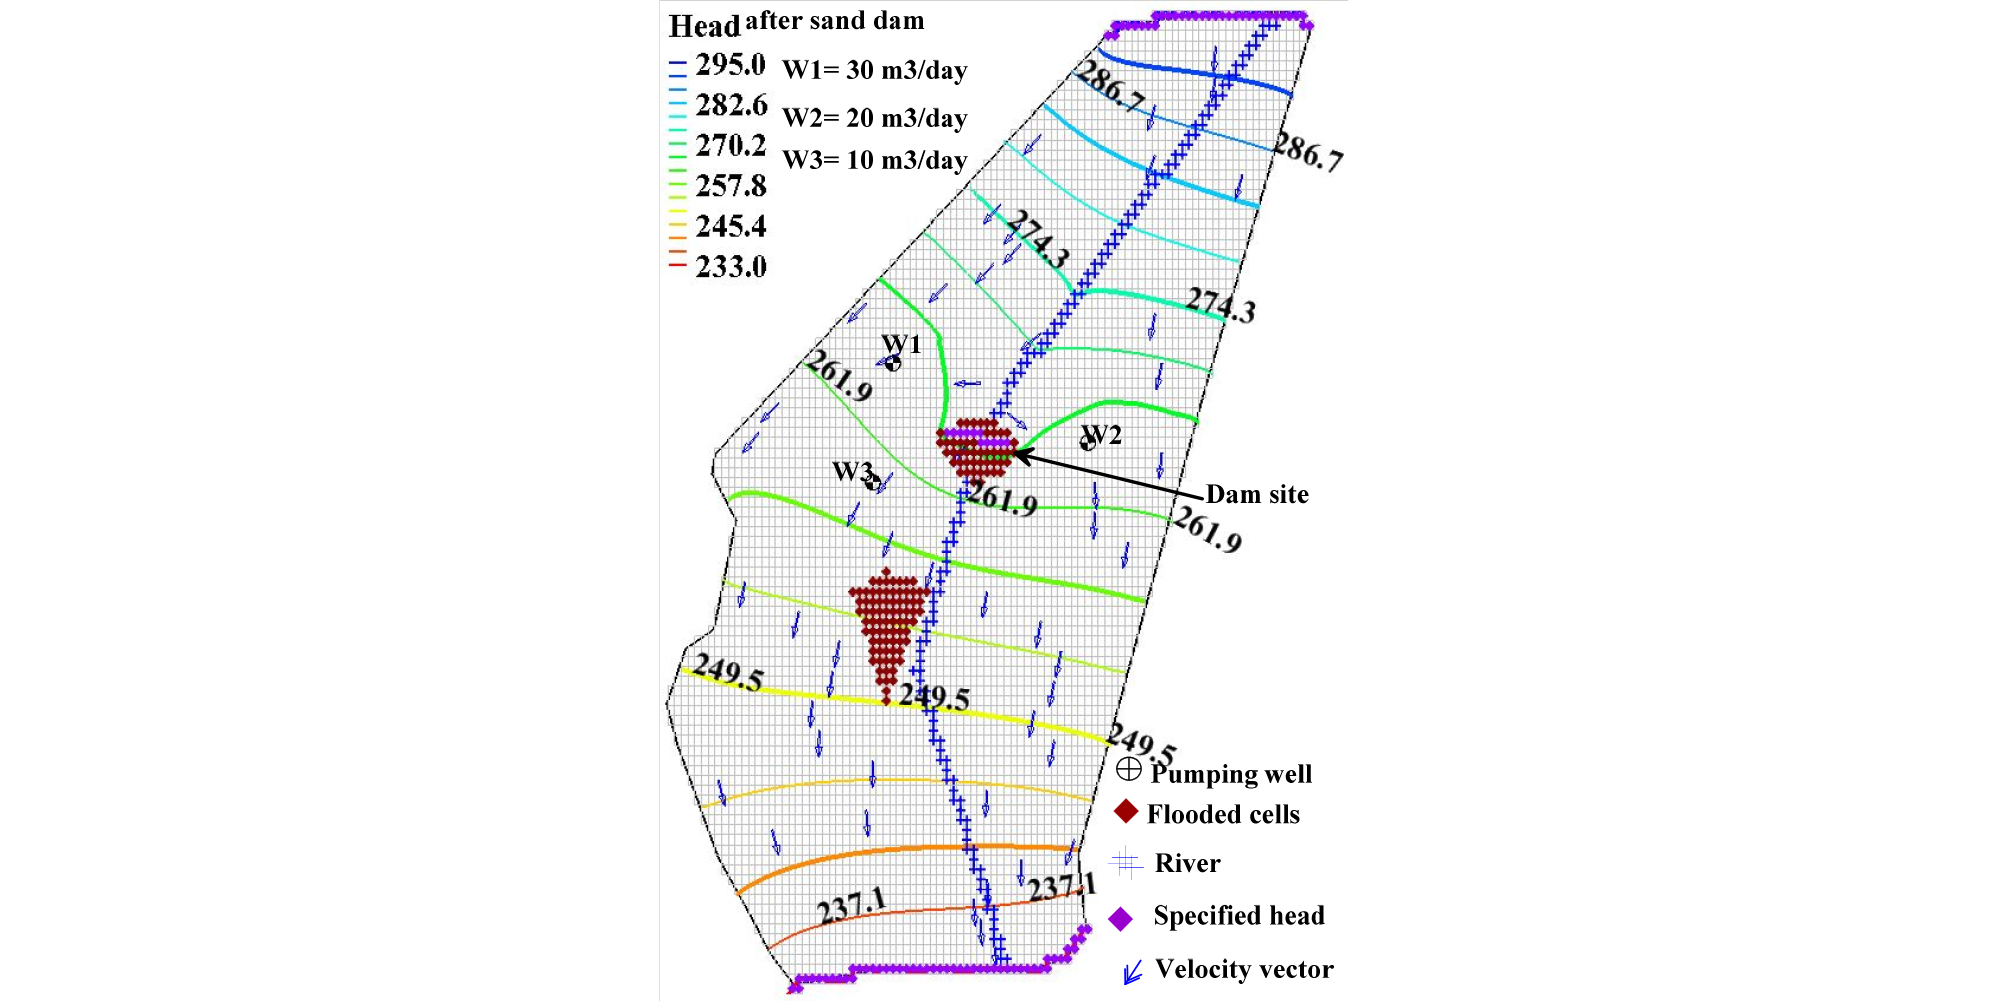
On the same model setup, the pumping wells are added into the model to see the effect of the abstraction on the groundwater level (Fig. 6). Compared to case two (Fig. 4) the effect of pumping wells on the groundwater head is not significant. The comparison of Figs. 5 and 6 shows also the groundwater head is almost the same. The head at the dam stayed the same as case three (sand dam no pumping wells). This implies that the effect of the sand dam on the increase of groundwater potential is significant and we can abstract water without affecting the aquifer. Moreover, in the dam area, the river shows a much higher water level than before the construction of the sand dam.
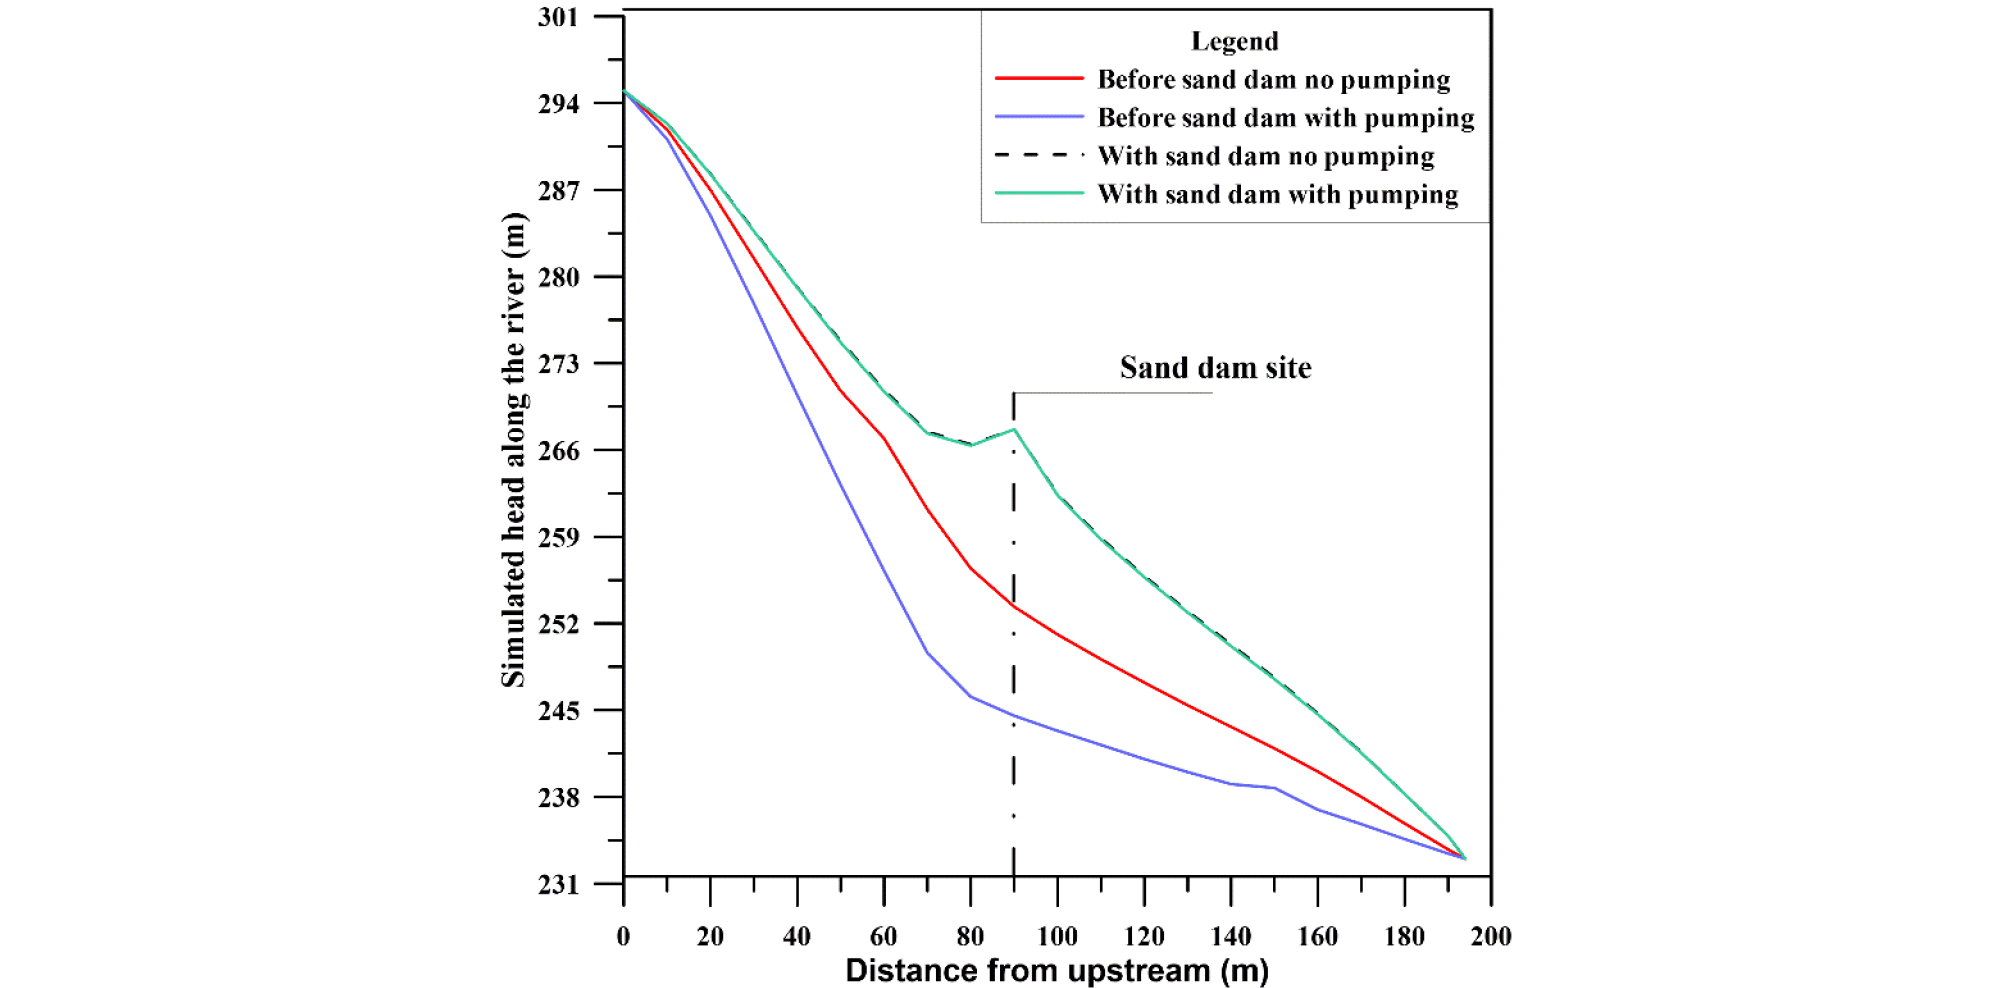
The first four cases are compared graphically with the simulated head along the river (Fig. 7). The head difference before the sand dam and after the sand dam is substantial, especially around the dam site.
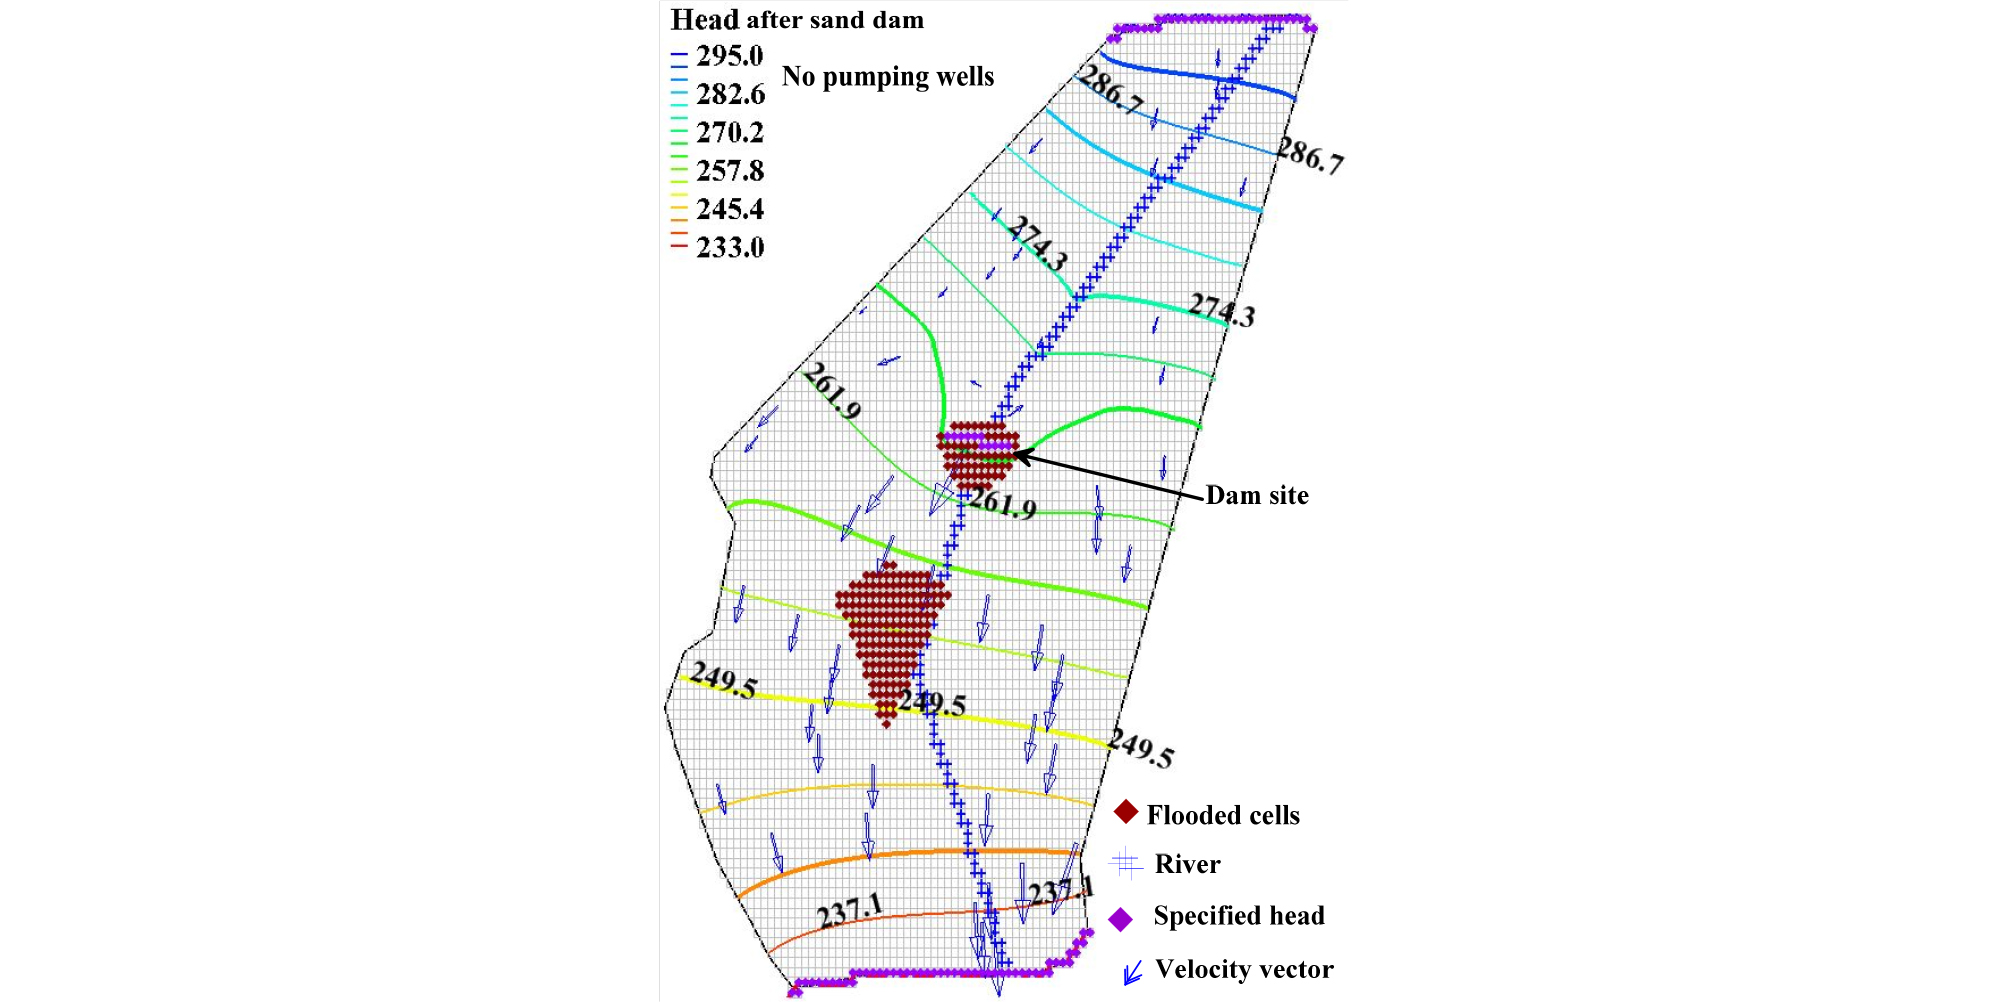
Several trials were performed to evaluate the effect of the material types on the effectiveness of the sand dam on the groundwater head. The sand type (material type in general) as Figs. 8 and 9 show the effect of the increase of hydraulic conductivity of the sand accumulated upstream of the sand dam. As the conductivity increase, the groundwater head shows a significant change, especially in the downstream area. In this model, the conductivity increased from 0.256 to 20 m/day to see the effect clearly and the result is as shown in the figure. The downstream area is flooded due to the increase in the head.
Summary and Conclusions
A sand dam has several advantages in the water harvesting process. In addition to storing water for later use, it gets the water filtered, protect from getting polluted, and minimize evaporation. Moreover, the environmental benefit of a sand dam is several folds. In this work, the influence of the sand dam on groundwater was tested using a numerical model-MODFLOW. Before the application of sand dam, the groundwater head in the area with pumping wells and without pumping wells was evaluated using models. Then the effect of the sand dam was evaluated both with and without pumping wells by comparing the head with the simulated head result before the sand dam application. The effect of material type accumulated upstream of the dam was also evaluated by varying the conductivity.
As the results show, the groundwater level increases substantially after the application of a sand dam. The comparison of model outputs, simulated groundwater head before and after sand dam application with and without pumping well, shows a clear head difference. The material type has also an effect on the groundwater head. As the conductivity of the material increases, the head, especially at the downstream, showed a significant increase. After the construction of the sand dam, the groundwater level is not affected much. In this study, groundwater level after the construction of a sand dam with pumping wells and without pumping wells is the same.
In this work, the hydraulic conductivity, river conductance, and other important flow parameters are obtained by trial and error. The material type accumulated upstream of the dam helps to increase the reliability of the model results. This preliminary work can be improved with further hydrogeological investigations and calibration of the simulation with measured groundwater head in the area.
