

Introduction
Geology
The Status of the Slope and Slope Geology
Surface Geology
Stability Analysis
Discontinuity Properties
Geological Cross-Section
Rock Test
Estimation of the Strength Parameter
Stability Review
Stereonet Projection Analysis
Limit Equilibrium Analysis
Countermeasure Method
Discussion
Conclusions
Introduction
A large number of research results have been published due to various research methodologies and the expansion of research targets on slope stability analysis and excellent papers have been published using the latest equipment and innovative ideas. Some of those papers are a study by modifying a planar failure condition of rock slope in Korea where slope collapses frequently occur even with a condition of more than 20 degrees of the strike of the slope face although the most frequent planar failure condition among the slope failure conditions is that the strike of the planar discontinuity must be within 20 degrees of the strike of the slope face (Hwang, 2002), a study that proposes various types of failures due to intersection such as joint, foliation, and bedding within the cut slope (Cheong and Choi, 2009a), a study that can predict a failure time of unstable slope and evaluate the collapse risk through the global positioning system displacement measurement of the slope in the open-pit coal mine (Sunwoo et al., 2010) and a study that applies the fact that a collapse occurs in a section whose risk score is high using around 10,000 records of cut slope data near national highways in the cut slope management (Kim et al., 2012b).
There have also been studies on water (precipitation, groundwater, etc.) that affects the stability of slopes the most; a study that proposes that rainfall intensity is more influential on the slope stability than cumulative rainfalls (Lee and Kim, 2009), a study that proposes that the slope safety factor is rapidly reduced when the wetting front drops and groundwater level rises at the same time in a landslide event (Song and Hong, 2011), and a study that found the decrement of safety factors after precipitation exceeds the decrement of safety factor during the duration of precipitation through the cut slope infiltration analysis (Lee et al., 2012), and a study that demonstrates that it is possible to understand changes in the factor of safety for an infinite slope according to the rainfall infiltration velocity inside the soil (Chae et al., 2012).
There are also various study results that geological properties affect the analysis of slope stability; a study that if a weak layer and geological structures such as folds and faults are developed in a slope, a geological structure must be considered (Koo et al., 2003), a case study that the cause of cut slope failure was due to the cut slope consisting of mainly volcanic rocks, minor faults, mafic dyke, a presence of geological weak zones, and high soil contents of swelling clay (Kim et al., 2011), a case study that the geological structure in sedimentary rocks affects the stability of cut slope (Ko et al., 2012), and a case study on stability review when a cut slope was mainly composed of granite (Kim et al., 2012a).
Furthermore, there have been several studies on stability review through probabilistic analysis and modeling of cut slopes; a study on the effects of clay vein on slope stability that silty and generic soils affected the slope safety factor more than sandy soils through numerical modeling (Jo et al., 2010), a study on probability analysis of rock slope stability using discontinuity persistence as parameters (Jang et al., 2010), a study on probabilistic stability and sensitivity analysis for a failed rock slope using a Monte Carlo simulation whose analysis reliability was better than that using deterministic method (Park and Park, 2010), a study that the probabilistic analysis method can reduce the effect of uncertainty involved in input parameters when analyzing the landslide stability (Jeong et al., 2011), and a study that presents a model that can predict a possible collapse time of cut slope using an exponential equation (Oak et al., 2013).
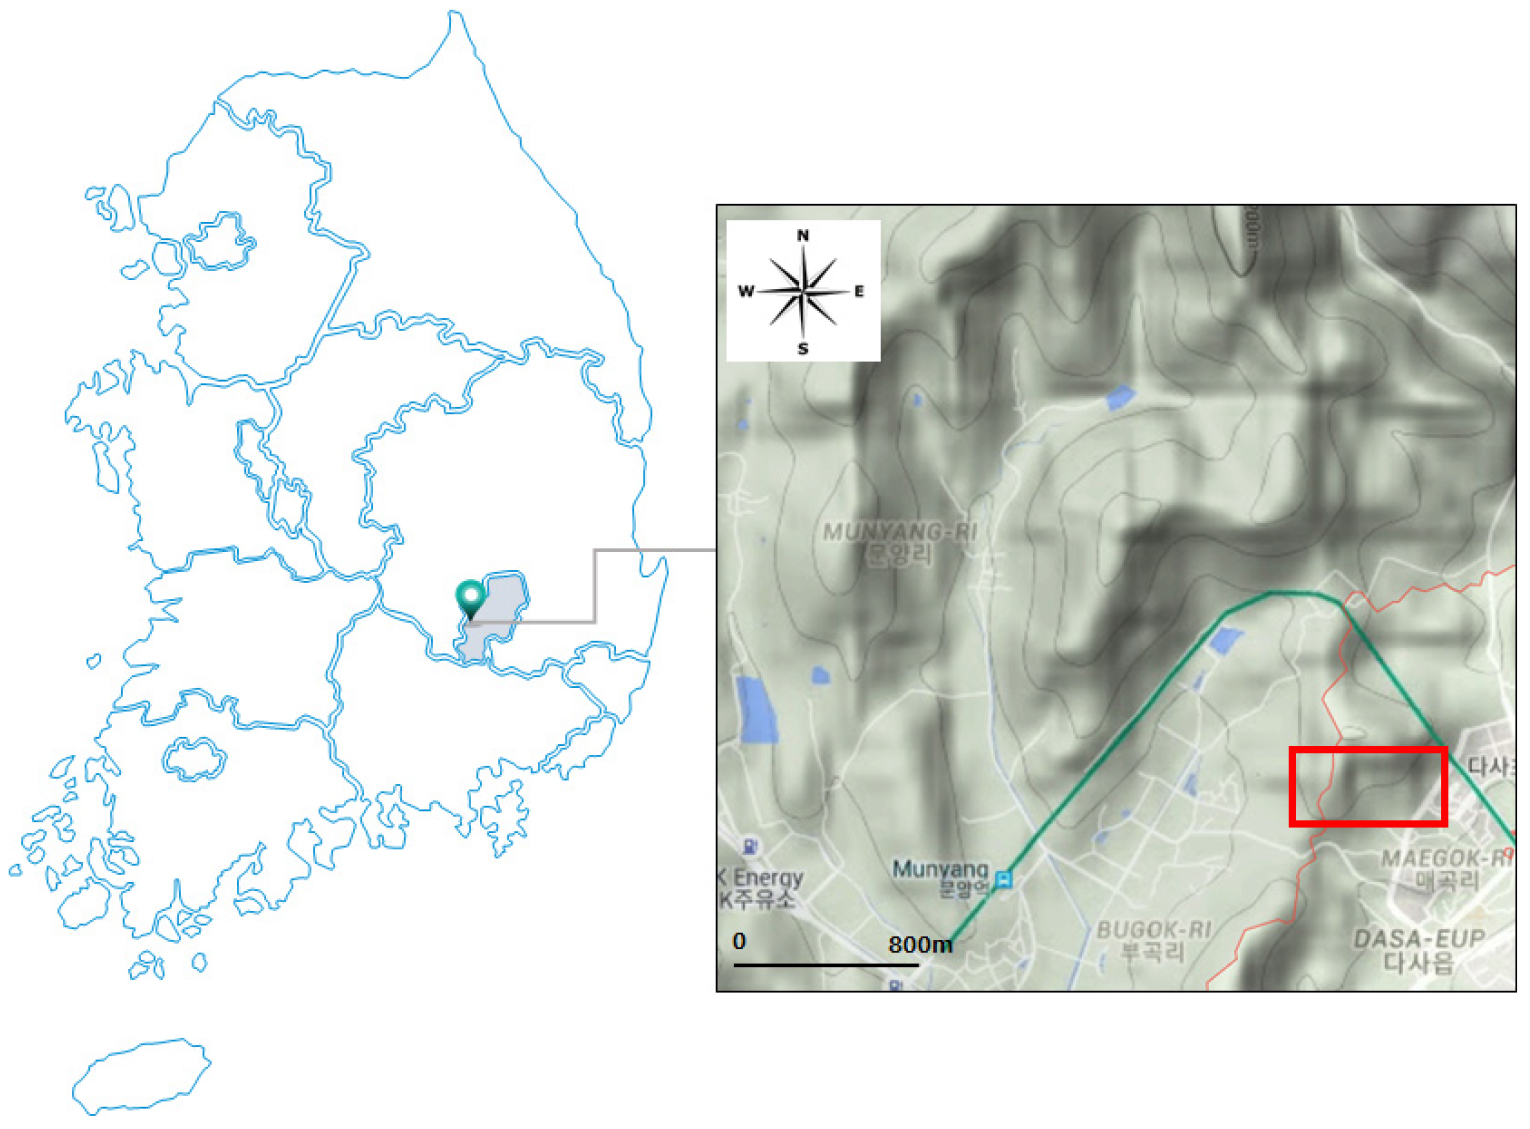
However, it is desirable to propose a slope face-mapping data and cross-sectional data in various cut sections perpendicular to the slope when surveying and analyzing a slope face and establishing a measure based on three-dimensional (3D), as well as stability analysis and countermeasure method based on the data. It is difficult to prepare a geological cross-section based on slope face mapping data. Thus, few studies have been conducted on stability review using a systematic geological cross-section in recent years (Ihm, 2021). Thus, the purpose is to present the superiority of the slope stability analysis method using the geological cross sections, targeting a sedimentary rock slope in the Cretaceous Gyeongsang Supergroup, which has a possible failure risk because public structures are built near a sedimentary rock cut slope (Fig. 1) located in Maegok-ri, Dalseo-gu, Daegu and close to the downtown.
Geology
The Status of the Slope and Slope Geology
The soil layer whose thickness at the top of the slope is around 0.3 m is composed of well-graded yellowish brown sand with clay (SC) (Park and Ihm, 1997, 1998), and the rock layer underneath the soil layer is composed of dacite that is partly penetrated to the sedimentary rock consisting of mainly sandstone and siltstone and intercalated shale. The total length and height of the slope in the study area are around 170 m and 27.35 m, and the gradient is nearly vertical (85~90°) (Fig. 2a). In addition, the slope face is not just a generally straight shape but the slope face strike is characterized with changing from N56°W to N34°E according to sections, and then back to N56°W.
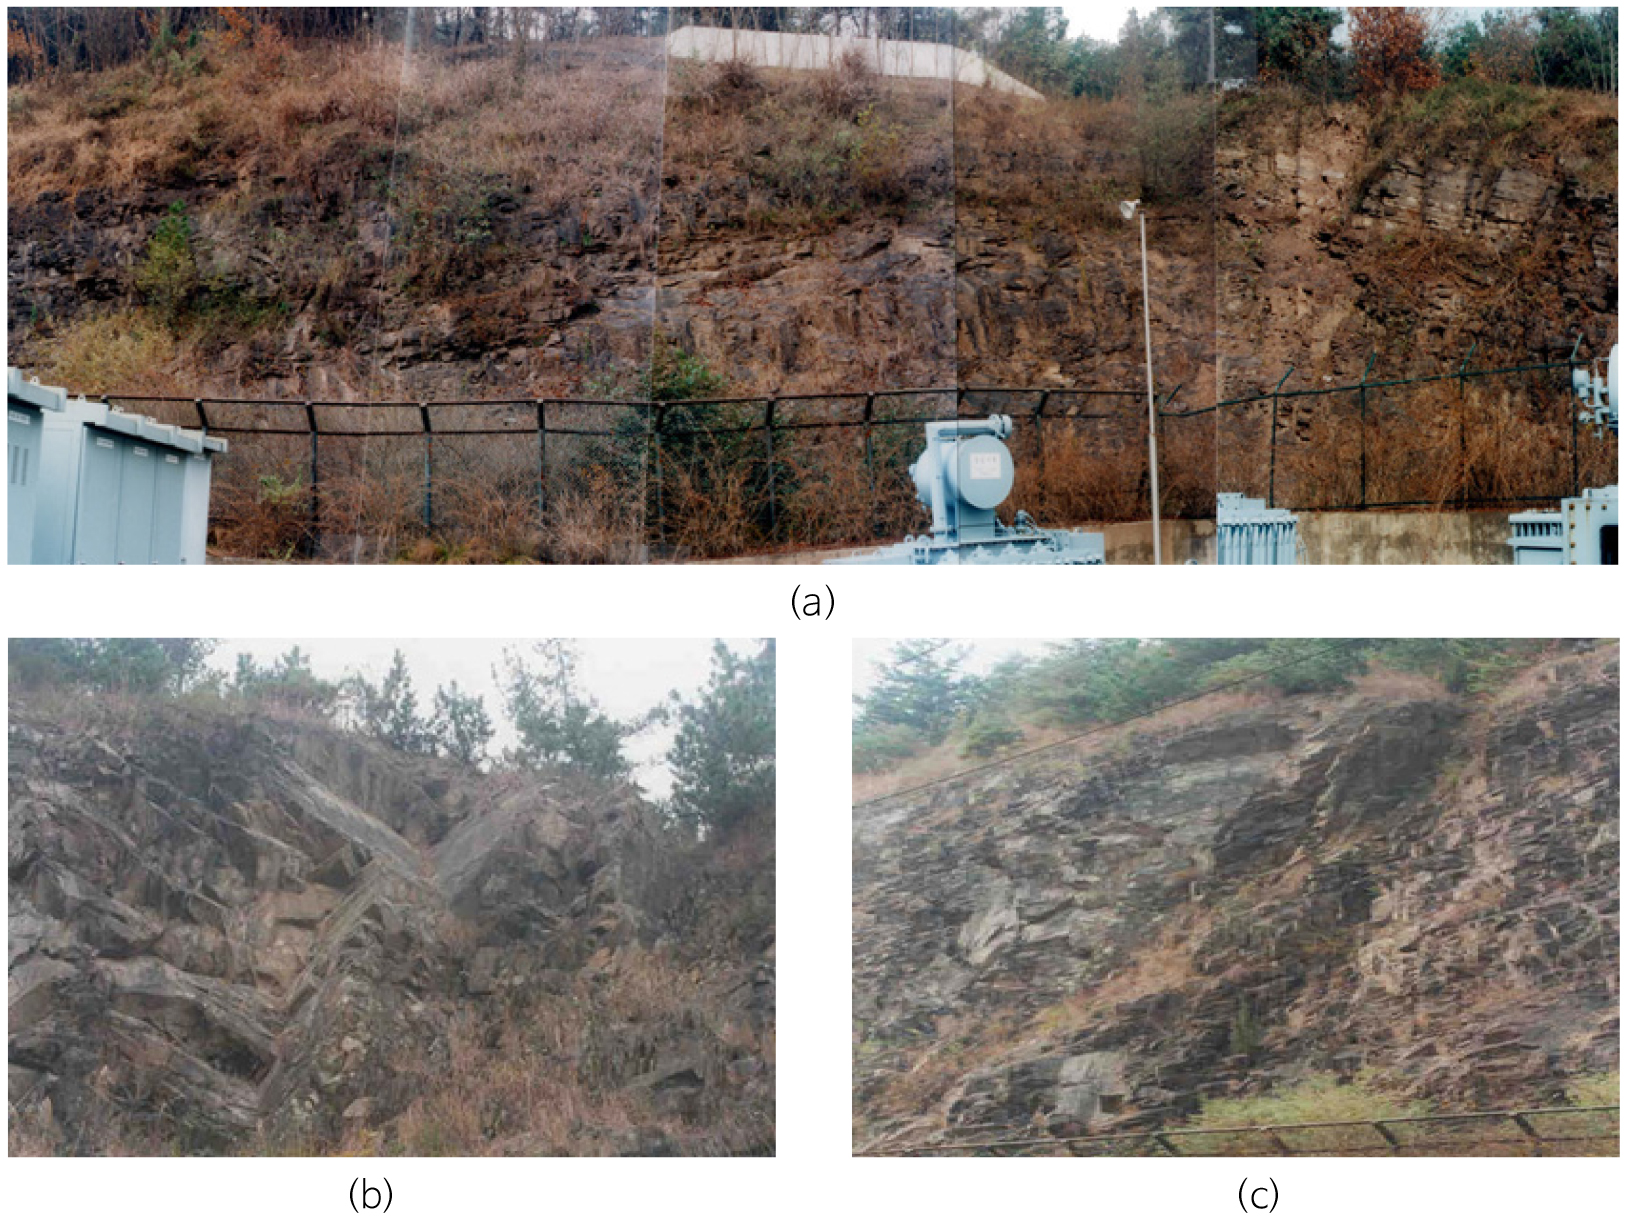
The bedding plane is well developed in the rock layer of the slope, which is the feature of sediment rock, and partially penetrated by two dacite dykes. Several wedge failures (Fig. 2b) occurred according to the shear joint surface in the rock body whose volume was around 2~3 m3 (Fig. 3) at STA. No. 6~8 and plane failures occurred along the contact surface of the dacite veins penetrated at STA. No. 6~7 in the slope (Fig. 2c). Furthermore, the rock body whose volume was around 0.002~0.003 m3 showed toppling failures and a small scale of rockfall in the upper and middle ends of the whole slope section (Fig. 3). The weathered condition of the rock was good but the clay mineral embedded in the stratified and intrusive contact surfaces of shale showed a very fast weathering rate.
The type of discontinuity surface inside the rock can be divided into bedding, shear joint, and intrusive contact and tension joint. The tension joint developed in the upper end of the slope played the role as the main fracture planes in STA. No. 1~4, the shear joint in STA. No. 4~6, the intrusive contact and shear joint in STA. No. 6~10, and bedding and shear joint in STA. No. 11~14. The rock properties in each section inside the slope are presented in Table 1. Fig. 2a shows the photo of the slope and Fig. 3 shows the geologic front-view map that displays the rock composition in the slope, discontinuity type, orientation, spacing, and persistence.
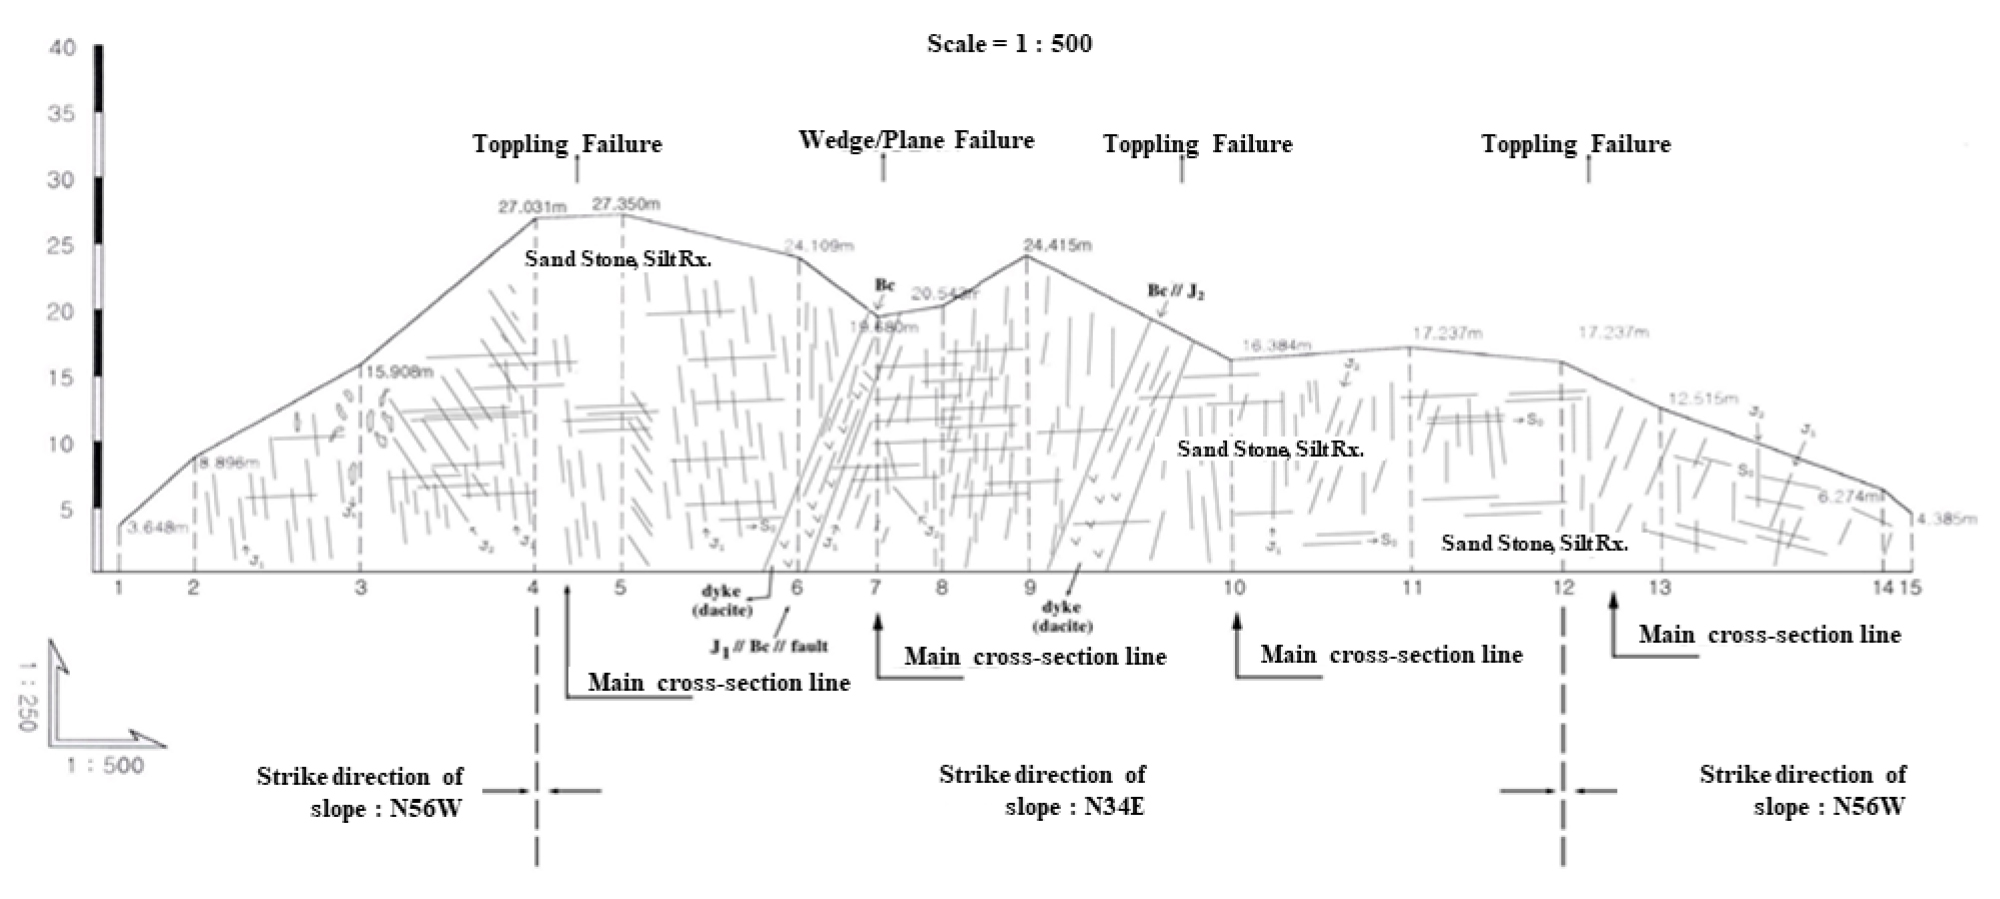
Table 1.
Characteristics of rocks and their discontinuity on the slope
| STA. | Rock type |
Classification of discontinuity | Spacing | Persistence |
Main discontinuity | Failure type |
Risk ranking | Strike slope1) | Remarks |
| No. 1~2 | - | - | - | - | - | - | 14 | N56W | Soil |
| No. 2~3 | Sandstone |
Bedding extension joimt | 50 cm | 100 cm | Extension joimt | - | 12 | N56W | Rock |
| No. 3~4 |
Sandstone Siltstone |
Bedding extension joimt shear joint | 13 cm | 100 cm | Shear joint | Toppling | 5 | N56W | Rock |
| No. 4~5 |
Sandstone Siltstone |
Bedding shear joint | 10 cm | 150 cm | Shear joint | Toppling | 4 | N34E |
Inflow groundwater |
| No. 5~6 |
Dacite Sandstone |
Bedding shear joint | 45 cm | 100 cm | Shear joint | Toppling | 7 | N34E | Rock |
| No. 6~7 |
Dacite Sandstone |
Bedding shear joint contact dyke | 580 cm | - | Contact dyke | Plane | 2 | N34E | Rock |
| No. 7~8 | Sandstone |
Bedding shear joint | 31.8 cm | 50 cm | Shear joint |
Wedge toppling | 3 | N34E | Rock |
| No. 8~9 | Sandstone |
Bedding shear joint | 22 cm | 80 cm | Shear joint | Toppling | 6 | N34E | Rock |
| No. 9~10 |
Dacite Sandstone |
Bedding shear joint contact dyke | 550 cm | - | Contact dyke | Plane | 1 | N34E | Rock |
| No. 10~11 | Sandstone |
Bedding shear joint | 11.8 cm | 100 cm | Shear joint | Toppling | 8 | N34E | Rock |
| No. 11~12 | Sandstone | Bedding | 37 cm | - | Bedding | - | 10 | N34E | Rock |
| No. 12~13 | Sandstone |
Bedding shear joint | 8.3 cm | 35 cm | Shear joint | Toppling | 9 | N56W | Rock |
| No. 13~14 |
Sandstone Siltstone |
Bedding shear joint | 20 cm | - | Bedding | - | 11 | N56W | Rock |
| No. 14~15 | Sandstone | Bedding | 20 cm | - | Bedding | - | 13 | N56W | Soil |
Surface Geology
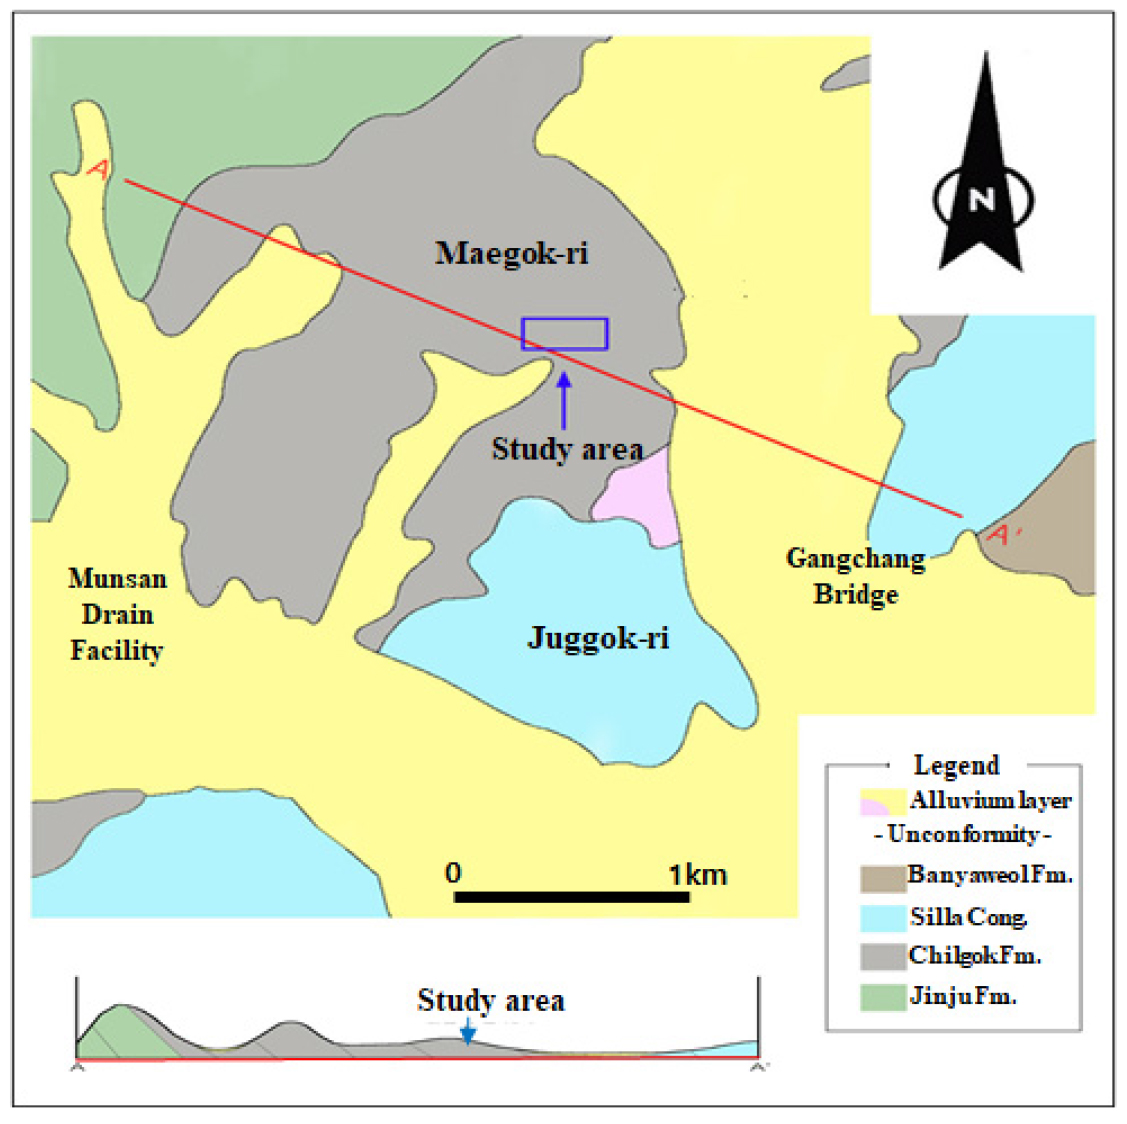
The rock in the study area was non-marine sediment rock that belonged to the Gyeongsang Supergroup, the Hayang Formation, and the Chilgok Formation deposited in the Cretaceous period of the Mesozoic age (GSK, 1928a, 1928b), and was red in color, which indicated it was formed under an oxidizing environment (Fig. 4). Two intermediate dacites, which were penetrated along the discontinuity surface at a later stage by making the sediment rock as parent rock, were penetrated and distributed several meters wide (Fig. 3).
The bedding plane of red shale, sandstone, and siltstone where the bedding was well developed as a unique feature of sediment rock, was relatively smooth and the bedding plane was highly persistent. Furthermore, the bedding spacing was less than 1 mm, which was very small compared to that of other discontinuity surfaces. However, the spacing was relatively large in partially weathered places (STA. No. 8~12, Table 1).
The shear joint was well persistent, but the spacing was very wide and cracks were rarely found. Several shear joints were partially but clearly developed in the entire slope. The crack of the tension joint was very wide because it was formed due to the maximum principal stress in the perpendicular direction. However, the persistence was bad so that a small scale of rock overturning or fall pattern was revealed in the upper end of the slope (STA. No. 2~4, Table 1).
Stability Analysis
Discontinuity Properties
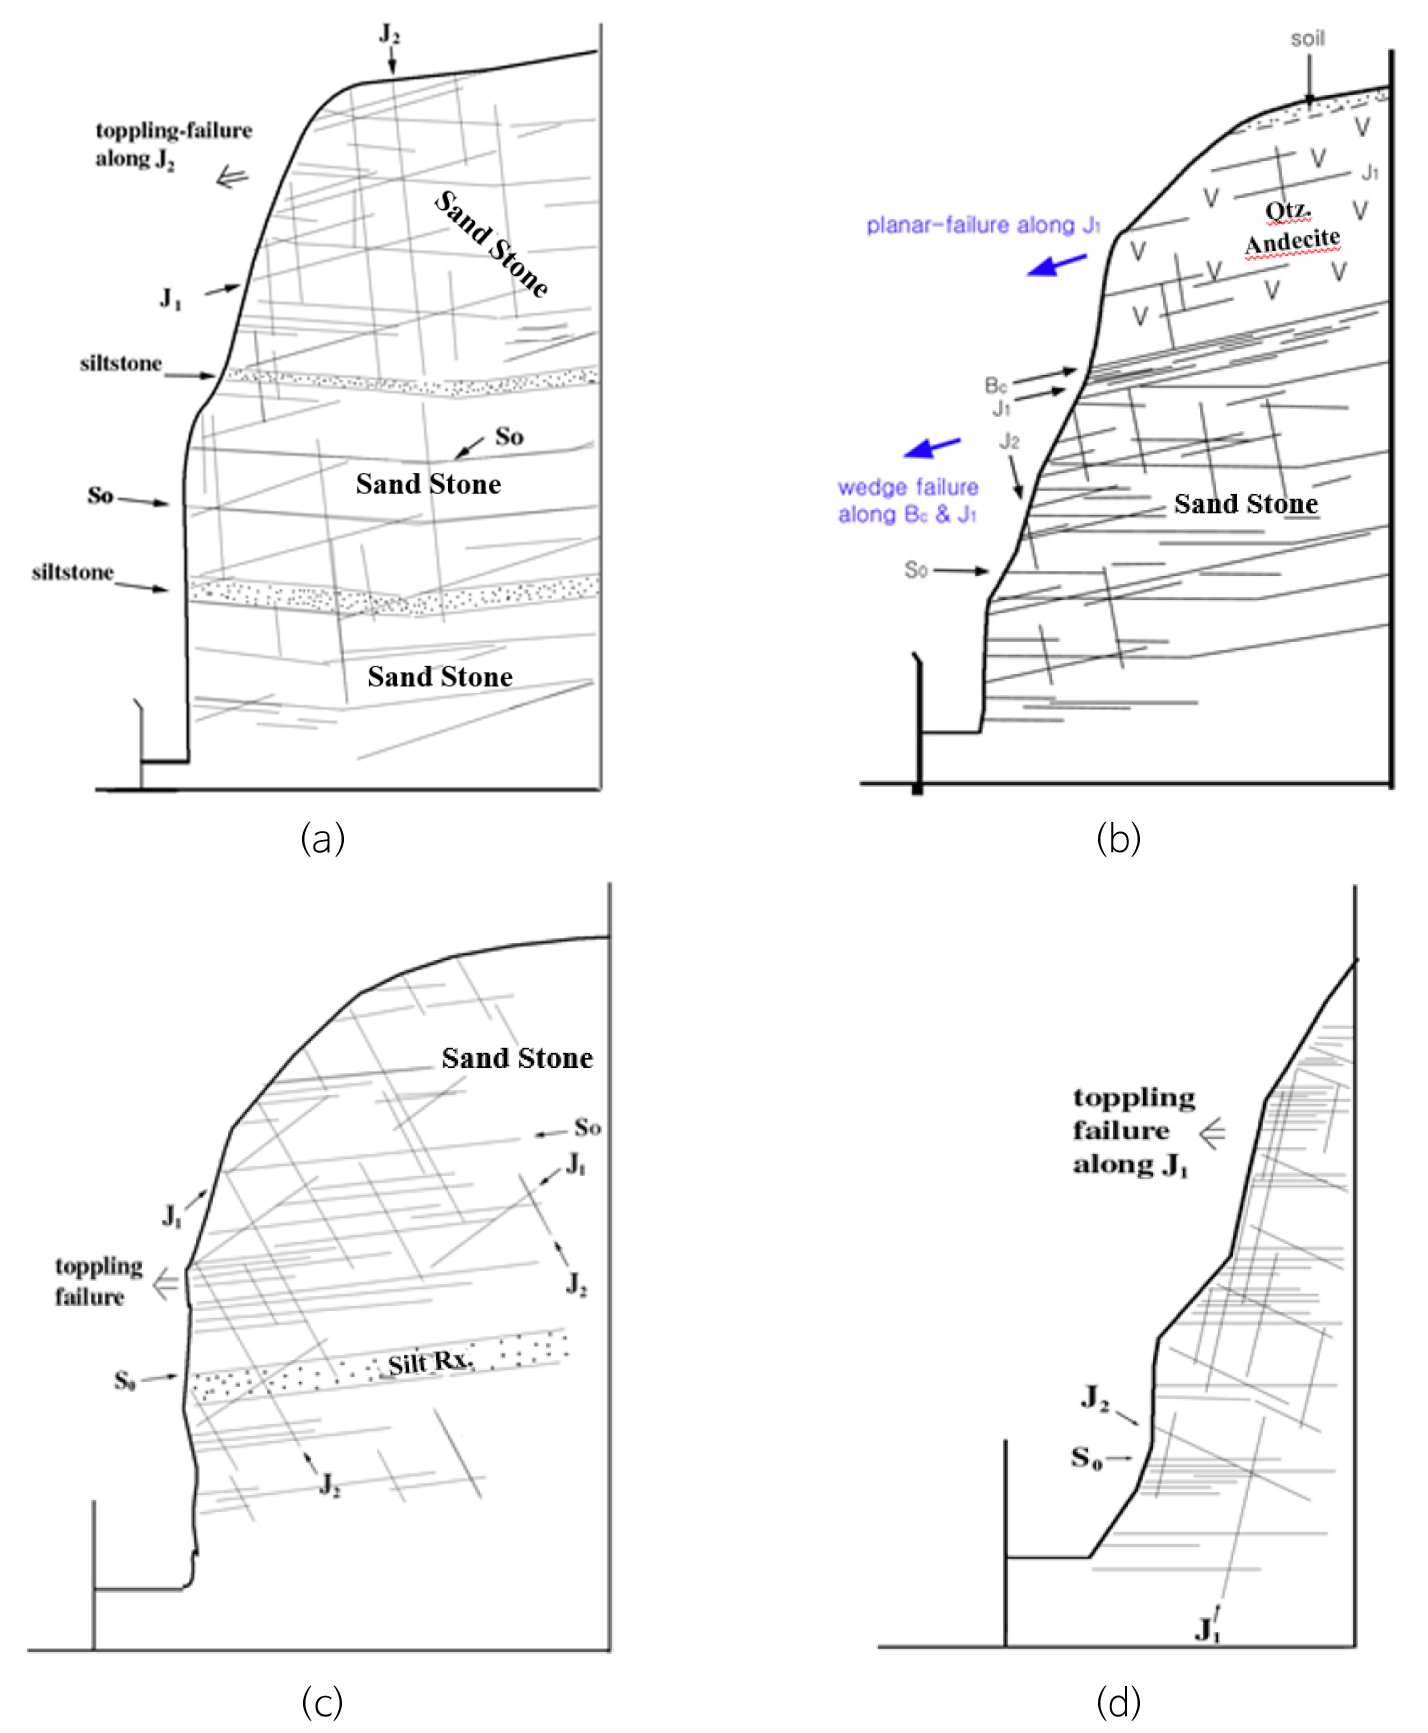
To display the characteristics of the discontinuity developed in the slope, their types, orientation, spacing, persistence, groundwater status, filling and crack. were face-mapped, which are presented in Table 2. The geological cross-sectional view for the represented four sections perpendicular to the slope was created and used as the basic drawings to review the stability of the cross-section in STA. No. 4, STA. No. 7, STA. No. 10, and STA. No. 12 as shown in Fig. 5.
Table 2.
Data of face-mapping for discontinuities on the slope
Geological Cross-Section
Based on the face-mapping data perpendicular to the slope (Fig. 3) and face-mapping data at the surrounding rock outcrop, four representative cross-sections were selected to represent the slope focusing on the most vulnerable section or already failure occurred sections. The geological cross-sectional view for each representative cross-section was prepared by assuming that the characteristics of the discontinuity measured at the slope and outcrop (Table 2) are similarly distributed in the geologic cross-section perpendicular to the slope.
The analysis result of the geologic cross-section in Sta. No. 4 showed that the toppling failure occurred along the high-angle joint (Fig. 5a) and the toppling failure also partially occurred in the slope. As shown in Fig. 5b, the analysis result of the geological cross-sectional view in Sta. No. 7 showed that a plane failure occurred along the low-angle joint as well as a wedge failure occurred in the rock block where the intrusive contact of dacite dykes and low-angle joint were met.
The analysis result of the geologic cross-section in Sta. No. 10 showed that the toppling failure occurred along the high-angle joint, which was the opposite slope direction, (Fig. 5c) and the toppling failure also frequently occurred in the slope. In addition, as shown in Fig. 5d, the analysis result of the geological cross-sectional view in Sta. No. 12 exhibited that a toppling failure was likely to occur along the high-angle joint.
Rock Test
The physical properties and mechanical tests of eights rocks collected in the representative locations (Fig. 6) inside the slope that reflected the rock type and discontinuity characteristics were conducted. The test items were specific gravity, water content ratio, absorption rate, wet unit volume weight in the physical test, and uniaxial compression and point load strength tests. The results are summarized in Table 3.
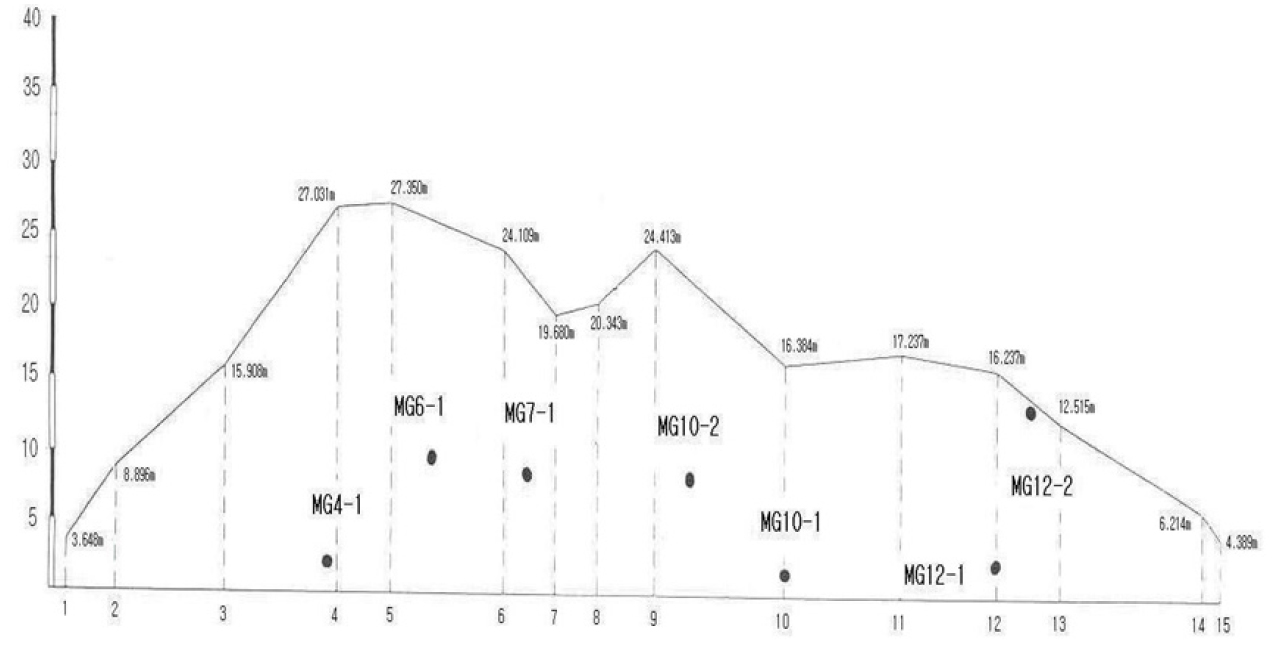
Table 3.
The result of physical property and mechanics test for rock samples on the slope
Estimation of the Strength Parameter
To analyze and review the stability of the slope face, a reasonable value was calculated by referring to the face mapping at the surrounding rock outcrop and the slope, preparation of systematic geological cross-sectional views, rock engineering classification (Slope Mass Rating, SMR), physical properties and mechanical tests of the rock, stereonet projection analysis in the discontinuity, local application cases, and related literature, and then in-situ ground and countermeasure method were applied for each representative cross-section of the slope. After this, the limit equilibrium analysis at the dry and wet periods for the ground was conducted.
There are many ways to divide rocks by grade but for slopes, the SMR classification method is useful. Thus, SMR classification values for each section of the slope are contained in detail in Table 4 by summarizing the face mapping results at the slope and surrounding rock outcrop and rock’s physical property test results. The calculated results had good SMR to very poor SMR rocks. However, very poor rock rating was calculated in many representative cross-sections where the prior failure occurred, which belonged to poor rocks on average (Table 4).
Table 4.
The result of SMR on the slope
| STA. | Spacing |
Persis tence |
Main discontinuity |
Failure type |
Compressional strength (kgf/cm2) | Roughness |
Ground water |
Angle between slope-face and discontinuity | Score1) | Rating2) |
| No. 1~2 | 30 cm | - | Bedding | - | 250~500 | Slickenside | Dry | Oblique | 32 | III |
| No. 2~3 | 50 cm | 100 cm | Extension joint | - | 500~1,000 | Rough | Dry | Oblique | 45 | II |
| No. 3~4 | 13 cm | 100 cm | Shear joint | Toppling | 500~1,000 | Planar | Dry | Subparallel | 8 | V |
| No. 4~5 | 10 cm | 150 cm | Shear joint | Toppling | 500~1,000 | Planar | Dry | Subparallel | -3 | V |
| No. 5~6 | 45 cm | 100 cm | Shear joint | Toppling | 500~1,000 | Planar | Dry | Oblique | 40 | II |
| No. 6~7 | 580 cm | - | Contact dyke | Planar | 500~1,000 | Slickenside | Dry | Parallel | 2 | V |
| No. 7~8 | 31.8 cm | 50 cm | Shear joint | Wedge oppling | 250~500 | Slickenside | Dry | Subparallel | 7 | V |
| No. 8~9 | 22 cm | 80 cm | Shear joint | Toppling | 250~500 | Planar | Dry | Oblique | 27 | III |
| No. 9~10 | 550 cm | - | Contact dyke | Planar | 500~1,000 | Slickenside | Dry | Parallel | 2 | V |
| No. 10~11 | 11.8 cm | 100 cm | Shear joint | Toppling | 250~500 | Rough | Dry | Oblique | 35 | III |
| No. 11~12 | 37 cm | - | Bedding | - | 250~500 | Planar | Dry | Oblique | 37 | II |
| No. 12~13 | 8.3 cm | 35 cm | Shear joint | Toppling | 250~500 | Planar | Dry | Subparallel | 10 | V |
| No. 13~14 | 20 cm | - | Bedding | - | 250~500 | Slickenside | Dry | Oblique | 32 | III |
| No. 14~15 | 20 cm | - | Bedding | - | 50~250 | Planar | Dry | Oblique | 30 | III |
Because cohesion (c) is considered in the stability analysis of the rock slope, stability is interpreted much more conservatively than the actual value. Thus, a nearly constant 4.0 t/m2 value was applied, and for value, value was applied in the analysis considering the unconfined compression strength obtained in the point load strength test and rock status in the field because the strength may vary depending on the discontinuity condition in the field, insulation, and discontinuity spacing, weathering degree, and roughness, etc.
Thus, the internal friction angle was set to a range of 33~35° based on the evaluation value calculated by rock-quality designation (RQD) for the SMR value and face-mapping result, literature data, and indoor test data of absorption rate, uniaxial compression test, and point load strength test to analyze the stability of the slope. In STA. No. 4, cohesion and internal friction angle were set to 5 t/m2 and 35° and in other sections, cohesion and internal friction angle were set to 4 t/m2 and 33°. Table 5 presents the strength applied to the rock of the slope for the review of the slope stability.
Stability Review
Stereonet Projection Analysis
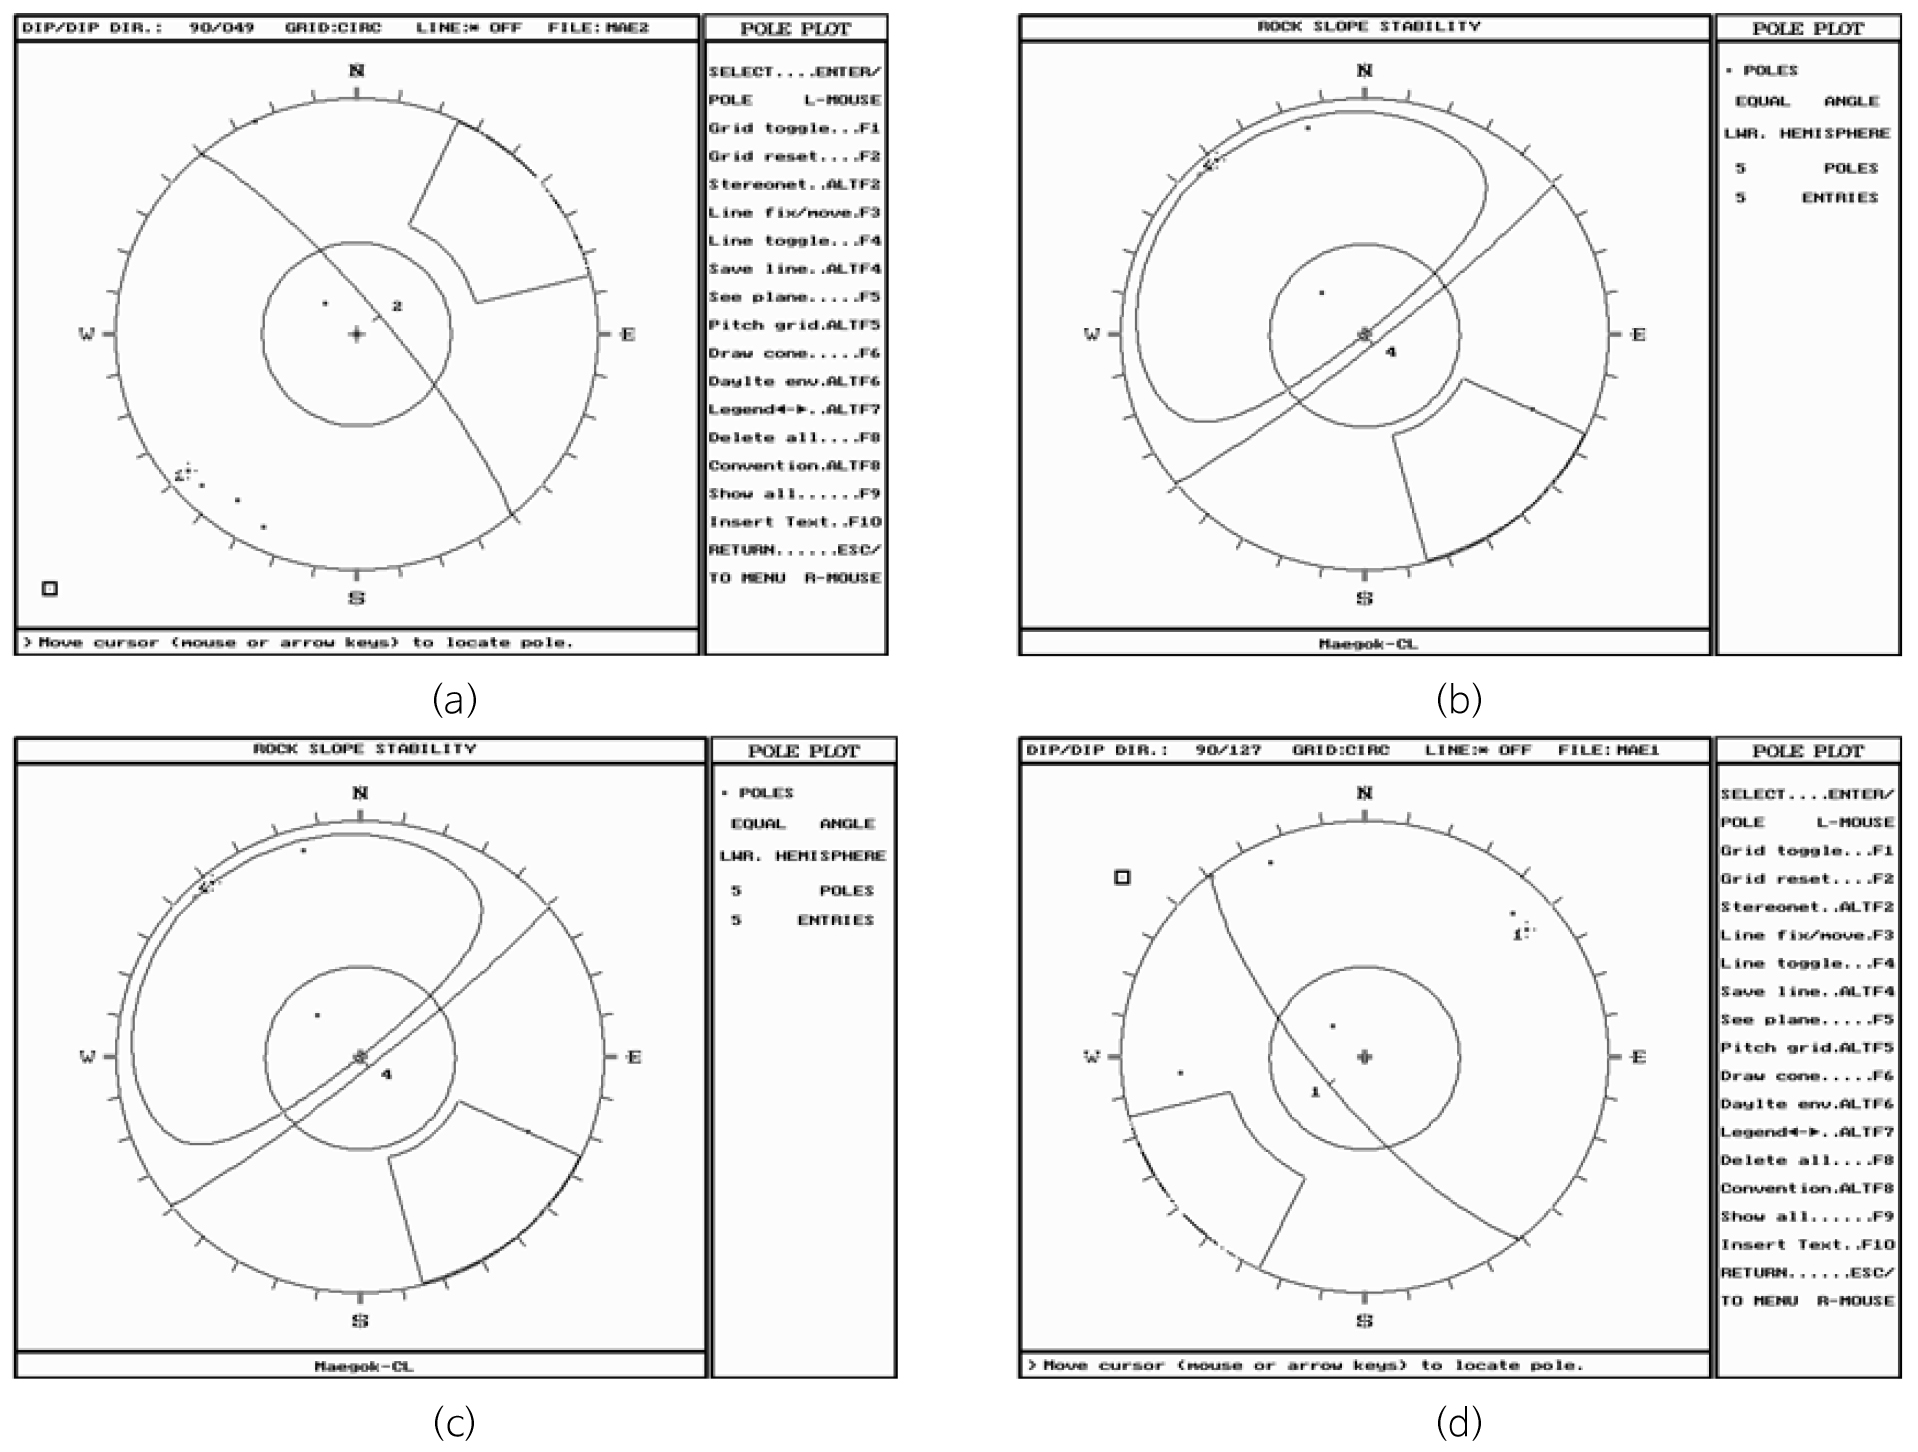
To review the slope stability, overall characteristics and failure types of the main discontinuity in four representative cross-sections were analyzed (Table 6) and stereographic projections of given discontinuities were conducted to estimate a possible failure direction. The stereographic projection drawing (equal-area lower-hemisphere projection) of bedding, shear joint, tension joint, and intrusive contact were created and the results are shown in Fig. 7.
Table 6.
The result of slope stability and geological characteristics by section on the slope
The failure size of the rock body was 0.2~0.3 m3 on average but the failure size of STA. No. 6~8 cross-section (in case that the intrusive contact zone was distributed) was 2~3 m3, which was relatively larger. The load of the failure rock body was around 6 ton ‧ m on average. The sliding direction of the failure rock body showed that in the case of STA. No. 4, STA. No. 10, and STA. No. 12 cross-sections, the toppling failure along the shear joint surface was expected to occur in the gravity direction, and in the case of STA. No. 7 cross-section, the wedge failure along with the intrusive contact and shear joint surface in the 60° southeast direction, and the toppling failure along with the shear joint surface in the gravity direction of the southeast direction.
As presented in Table 6, Sections STA. No. 3~5 and STA. No. 10~11 showed an unstable state and Sections STA. No. 6~8 exhibited a highly unstable state and Sections STA. No. 12~13 revealed a somewhat unstable state. Thus, a countermeasure method is required overall to improve the stability of the slope.
Limit Equilibrium Analysis
To conduct a stability analysis of the slope, the strength, which was derived in Section 3.4 for the STA. No. 4, STA. No. 7, STA. No. 10, and STA. No. 12 cross-sections, was used as an input value to calculate a safety factor of the representative slope during the dry and wet periods as mentioned earlier. TALREN 5.0 program was used in the limit equilibrium analysis. The period was divided into dry and wet periods and a safety factor analysis was conducted in the in-situ ground for each representative cross-section and only the results in STA. No. 7 are shown in Fig. 8 due to the limited space in this paper. Table 7 summarizes the safety factor at the dry and wet periods for each representative cross-section of the in-situ ground in the slope. The analysis results of the in-situ ground slope revealed that the safety factors in both dry and wet periods did not satisfy the allowable safety factors, which required a countermeasure method.
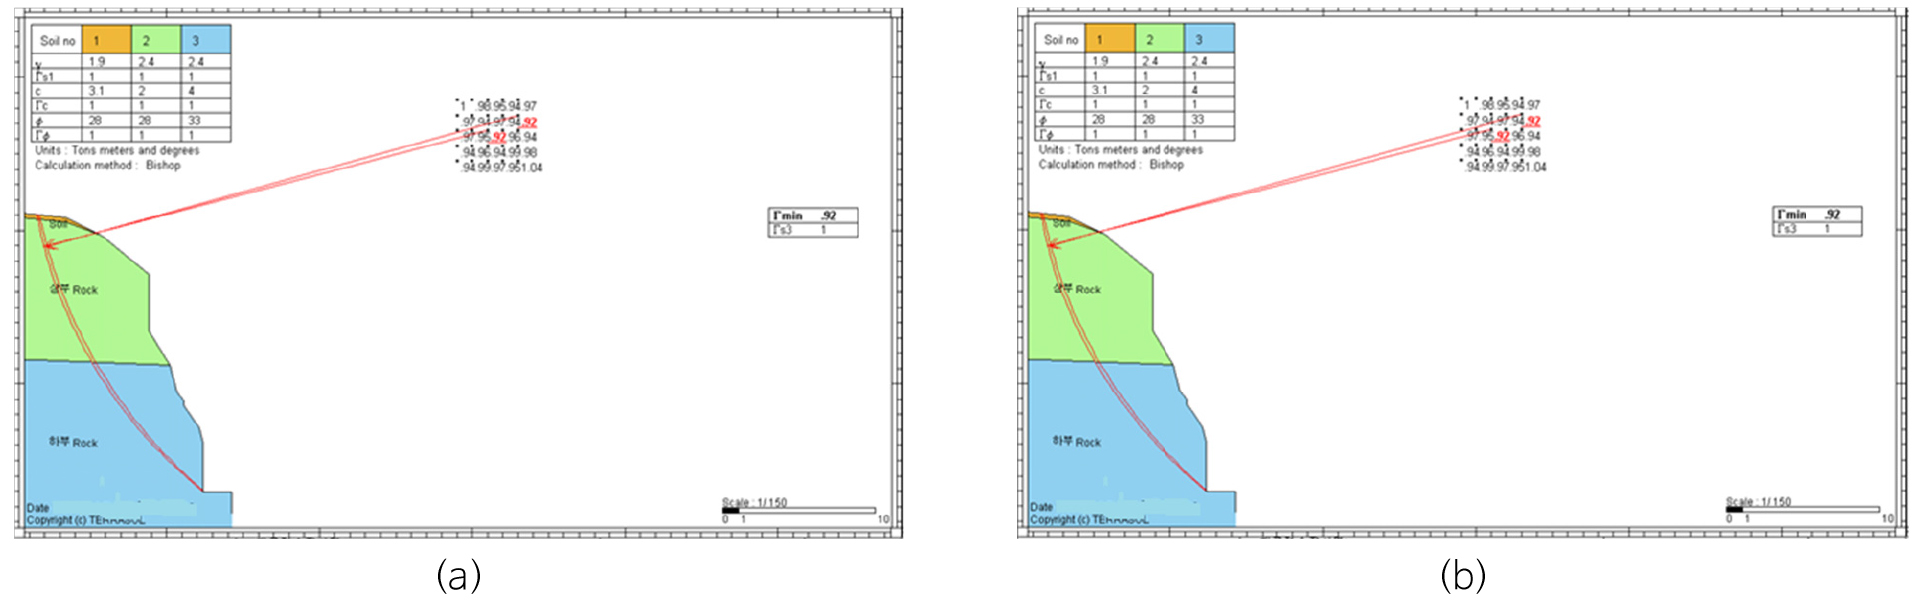
Table 7.
Safety factor (Fs) by section on the slope
| No. | Dry | Rainy | Allowable safety value (Fs) | |
| Dry | Rainy | |||
| STA. No. 4 | 0.63 | 0.12 | 1.5 | 1.2 |
| STA. No. 7 | 0.92 | 0.42 | 1.5 | 1.2 |
| STA. No. 10 | 0.86 | 0.39 | 1.5 | 1.2 |
| STA. No. 12 | 1.22 | 0.72 | 1.5 | 1.2 |
Countermeasure Method
The failure type for each representative cross-section found through the geological cross-sectional view analysis and analysis results of stereonet projection analysis exhibited that a small scale (1~2 m3) of rockfall in the upper side or a toppling failure along the shear joint surface was expected in the gravity direction and a wedge failure along the joint surface was also expected in the southeast direction for some. These results indicated that applying the slope gradient relief method, which was proven and economical considering the field circumstance overall, would be most reasonable. It was reasonable that the STA. No. 3~5 sections were needed to be cut to have the slope gradient gentler than 1:0.6, and the STA. No. 6~8 sections were needed to be cut to have the gradient gentler than 1:1 (Fig. 9a), and the STA. No. 10~13 sections were needed to be cut to have the gradient gentler than 1:0.6 (Fig. 9b & c). In addition, a 10 m-high and 1 m-wide step was needed to be installed according to the design code. Moreover, a rockfall prevention fence was needed to be installed on the slope and green soil surface treatment (t = 10 cm) was needed to be installed. Table 8 presents the stability review results after a slope relief method was applied using the set strength integer.
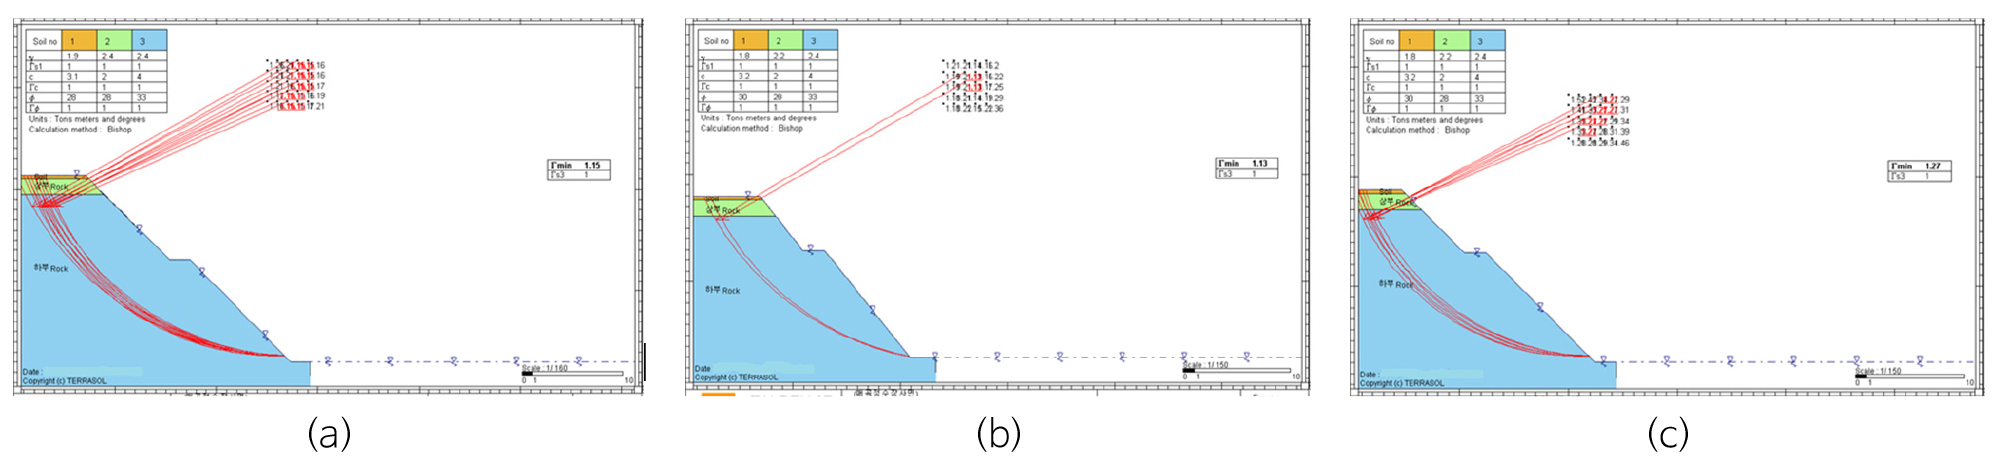
Table 8.
Safety factor (Fs) by section after relief of the gradient on the slope
Discussion
The countermeasure method according to the slope stability analysis results can be proposed variably according to the slope ground characteristics and field conditions, but ensuring the stability should be top prioritized. In addition, economic feasibility was also not neglected. In particular, the environmental factor along with safety should also be regarded importantly when the slope ground and critical national structures were adjacent in downtown as in the study area.
Furthermore, studies on the slope stability in Korea and overseas proposed limit equilibrium analysis and stability review results after generally setting the highest part of the slope height as a representative cross-section focusing only on a single slope despite that the pattern of rocks and discontinuities in a slope can be developed variably depending on a location let alone the improvement of generally used survey method, the proposal of the diversity of analysis modeling, and regional case studies, etc. For example, dividing the slope into grid cells to evaluate stability (Jang et al., 2008), a study indicating that a square-inventory method can predict a more precise failure type than a scanline survey (Cheong and Choi, 2009b), an example of stability review by presenting one of the representative cross-sections in the slope with a geological cross-sectional view (Ihm, 2016; Ihm and Park, 2017), a study on cause analysis and countermeasure of collapse after dividing discontinuity types in a slope (Park et al., 2017), a case that analyzed landslide stability using a 3D limit equilibrium method (Seo et al., 2008), and a study on 3D slope stability analysis considering a dual-lithology slope (Seo et al., 2011) have been proposed.
Thus, the preparation of systematic geological cross-sectional views has been part of the stability review method that can fully consider the inhomogeneity of slopes and anisotropy of discontinuities. As a result, slope face mapping and face mapping data of surrounding rocks have been widely used. To fully consider the fact that various geological features were distributed as the slope strike changed based on the slope face mapping data and types of discontinuities, orientation, and geotechnical characteristics can be revealed variably depending on a section, this study selected several representative cross-sections perpendicular to the slope and created and analyzed geological cross-sectional views. The geological cross-sectional views were created using a geological mapping method based on the assumption that the distribution of rocks and discontinuities revealed in the geological cross-sectional views would be similar to that of geological cross-sectional views of a section where the orientation, spacing, persistence, and cracks were the same. Although whether a failure was present and failure types can be identified using a stereonet projection analysis, accurate 3D stability reviews of slopes can be performed if each of the representative cross-sections was more finely represented in geological cross-sectional views. Furthermore, more geological cross-sectional views of narrower spacing in a single slope were used as basic cross-sections in the limited equilibrium analysis, more precise and reasonable slope stability review can be presented. That is, this study recommends that at least one geological cross-sectional view should be created in a 20 m-wide section when the orientation of the slope changes in several directions, the rocks are heterogeneous, the types and orientations of the discontinuities show various anisotropy or important geological structural elements such as faults are developed in the section, and it is desirable to mandatorily set a geological cross-sectional view as a basic drawing for representative cross-sections used in the limited equilibrium analysis.
Conclusions
This study targeted a sedimentary rock slope as a rock cut-slope close to a downtown, which had adjacent public structures and was located in the Cretaceous Gyeongsang Supergroup whose slope failure risk was high. The slope strike was characterized by changes more than 90° from northwest to northeast and then going back to the northwest. The rock in the slope was composed of sandstone, siltstone, and dyke, and bedding, shear joint, tension joint, and dyke contact were developed in the discontinuities. The type and scale of the failure by a section were various depending on the rock type and discontinuity orientation, but a toppling failure was dominant and the size of the failure rock body was 0.002~3 m3. The load of the failure rock body was calculated to be around 6 ton ‧ m on average. The results of stereonet projection analysis exhibited that a toppling failure along the shear joint surface was expected to occur in the gravity direction and a wedge failure along with the shear joint surface in the 60° southeast direction regarding the fall direction of the failure rock body. The comprehensive and review results using face mapping data, SMR, rock’s physical properties, and mechanical tests, stereographic projection method, analysis of geological cross-sectional views by a section, and a limited equilibrium analysis showed that the safety factors of all four representative cross-sections were far short of the allowable safety factor at the dry and wet periods, which were Fs = 1.5 and Fs = 1.2, respectively. Thus, a countermeasure method was needed. Accordingly, the first proposal was to use slope gradient relief method, the second proposal was to use slope gradient relief method and surface treatment method, and the third proposal was to use slope arrangement, two-layer installation of rockfall prevention fence, and partial installation of rockfall prevention netting as the countermeasure method considering economic feasibility, efficiency, and field characteristics, etc. After applying the slope gradient relief method, which was judged reasonable among them, both safety factors at the dry and wet periods exceeded the allowable safety factors. In particular, the preparation of slope face mapping data and geological cross-sectional views of several representative sections perpendicular to the slope, and setting the geological cross-sectional views to basic drawings in the limit equilibrium analysis, as well as the proposal of reasonable countermeasure method will be an objective tool used in slope’s 3D analysis and stability review. Furthermore, geological cross sections can be used as foundational data of performance evaluation in the slope maintenance viewpoint in the future.
