Introduction
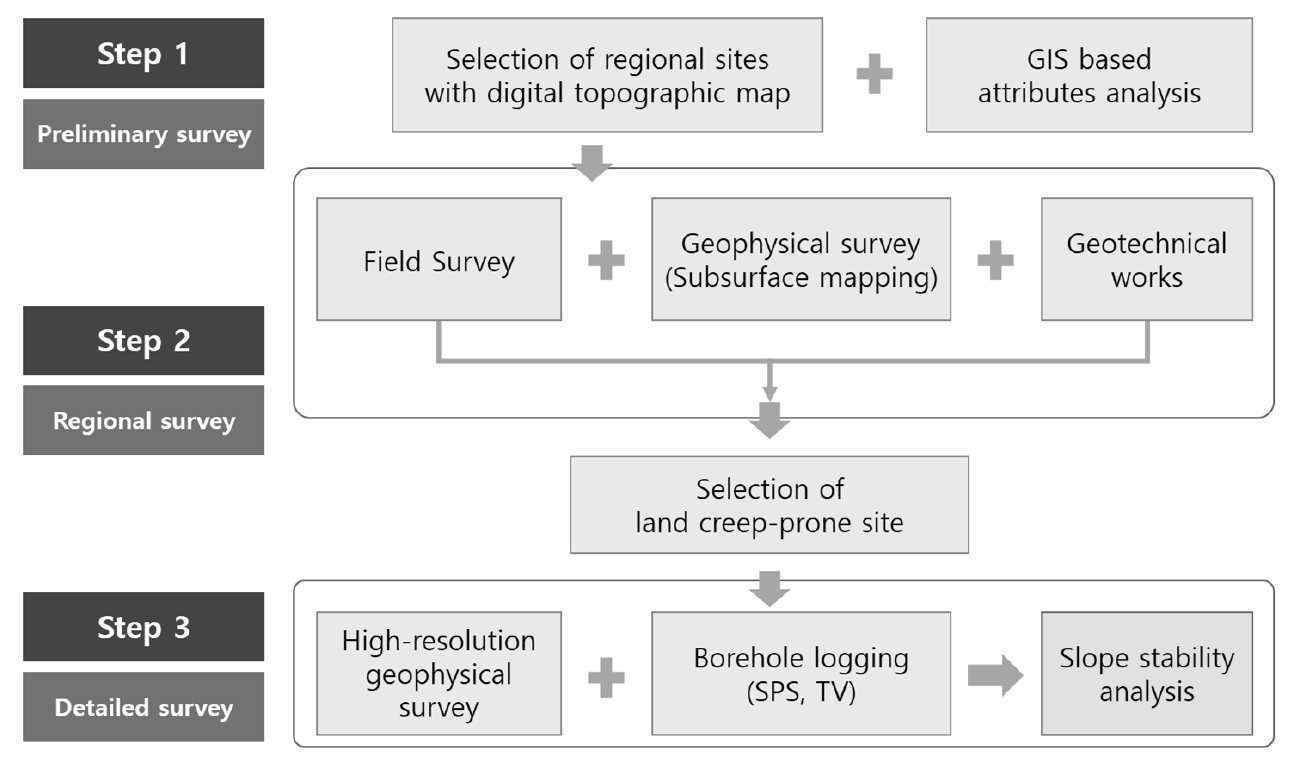
Preliminary Survey
Regional Survey
Detailed Survey
High-Resolution (HR) Electrical Resistivity and Seismic Velocity Structures
Electric Resistivity Model Using Parallel Archie’s Equation
Slope Failure Model and Conclusions
Introduction
Earth materials on slopes may fail and move or deform in several ways: falling, sliding (slump, soil slip, rock slide), and flowing (avalanche, creep, earthflow, debris flow) (Keller and Devecchio, 2013). However, many landslides are complex combinations of sliding and flowage. In general, slope collapse and landslides are characterized by intense and rapid occurrence mainly caused by heavy rainfall, typhoon strike and earthquake.
On the other hand, land creeping is termed as steady and very slow flowage, for example, progressively tilting telephone poles, fence, and tree trunks. It proceeds slowly and deeply on the active plane, and thus it is more closely related to weathering, physical properties, and constituent minerals of the soil and rock as well as external impacts such as rainfall. Because it occurs on a large scale without notice, it may cause significant loss of life and damage to humun property, especially in a densely populated area.
In Korea, land creeping events have been on the rise recently and Korea Forest Service has operated the prevention and response system from the land creeping since 2018. After a national basic survey, about 20,000 sites showing the topographic change of more than 5 m were selected as the most concerned areas of land-creeping (Korea Policy Briefing, 2021). More detailed surveys are being conducted every year over the 2,000 sites, including field mapping, geophysical survey, and comprehensive interpretation. Over the two-year (from 2019 to 2020) survey of the land creeping susceptibility area, thirty areas were rated as the most concerned Class A and forty remote monitoring system is running for the pilot service (Yunhapnews, 2021).
In planning engineering projects for landslide areas, the characteristics of the moving mass for the failure mechanism should be understood. In general, a combination of geological, geophysical, and geotechnical works would be conducted for recognition of lithostratigraphic sequences and the geometry of the landslide’s body, identifying the sliding surfaces between the slide material and the underlying bedrock (Caris and Van Asch, 1991; Mauritsch, et al., 2000; Pasierb et al., 2019; Lee et al., 2020).
In this research, the proposed basic steps of locating the land-creeping susceptibility site are established and classified into three major stages of preliminary, regional, and detailed mapping of a test site, which has experienced ground deformation, especially triggered by the 2017 Pohang earthquake (M 5.4).
Geophysical methods for landslide project can provide useful information on the structure of moving masses, delineation of sliding surface, understanding of failure mechanism, groundwater and clay-minerals effects on the slide, and physical properties of landslide material (Bogoslovsky and Ogilvy, 1977; Göktürkler et al., 2008; Kim et al., 2021). In the application of surface geophysical exploration, electrical resistivity and seismic refraction surveys have been the methods most commonly employed with primary aim of providing information about the geological framework and the mechanism of landslides (Kim et al., 2001).
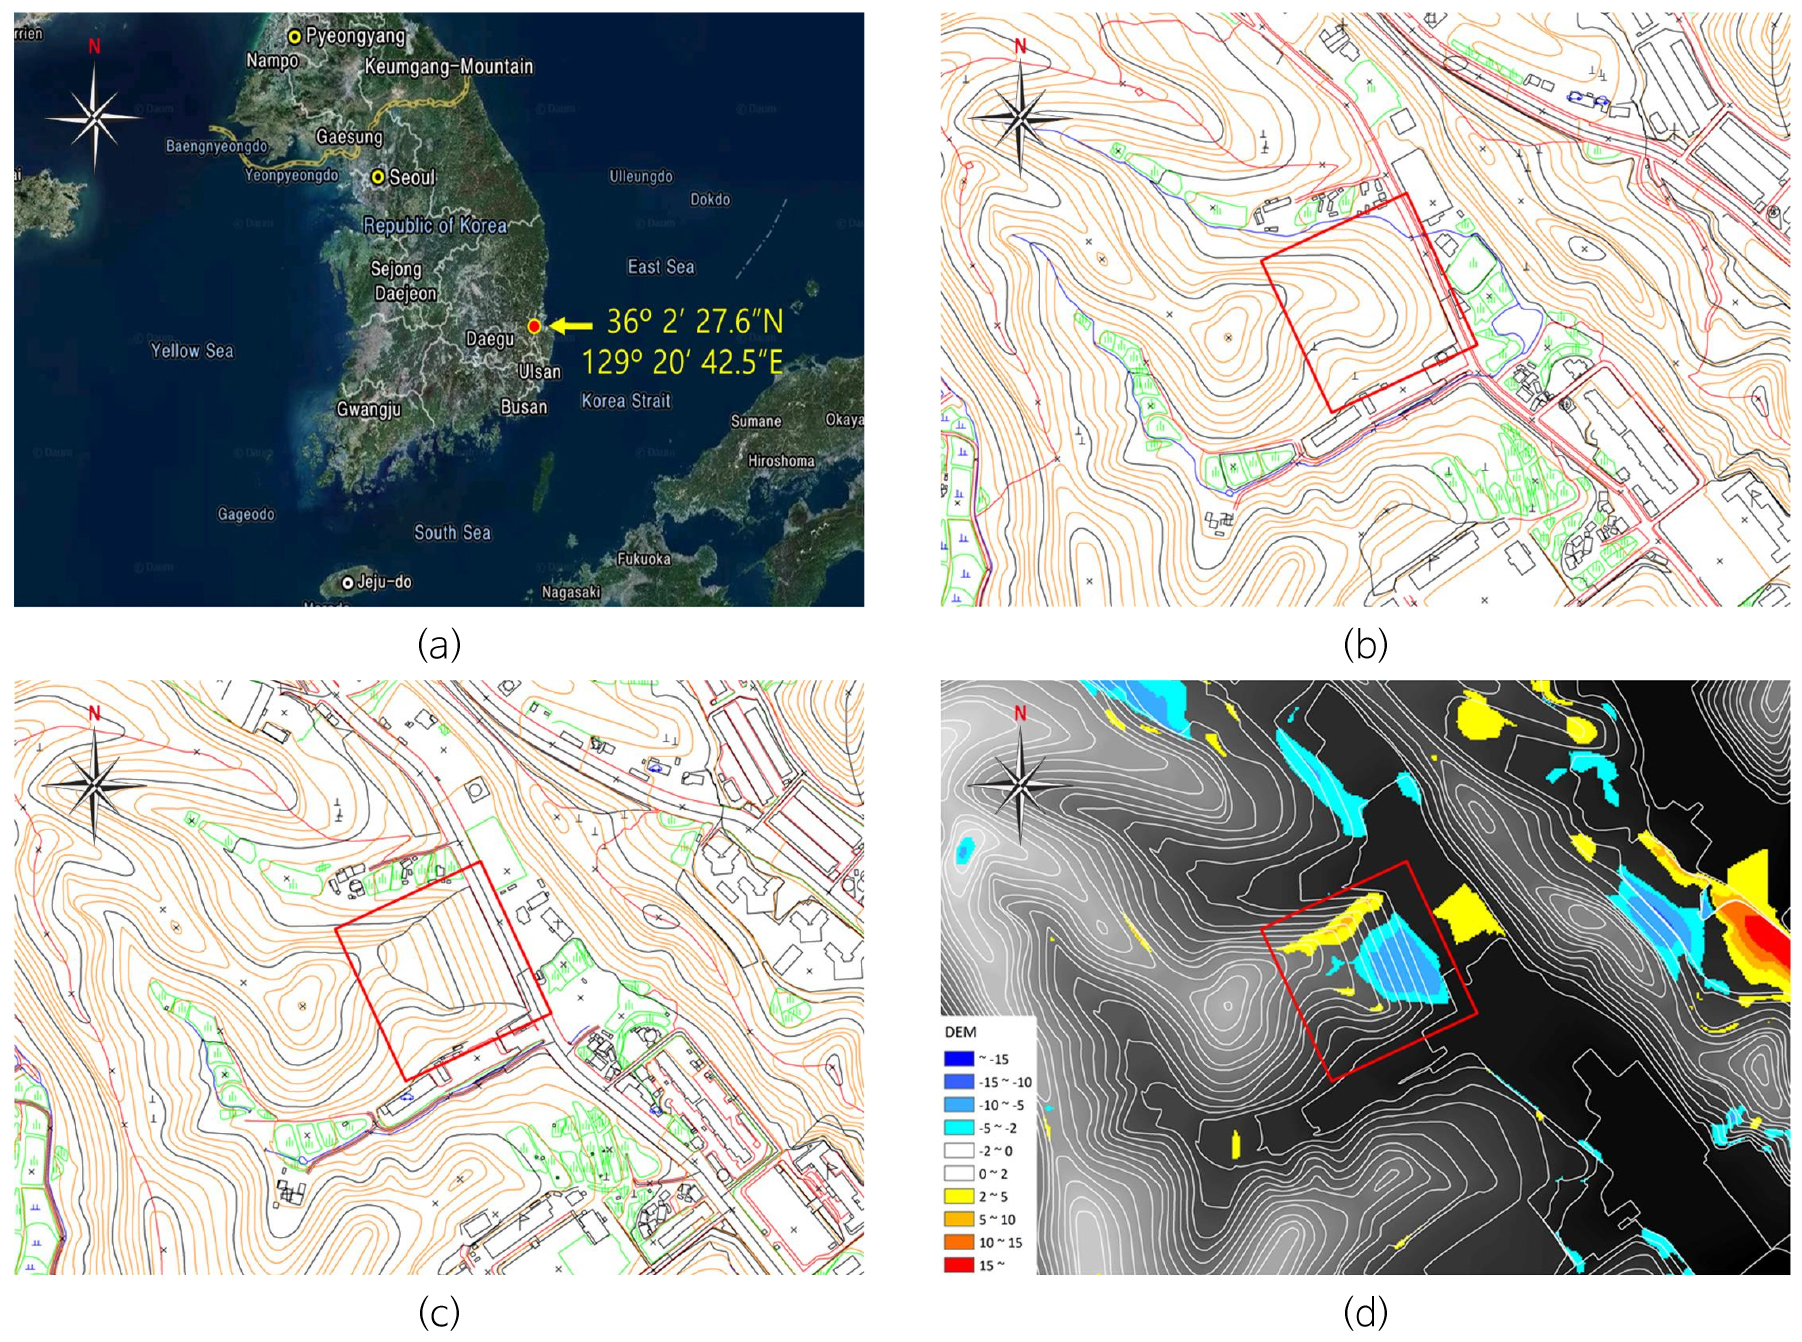
The main objectives of the research include suggesting effective survey steps for investigating the most concerned land-creeping area and applying the three survey steps (preliminary, regional, detailed) (Fig. 1) to a test area, Yongheung-dong, Pohang, Korea, the eastern part of Gyungsang basin (Fig. 2a). The site is well known for a land-creeping susceptibility area, with ground deformation of 6.5 cm displacement in the aftermath of the 2017 earthquake (Lee et al., 2019).
In this study, the various types of data sets (geophysical, geotechnical, field data) were selected as a representative database for research into land-creeping susceptibility area. In particular, high-resolution geophysical data (electrical dipole-dipole and seismic refraction) were analyzed in terms of appropriate focusing and correlation studies, and were proceeded with special emphasis on improving the resolution of slip weak zones, tension cracks, and weathered rock. In addition, they are correlated with well-logging (drill-core, suspension-PS: SPS, televiewer: TV), surface geology (tension cracks, faults), and geotechnical works including laboratory tests.
Preliminary Survey
Due to the limitation of landslide occurrences, a qualitative index based GIS (geographic information system) approach was selected in the preliminary step. In general, there are four main parameters: human-induced, topographic, hydrological, and geological parameters (Kanwal et al., 2017). In landslide susceptibility assessment studies, determination of the causative factors for the landslide is the first step. Factors such as rainfall, traffic (proximity to roads), facility, drainage, groundwater, and vegetation are included in the susceptibility attributes analysis.
Because there is no nationally established standards for the preliminary step, we used digital topographic map to analyse the topographic changes. Test site showed approximately 15 cm elevation change in digital elevation models (DEM) between 2005 and 2016 (Figs. 2b, 2c, 2d).
Regional Survey
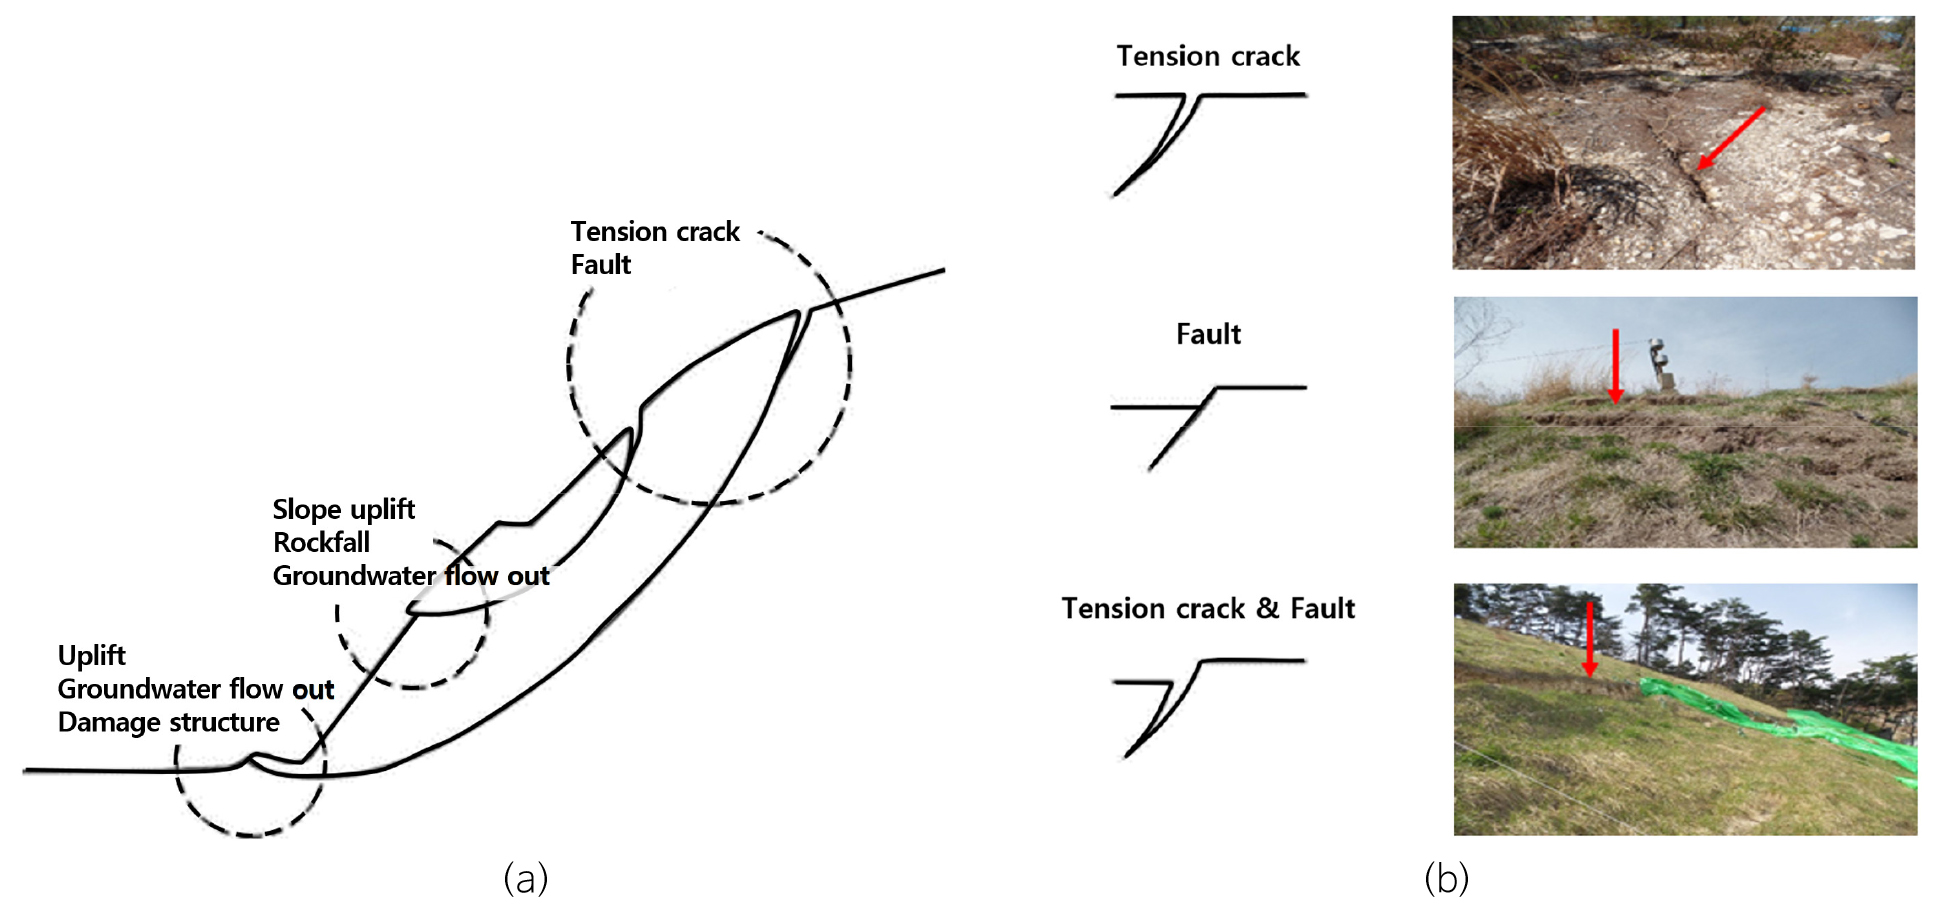
In areas where land-creeping is slightly under way, there usually appear some typical features on the surface from to bottom: tension crack, fault, slope uplift, rockfall, groundwater flowout, toppled tree, and damage structure (Fig. 3a) (Lee, 2021). Fig. 3b represents typical precursors observed on the study site: tension crack, fault, and slope uplift.
Regional geophysical surveys of seismic refraction (Fig. 4a) and electrical resistivity (Fig. 4b) were conducted to broadly capture the geological structures deploying several lines. Soil and rock samples collected near the survey lines are geotecnically analyzed to provide physical, mechanical, and hydrological properties. Geotechnical works associated with geophysical data included rock strength test, drill coring to investigate the stratigraphy (Fig. 4c), and measurement of groundwater level (Fig. 4d).
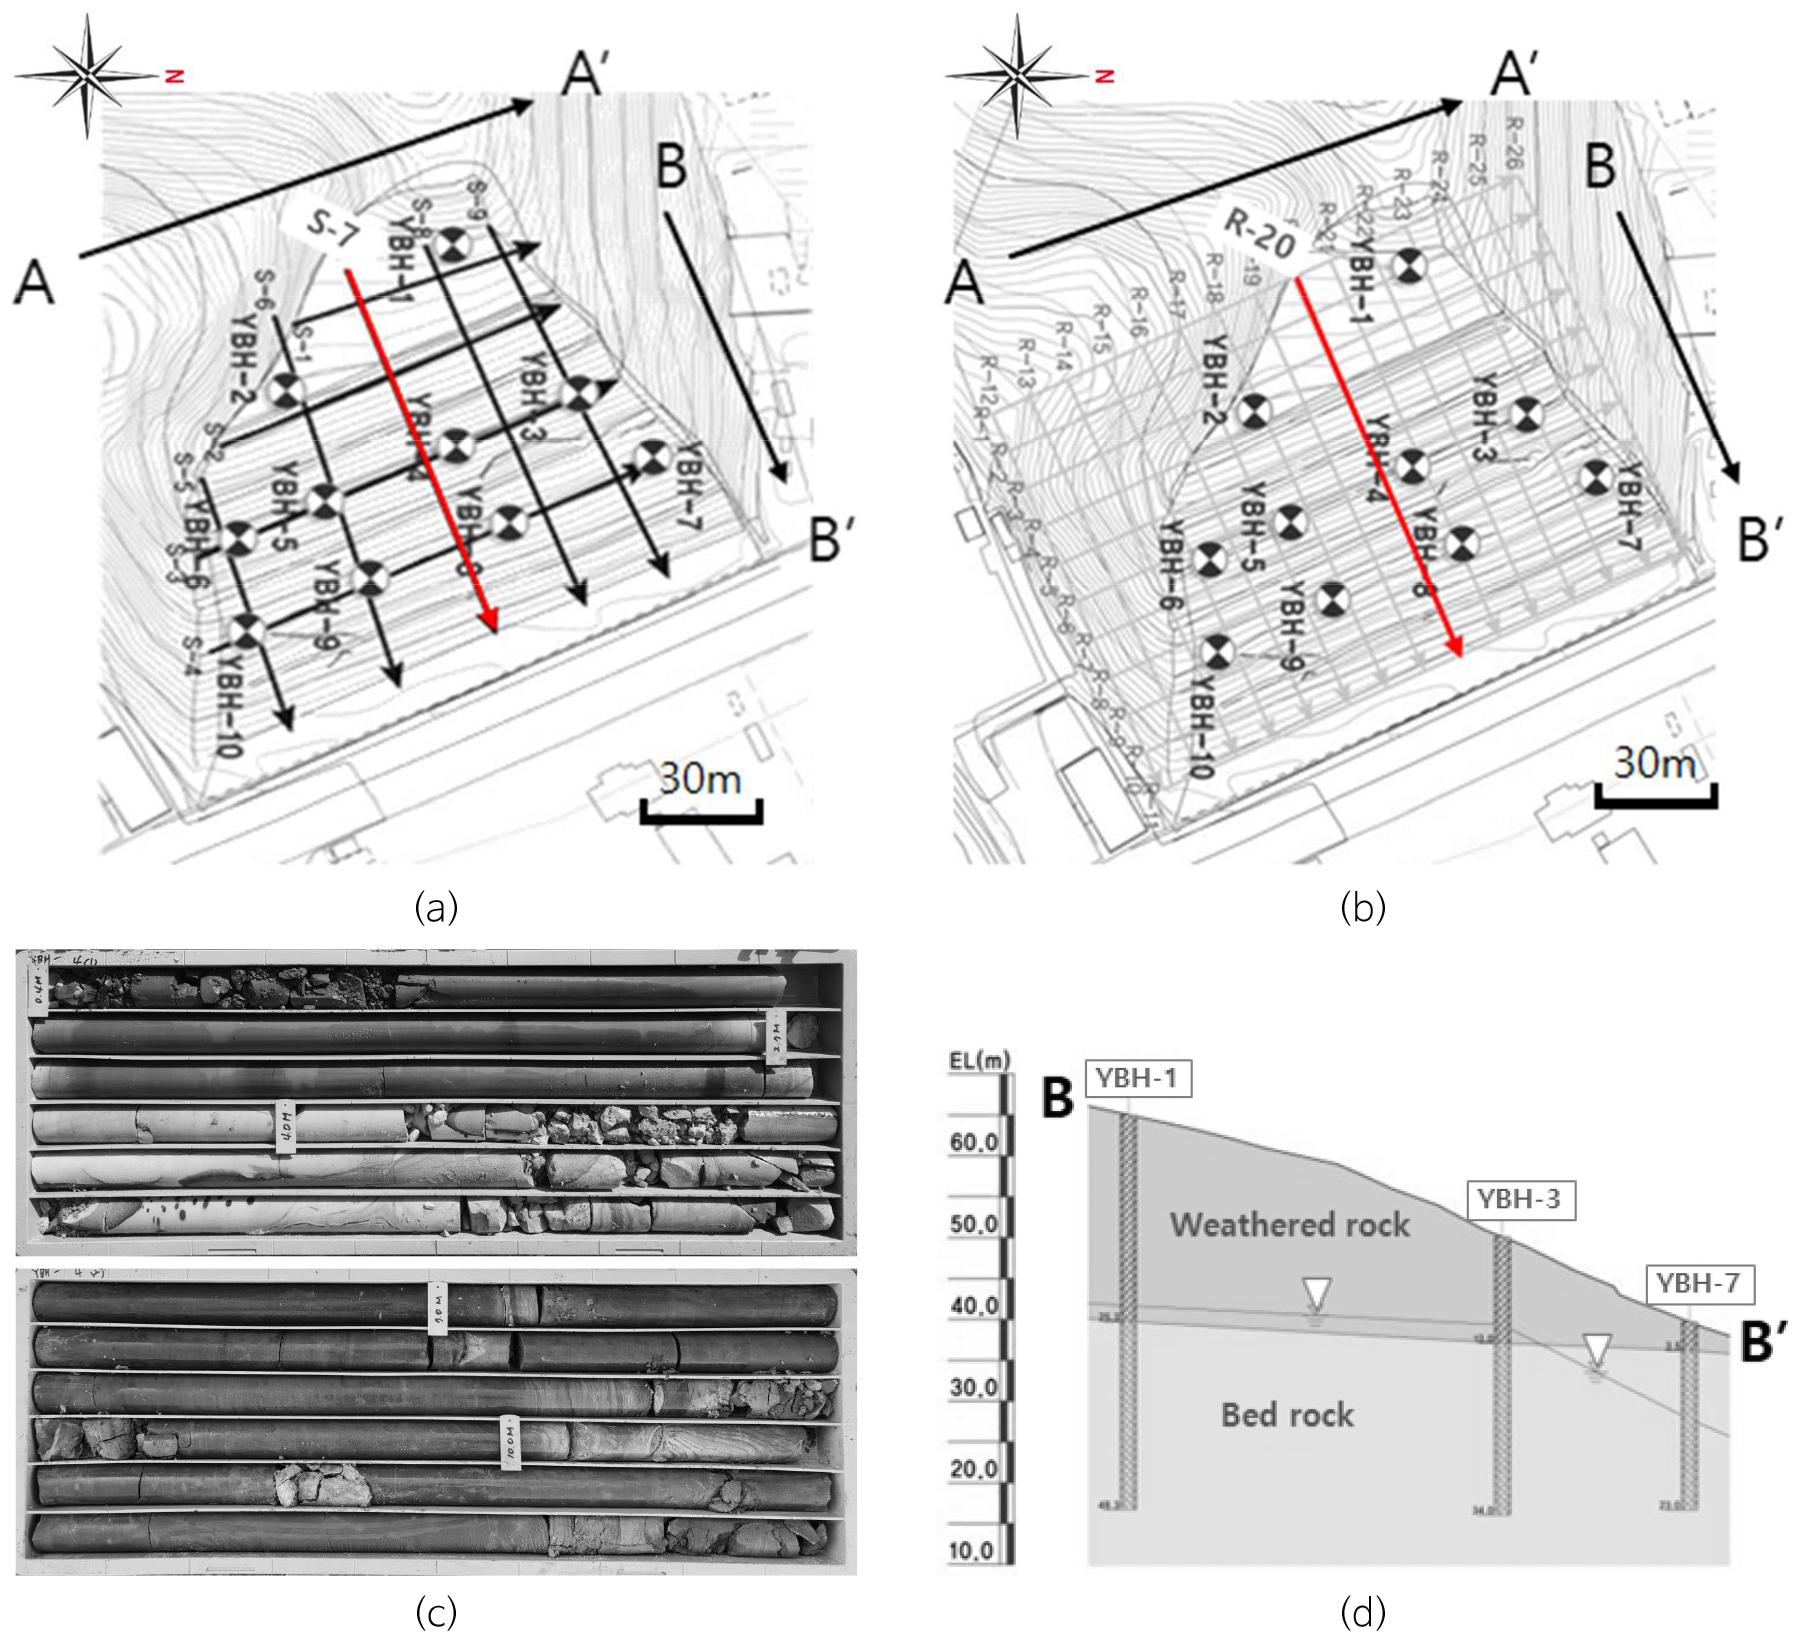
Signal 10 Hz geophones with a spacing of 5 m were used in seismic refraction survey. Sliding surface is broadly mapped in seismic velocity structure as a boundary between weathering rock and bed rock (Fig. 5a). The dipole-dipole electrical profiles were surveyed using a 5 m dipole spacing, a 21 station array, and a maximum dipole separation equal to 8, which resulted in a maximum imaging depth of approximately 15 m. Figure 5b shows the fence diagram of resistivity data showing the low resistivity zones associated with the slip weak zone. Electrical resistivity section of the line R-20 (Fig. 5c) corresponding to the seismic line S-7 (Fig. 5a) represents the high resistivities at the top of the slope where the seismic velocities are low. Such high resistivities and low velocities can be explained by the underlying dry soil/rock of the material and subvertical tension cracks.
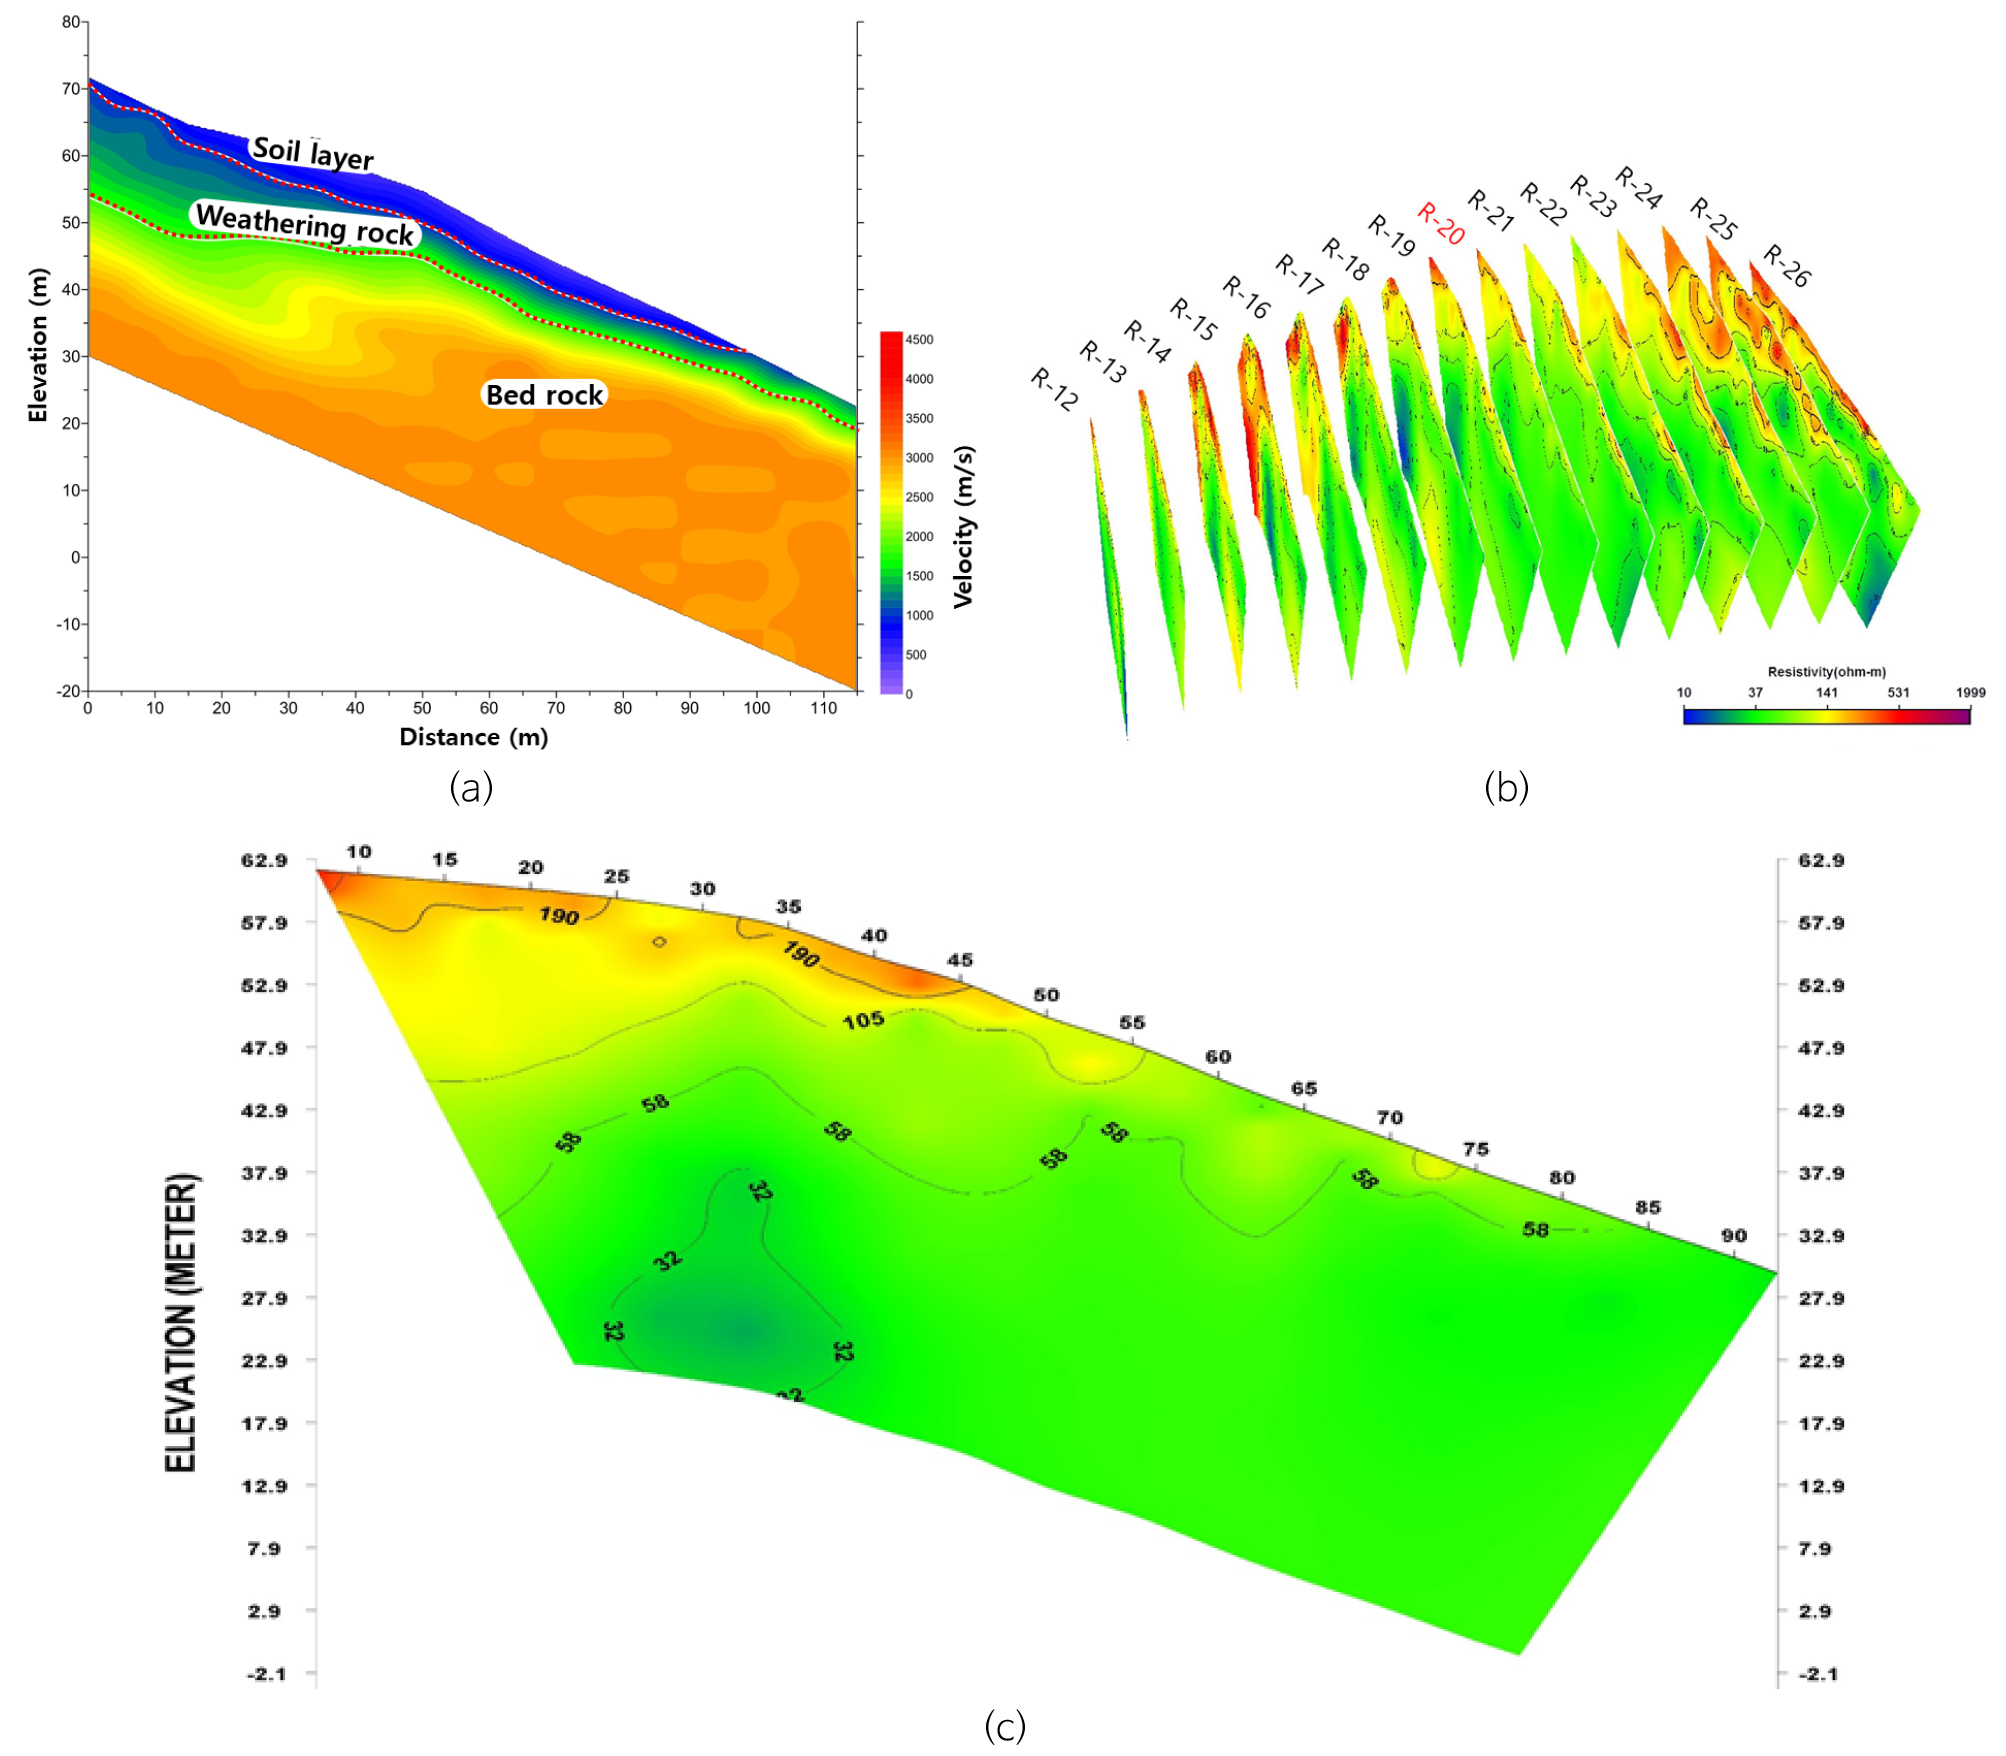
Fig. 5.
Regional geophysical mapping. (a) Seismic velocity structure for the Line S-7 delineating the soil layer, weathering rock, and bed rock. (b) Resistivity fence-diagram for the A-A' direction, showing high resistivities at the top (termed “B”) of the slope. (c) Electrical resistivity structure for the Line R-20 (representing the high resistivity at the top of the slope) is probably caused by dry materials associated with tension cracks.
Detailed Survey
The purpose of this investigation of geophysical survey is to provide reliable subsurface information of the study area that was previously affected by slope failure and land creeping, and is currently rehabilitated with stepped retaining wall and drainage system. But the creeping mechanism has yet to be investigated.
Therefore, electrical resistivity and seismic refraction surveys were performed with narrow station-spacing (2 m for seismic and 3 m for electrical surveys) on the regional survey line (Figs. 4a, 4b) to acquire high-resolution (hereafter “HR”) data. Subsurface geological structures mapped using high-resolution geophysical data are also interpreted with borehole logging data (SPS: suspension PS, TV: televiewer) (Figs. 6a, 6b). Three layers of weathered rock, soft rock, and bed rock are distinguished on the basis of seismic velocities and dynamic elastic coefficients. A segment of TV (televiewer) logging profile shows the intense fractures in the soft rock. The N values were not available with standard penetrating tests (SPT) because the soil overburden is reduced for the site countermeasures.
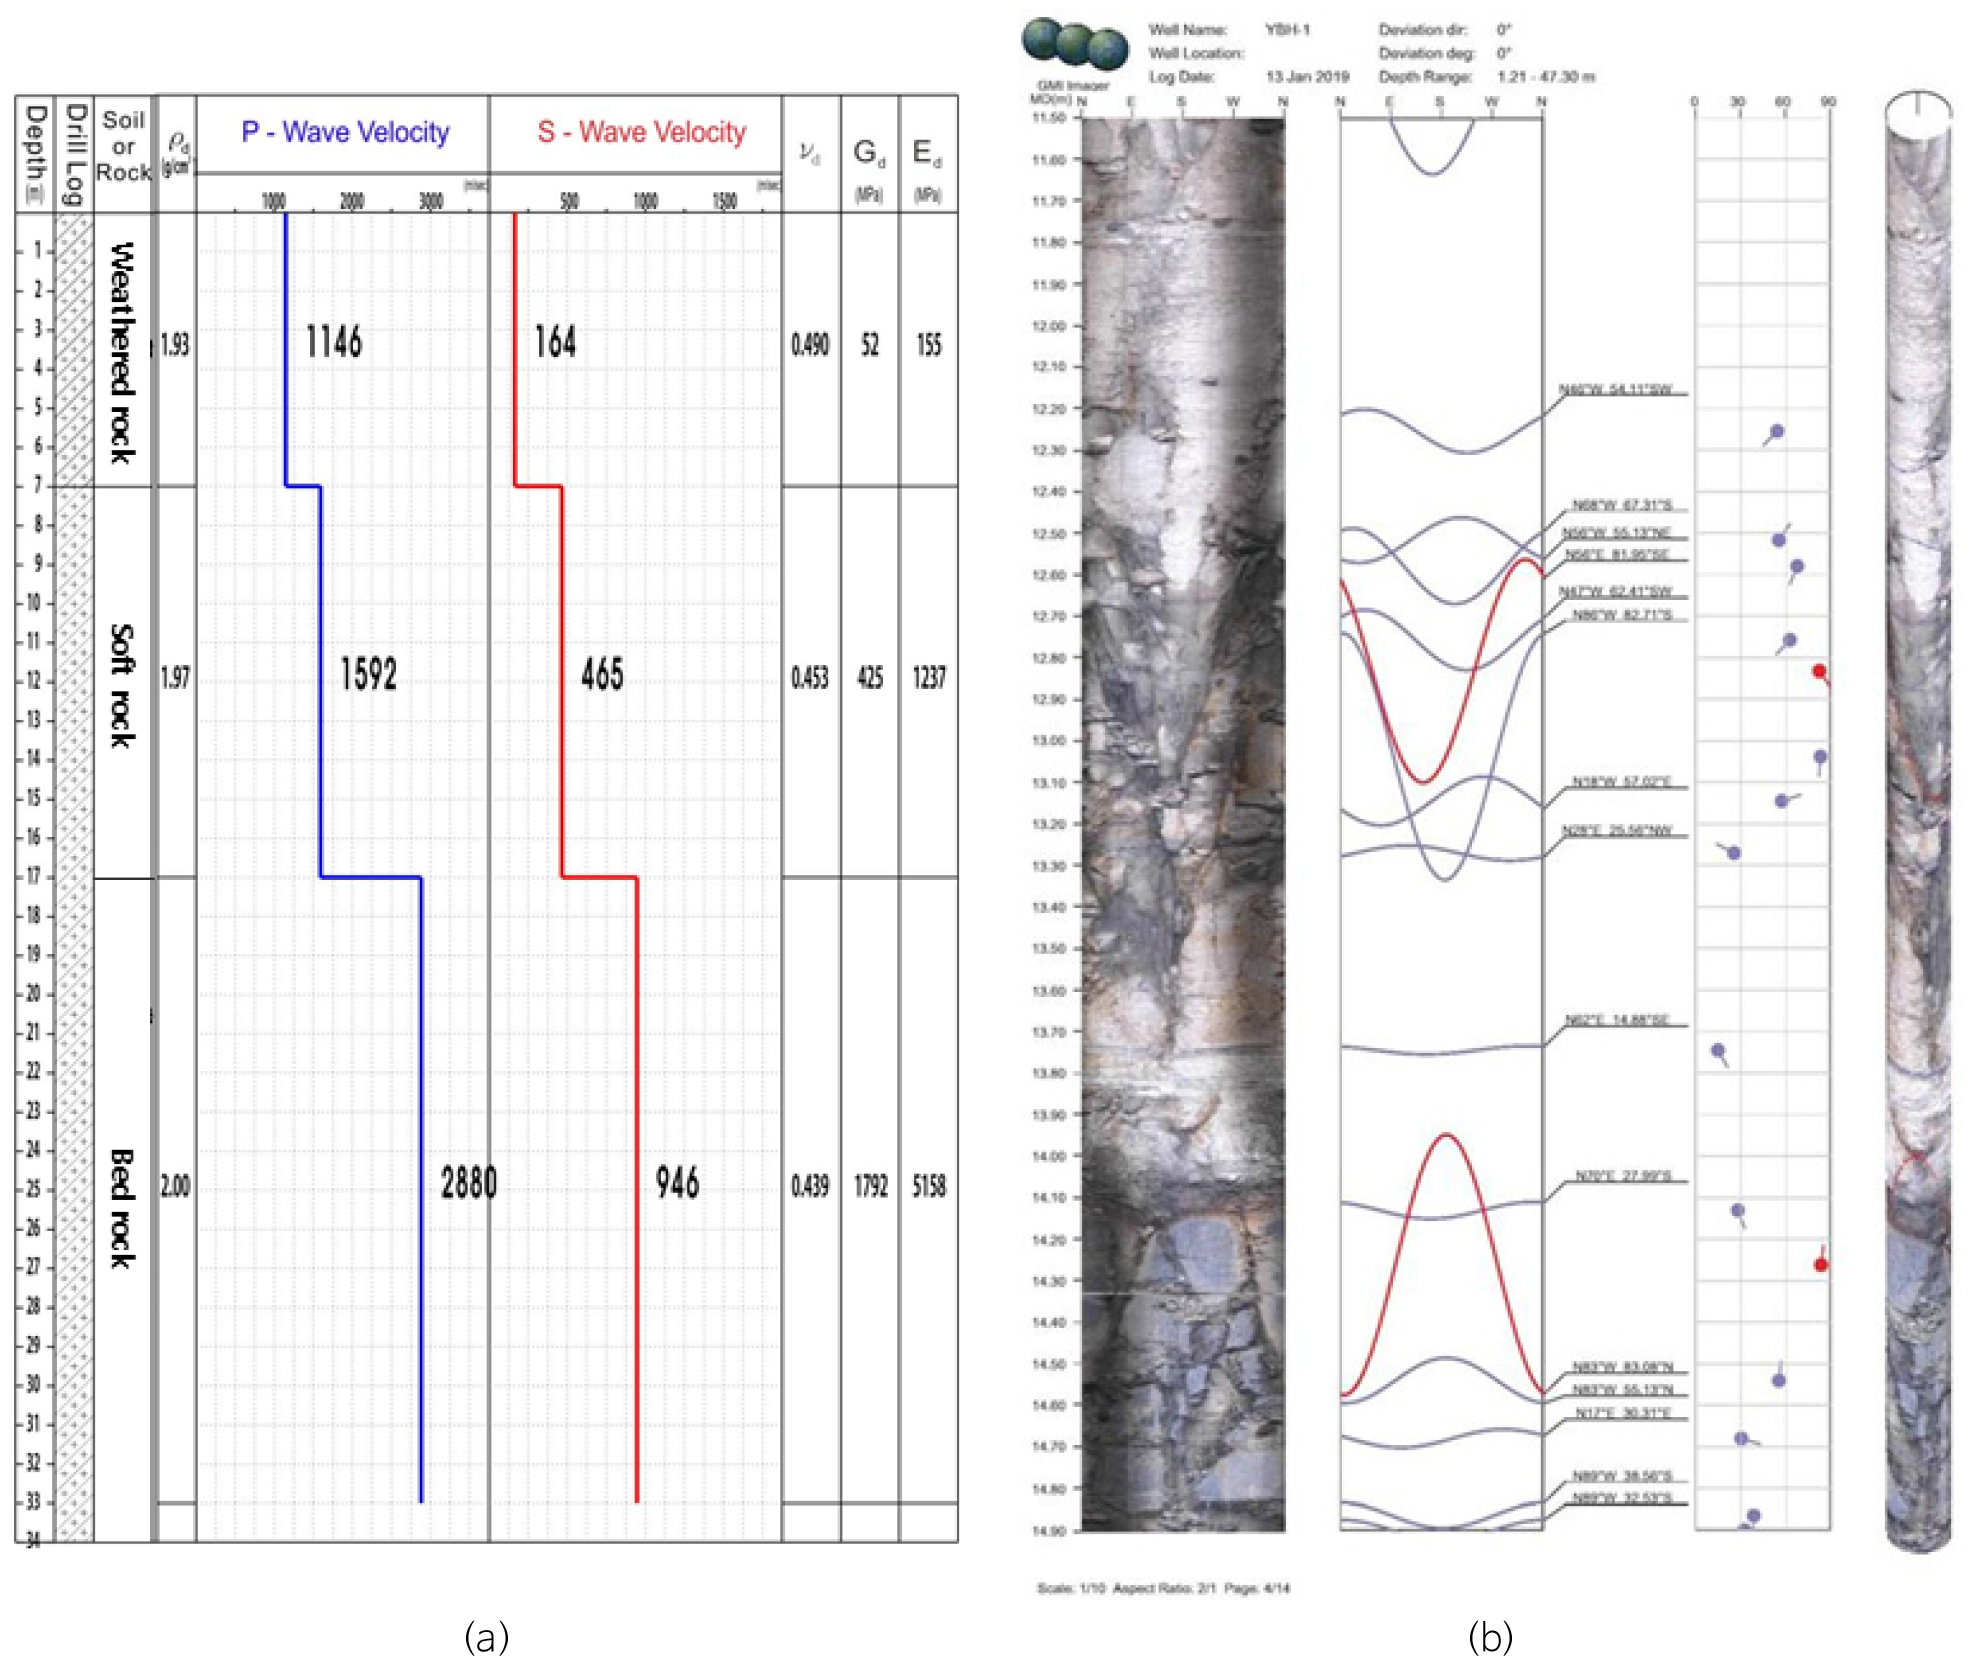
Fig. 6.
Borehole logging data: (a) Suspension PS (SPS) logging profile distinguishing the weathered rock, soft rock, and bed rock based on density , P-wave velocity, S-wave velocity, Poisson’s ratio , rigidity , and Young’s modulus . (b) A segment of televiewer (TV) logging profile (depths 11-14 m) showing the intense fractures in soft rock.
The two major factors that determine the slope stability are the angle of the slope and the strength of material on it. The HR geophysical data incorporated with borehole data provides the accurate geometry of the land creeping.
High-Resolution (HR) Electrical Resistivity and Seismic Velocity Structures
Geologically, the area under investigation belongs to the Yungil Group, the eastern margin of the Gyungsang Basin, which is situated in southeastern Korea. The rocks involved are sedimentary rocks consisting of mainly yellow mudstone and silty sandstone. Therefore, clay mineral in weathered rock could be a key parameter of sliding masses on the failure plane.
To accurately delineate the failure plane, HR electrical resistivity and seismic refraction data are collected on the regional survey lines, with high-resolution parameters. Compared to the regional seismic data (Fig. 5a), the interested zone B is more clearly shown with the shape of a wedge facing down in the HR seismic velocity structures (Fig. 7a). Such a downslope feature is distinctly shown in HR electrical resistivity section (Fig. 7b). Low resistivity zone A with subvertical fractures is associated with tension cracks. B is interpreted to be the curved failure plane.
Fig. 7.
(a) Velocity structures from high-resolution seismic refraction line. The white arrow explains the land creeping direction. (b) Electric resistivity structure from high-resolution dipole-dipole line. Slope failure plane B is more clearly mapped in two HR sections. A and B are associated with tension cracks and curved failure plane, respectively.
Electric Resistivity Model Using Parallel Archie’s Equation
Since the electrical resistivity of most minerals is high, the electrical current flows mainly through the pore water. According to the standard Archie law, the resistivity of water saturated clay-material can be described as
where, and are the porosity and s saturation degree, respectively; is the resistivity of porewater; , , are the constants where 0.5≤≤2.5, 1.3≤≤2.5, and ≈2 (Zhdanov and Keller, 1994).
Generally, clay resistivity is far lower than granular (e.g., sand and gravel) soil resistivity due to additional matrix conduction caused by the movement of ions distributed across the surfaces of clay particles (Figs. 8a, 8b) (Gunn et al., 2015). Therefore, the calculation of the resistivity of clayey material is complicated, since the electrical current flow is possible through clay minerals and pore fluid. It can be explained by the parallel Archie’s equation:
where, is the resistivity of the surface resistivities due to clay minerals.
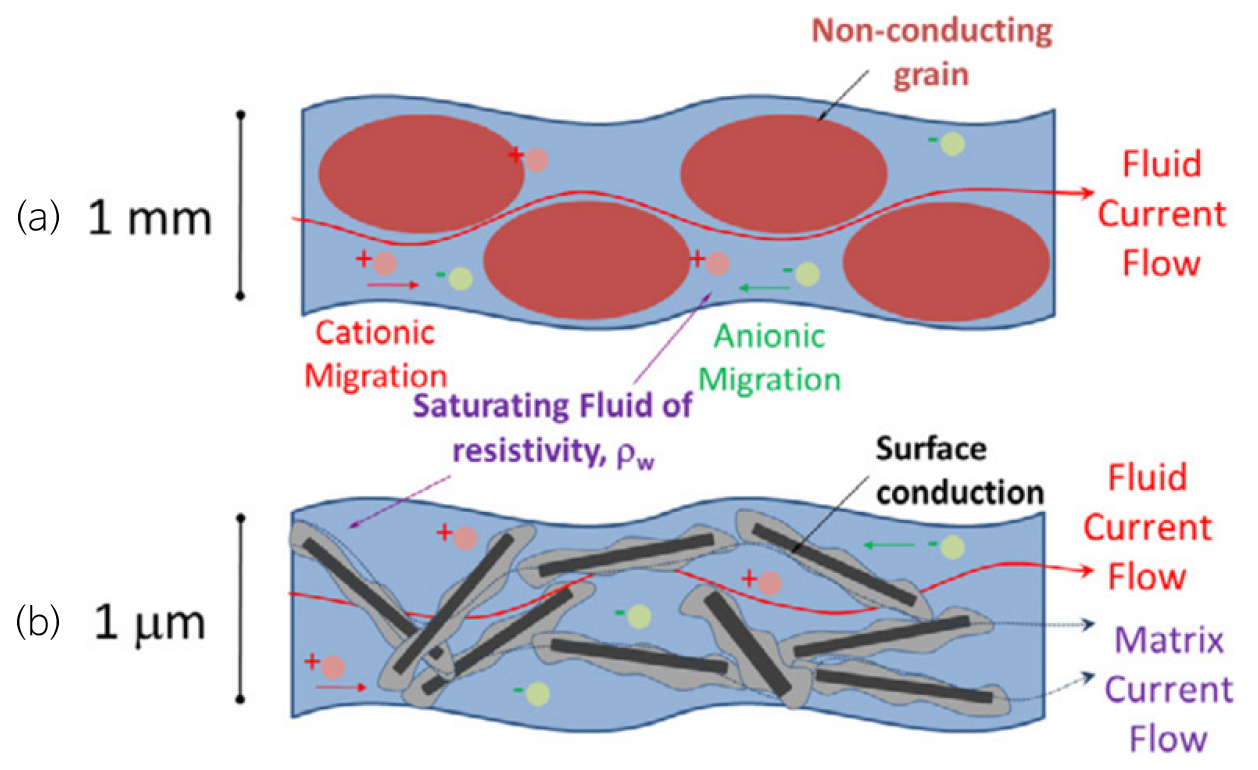
Fig. 8.
Current flow and resistivity of (a) granular particles with single conductivity phase and (b) clay with surface conduction. (Modified from Gunn et al., 2015; Kim et al., 2021).
Considering clay mineral content of weathered rock is a key parameter for land creeping studies, we interpreted the electrical resistivity tomogram with contents of clay minerals using parallel Archie’s equation. We estimated the clay-mineral contents of the weathered rock by comparing the results of the theoretical section produced with addition of clay contents and the inverted resistivity structure.
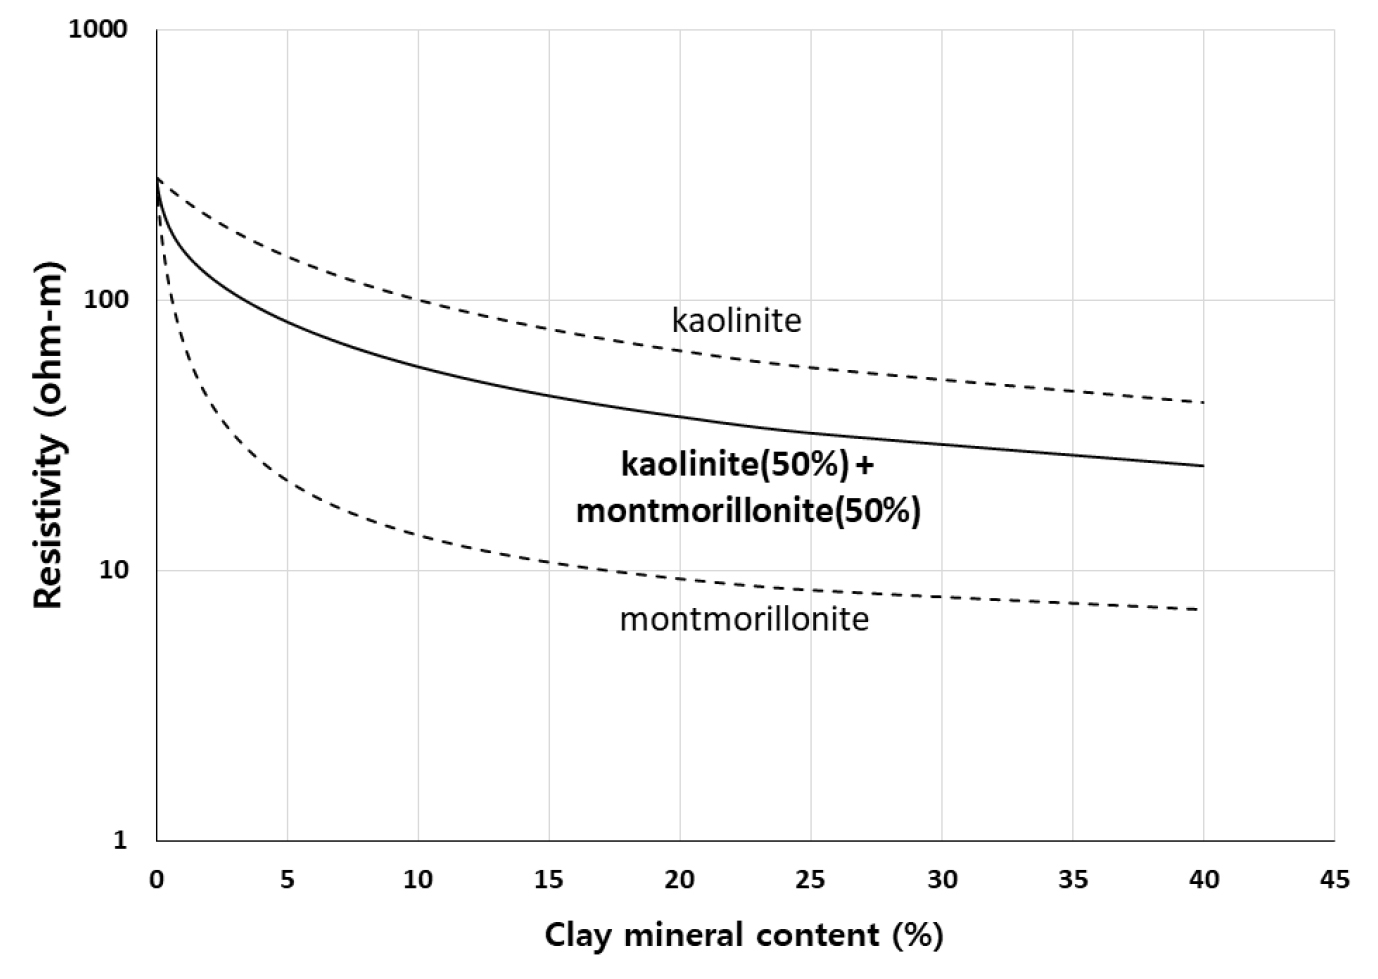
Based on the Kim et al. (2021)’s approach, we conducted the panel tests for investigating the clay mineral contents of the weathered rock using simplified model (Fig. 9) of the inverted resistivity structure (Fig. 7b). The images correlation test between field data and theoretical structure with varying clay mineral contents (1, 3, 5, 10, 15%) provides the best fit resistivity panel with optimum value 10% of clay mineral content of the weathered rock (Fig. 9). The characteristic resistivity curve for the site is constructed assuming the clay contents of kaolinite (50%) and montmorillonite (50%) (Fig. 10). The resistivity value 57 Ωm corresponding to the estimated content 10% is used for surface resistivity in the parallel Archie’s equation (Eq. (2)).
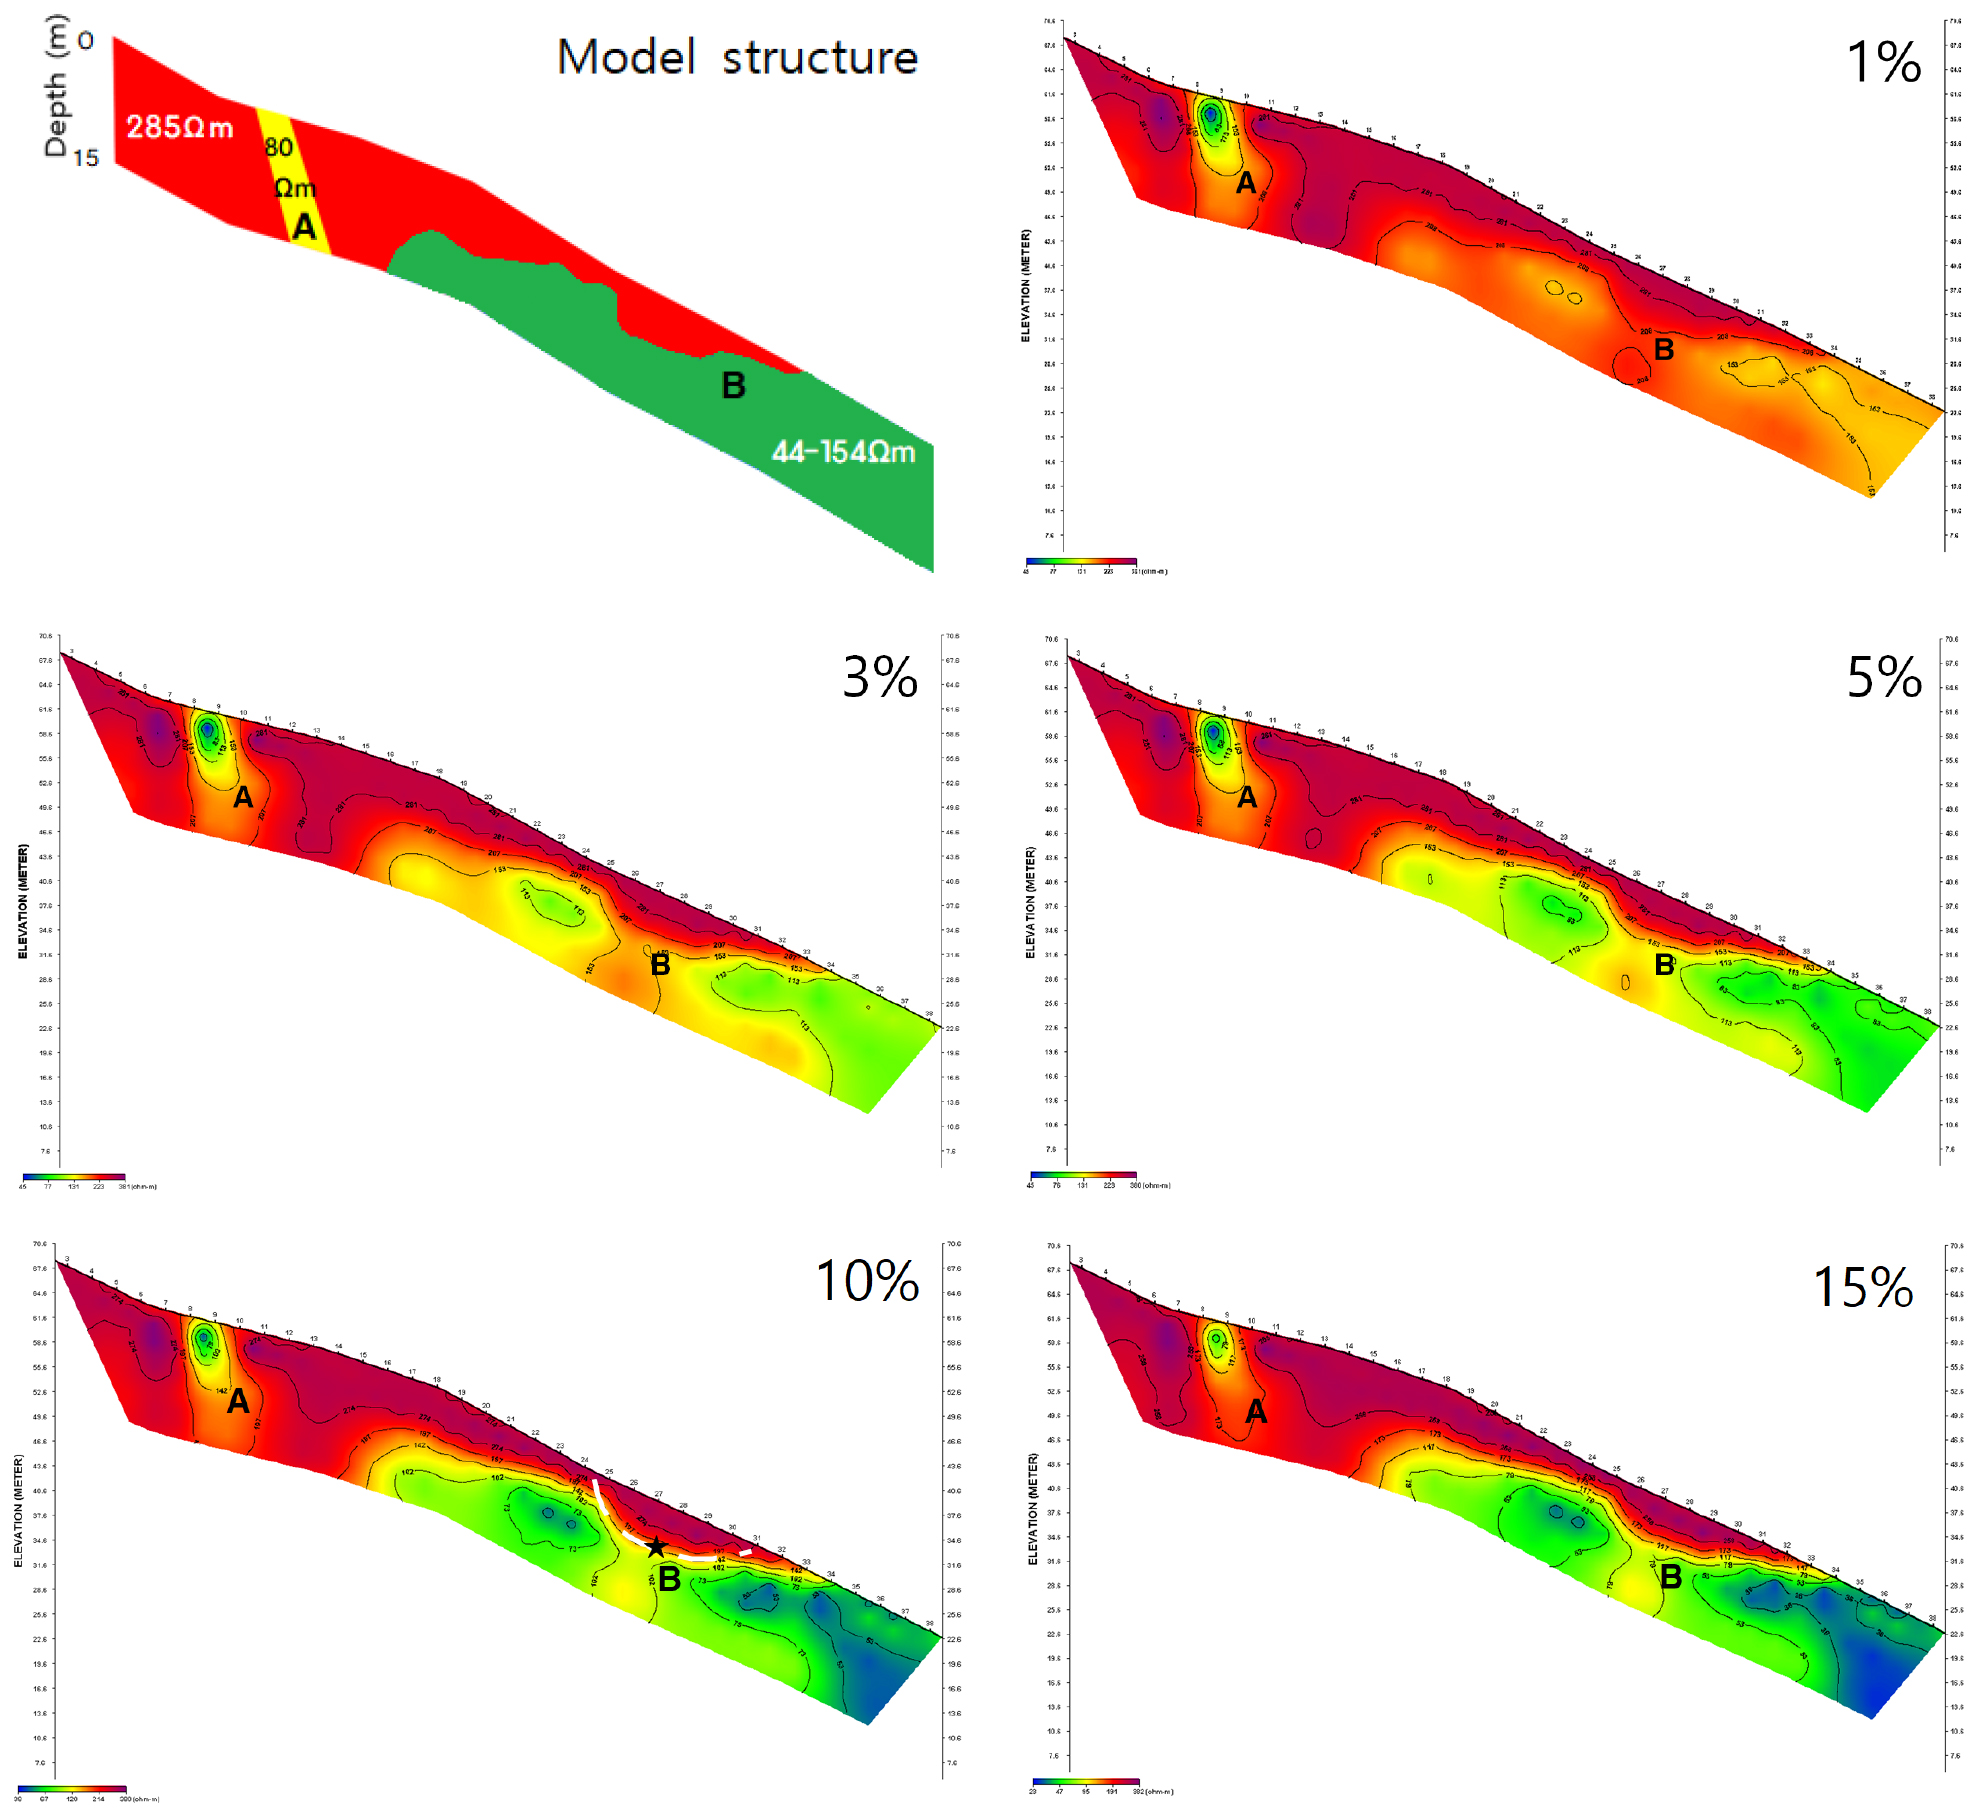
Fig. 9.
Panel tests for investigating the clay mineral contents of the weathered zone. The image correlation test between field data and theoretical structure with varying clay mineral contents (1, 3, 5, 10, 15%) provides the best resistivity panel with optimum value 10% of clay mineral content of the weathered zone. The point ★ is likely to be the natural toe abutment for preventing the downward development of geological weak zone in curved failure process (indicated by the white broken line).
Slope Failure Model and Conclusions
A combination of seismic refraction survey, electrical resistivity method, and integration of borehole data has been used for ground exploration to investigate slope surface failure. Electrical resistivity test is the most suitable method as this method can reflect the subsurface water condition and clay-mineral contents which are the key parameters for the land-creeping materials (Davis and Annan, 1989; Park et al., 2004).
Therefore, the slope failure face is effectively examined in the high resolution resistivity section with the clay contents 10% of the weathered rock applied (Fig. 9). The point ★ is likely to be the natural toe abutment for preventing the downward development of geological weak zone in curved failure process (indicated by the white broken line). This interpretation is supported by the ground tension-cracks “A” downward stressing the circular slip zone “B” with a convex shape of the toe abutment.
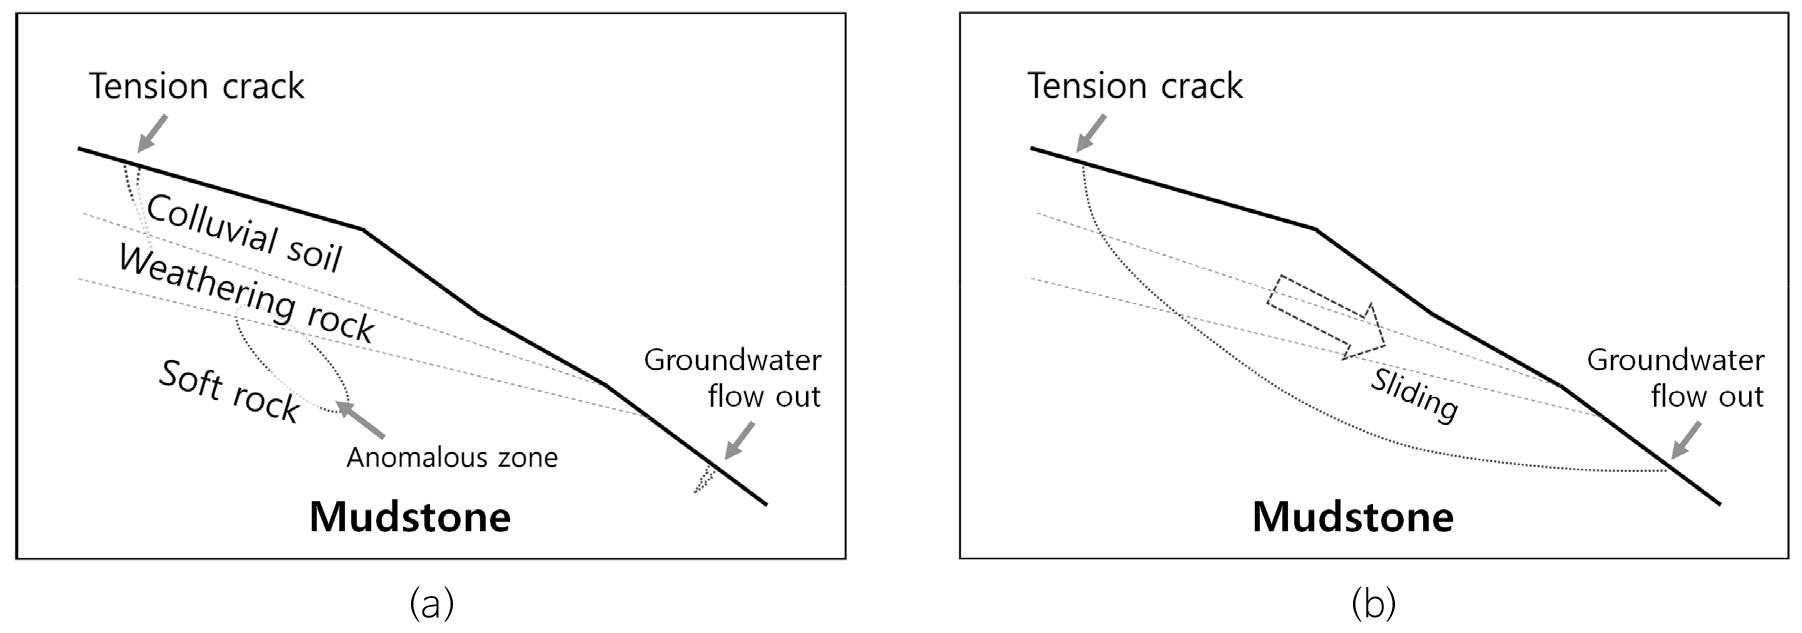
Figures 11a and 11b show schematic diagrams of subsurface structures and sliding zone, which were interpreted in this study from a combination of geophysical, geological, and geotechnical data. It is suggested that the 2017 land-creeping failure was caused by the decrease in shear strength of saturated clay of the weathered rock due to rapid volumetric expansion with water and sliding mass moving downward.
In conclusion, the proposed three steps of locating the land creeping-prone site are established in this study and tested at a Pohang site, which has experienced ground deformation triggered by the 2017 Pohang earthquake. Firstly, preliminary survey using time-lapse digital topographic map and surface precursors, secondly, regional survey with geophysical mapping and geotechnical test, thirdly, detailed survey including the borehole imaging, high-resolution geophysical mapping, and stability analysis. Based on the similarities of geophysical image patterns between ongoing land-creeping site and the experienced areas, the proposed three steps of locating the land-creeping prone site proved to be reasonable and systematic.
High-resolution seismic refraction and electrical resistivity surveys are successfully performed to delineate the geometry of complex landslides and to identify the slip zone. In addition, clay-mineral contents of the weathered rock are estimated by comparing the field resistivity structure and theoretical data, which was provided on the basis of parallel Archie equation. Seismic velocity structure provides the geological model necessary for slope stability analysis. Based on the stability analysis result, the study area has been stabilized presently after reduction of overburden load, placing the stepped reinforced retaining wall and permanent anchor, griding the vegetation space, and establishing drainage system.