

Introduction
Permafrost, Active Layer, and Patterned Ground
Permafrost and Active Layer
Formation and Types of Patterned Ground
Field Work
Survey Site
Selection of the GPR Method and Data Acquisition
GPR Data Analysis
Active Layer from CMP Acquisition
GPR Imaging of a Circular Patterned Ground Structure
Discussion and Result
Introduction
Quantification of the changes in permafrost features, such as the active layer thickness and patterned ground structure, is important for defining permafrost evolution and predicting the effects of these changes on climate change, the carbon cycle, and the water exchange process. Therefore, the active layer of the permafrost and its associated features, such as patterned ground, are important research topics (Osterkamp and Burn, 2003; Godfrey et al., 2019) that will assist in obtaining a better understanding of the potential role of permafrost in future global climate change and developing effective approaches for geotechnical projects (Woo, 2012; Campbell et al., 2018).
Sorted surface patterns of soil and stones are relatively common in the Artic, and often have either circular, elliptical, polygonal, or stepped shapes. These patterns develop in cold regions where the soil is subjected to repeated freezing and thawing processes (Kessler et al., 2001; Woo, 2012).
There is well-developed patterned ground with distinct geometric shapes in the southwestern part of the Barton Peninsula, King George Island, Antarctica (Choi et al., 2008; Jeon et al., 2009). Choi et al. (2008) conducted optical dating of the sorted circles in this region and proposed that till sediments form a sorted soil through repeated freeze-thaw cycles on the flat areas. Jeon et al. (2009) analyzed that the observed patterned ground type was generally associated with the surface slope gradient: circular (<5°); polygonal (dominant on gentle slopes: <10°); and stepped types (common on steep slopes: >10°).
Electrical resistivity, seismic, and ground penetrating radar (GPR) methods are the most employed geophysical methods for mapping the active layer (including patterned ground) and permafrost due to the large contrasts in electrical resistivities, seismic velocities, and dielectric constants, respectively, between the active layer and underlying permafrost (Godfrey et al., 2008, 2019; Briggs et al., 2017; Farzamian et al., 2020; Kim et al., 2020, 2021).
Here we employ GPR imaging to investigate the structure of a selected sorted circle near King Sejong Station, Antarctica, with GPR data acquired in bistatic mode (common mid-point, CMP) for velocity sounding and monostatic mode (common offset) for delineating the reflections from the key subsurface interfaces: the active layer-permafrost boundary; organic layer-soil horizon within the active layer; and frozen rock-fracture-filled ice horizon within the permafrost. Complementary electrical resistivity tomography was not conducted in this study due to the very high electrical contact resistance in the near surface, particularly in the gravel-rich zone. We also examine the boundary between the silty zone and stone border in the radar amplitude map at the assumed thawing depth since there would be a distinct variation in radar amplitude between the fine-grained silty zone and coarse-grained stone border. This amplitude map is constructed from all of the radargrams that were acquired along the twenty-eight GPR profiles. We then analyze and compare two representative traces from fine-grained soil and coarse-grained stone in terms of their dominant frequencies.
Permafrost, Active Layer, and Patterned Ground
Permafrost and Active Layer
Permafrost is bedrock, organic matter, and/or other earth material that persists at or below 0°C for at least two consecutive summers (Woo, 2012). Over half of the global permafrost distribution is found across Canada and Russia, most of Alaska, and Northeast China, with alpine or mountain permafrost found at high elevations in the middle and low latitudes.
Permafrost terrain consists of an active layer at the surface that undergoes seasonal freeze-thaw cycles and a deeper persistent, frozen permafrost layer (Fig. 1). The top of the permafrost (permafrost table) corresponds to the base of the active layer, and the base of the permafrost corresponds to where the ground temperature rises above 0°C at depth (Osterkamp and Burn, 2003). Patterned ground forms within the active layer (Fig. 1) owing to continuous cycles of refreezing, ground ice formation, melting, and mass wasting (Woo, 2000).
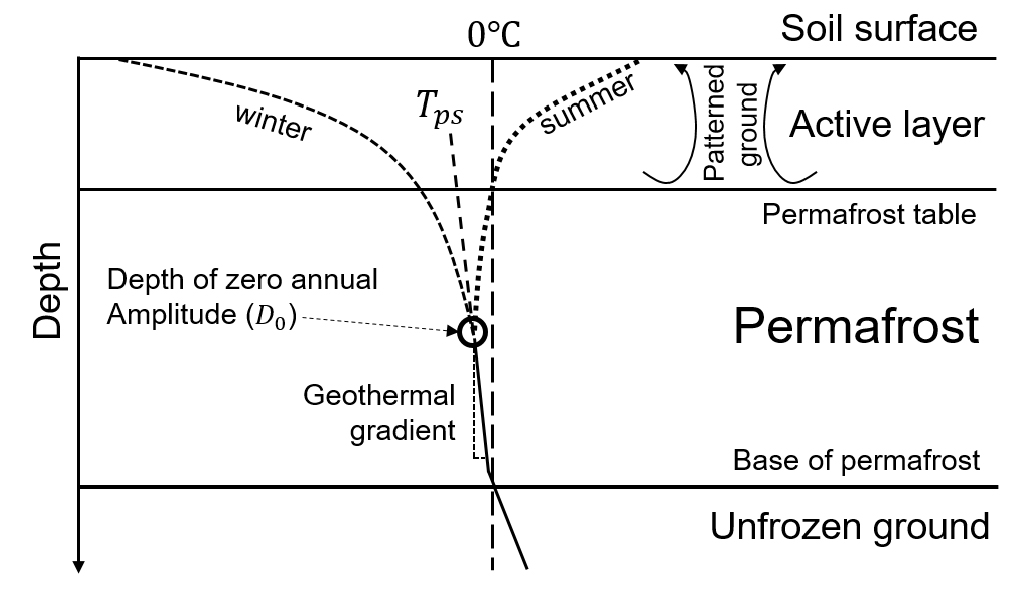
Fig. 1.
Schematic temperature profiles through the active layer and permafrost. is the annual mean permafrost surface temperature, and is the depth of zero annual amplitude. Patterned ground forms within the active layer (modified from Kim et al., 2020).
Formation and Types of Patterned Ground
Patterned ground is a type of ground surface that develops mainly in permafrost areas and exhibits a regular pattern owing to an orderly arrangement of fissures, coarse materials, and/or vegetation. The traditional hypothesis is based on frost heaving dilation (Lachenbruch, 1962; Woo, 2012), whereby soil cracks form via either freeze-thaw and wetting-drying cycles, or frost heaving that dilates the unconsolidated materials. These cracks provide favorable locations for water infiltration, storage, and flow. The areas between the cracks are subject to frost heaving, which then produces the mildly domed profiles.
A recent hypothesis involves convection in the active layer (Hallet, 2013; Fig. 2a). The saturated soil near the ground surface warms during the day, whereas any water at depth remains colder during the summer. The colder water at depth is less dense than the water near the surface since water is most dense at 4°C, such that this deeper water drives convection. Cryoturbation in the form of soil upwelling occurs near the center of the convection cell, with subsidence at the periphery of the fine-grained domains. Fig. 2b shows the strong velocity gradients near the stone-soil interface and roughly uniform upward motion in the central region of the soil domain. Sorting of the soil particles occurs when the soil particles convect with the soil water.
Sorting and soil convection produce sorted circles, elongated ellipses, and polygons, with the resultant shape depending mainly on the ground slope gradient (Woo, 2012). The types of patterned ground observed near King Sejong Station can be classified into circular (Fig. 3a), elliptical (Fig. 3b), and polygonal types (Fig. 3c) based on the shapes of the stone borders. Circular patterned ground is usually observed on flat ground and consists of fine-grained central parts with pebble boundaries; these features rise ~10 cm above the surrounding surface. Elliptical and polygonal grounds form on mildly sloping ground (5~10° slopes) that is aligned with the long axes of the border stones.
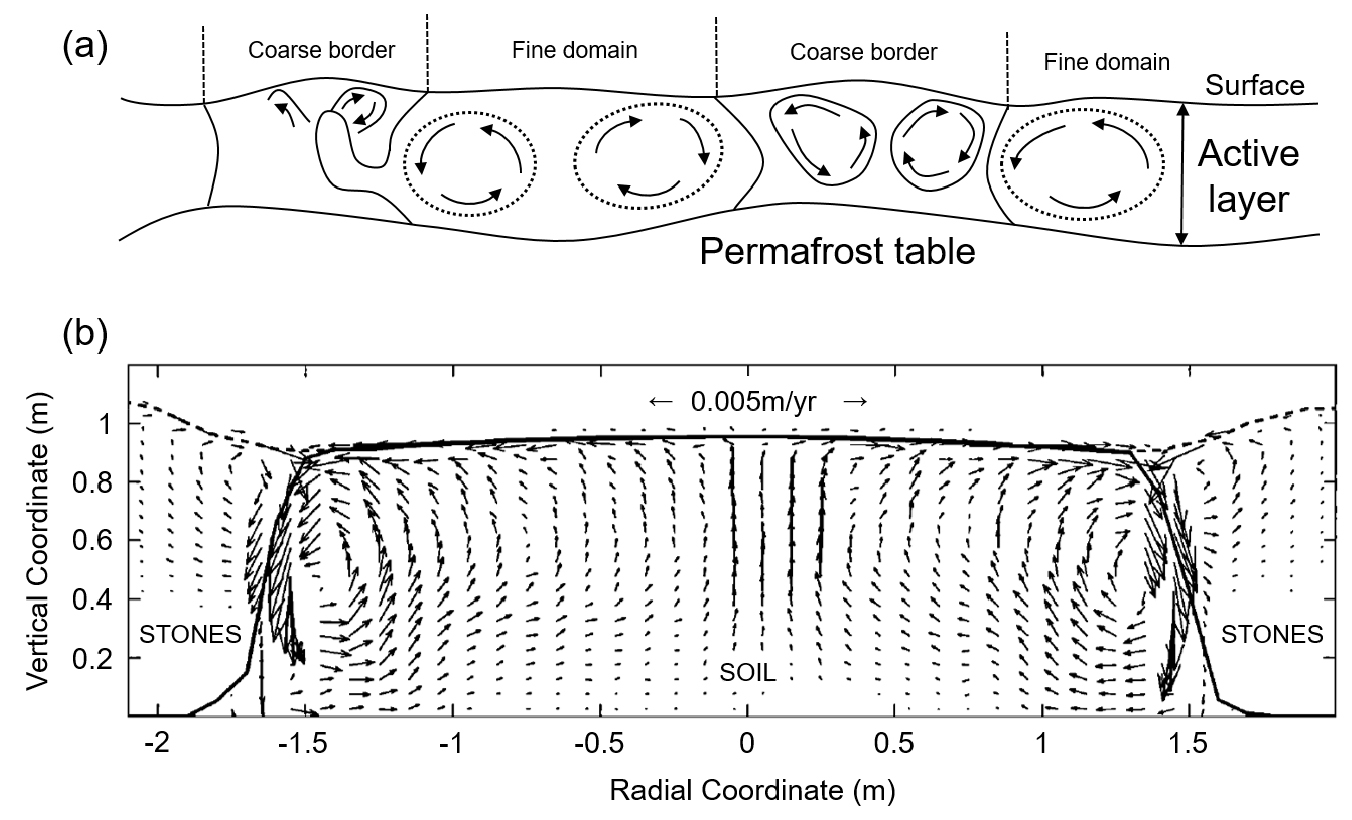
Fig. 2.
(a) Idealized long-term soil motion for a convection-like model. The base of the active layer, which is associated with the patterned ground, possesses a convex-down shape in the fine-grained domain (modified from Hallet, 2013). (b) Velocity vectors for a typical convection-like model in a cross section through a well-developed, sorted circle (modified from Kessler et al., 2001). Note the fine-grained soil in the lower central zone and the coarse-grained stones along the higher edges.
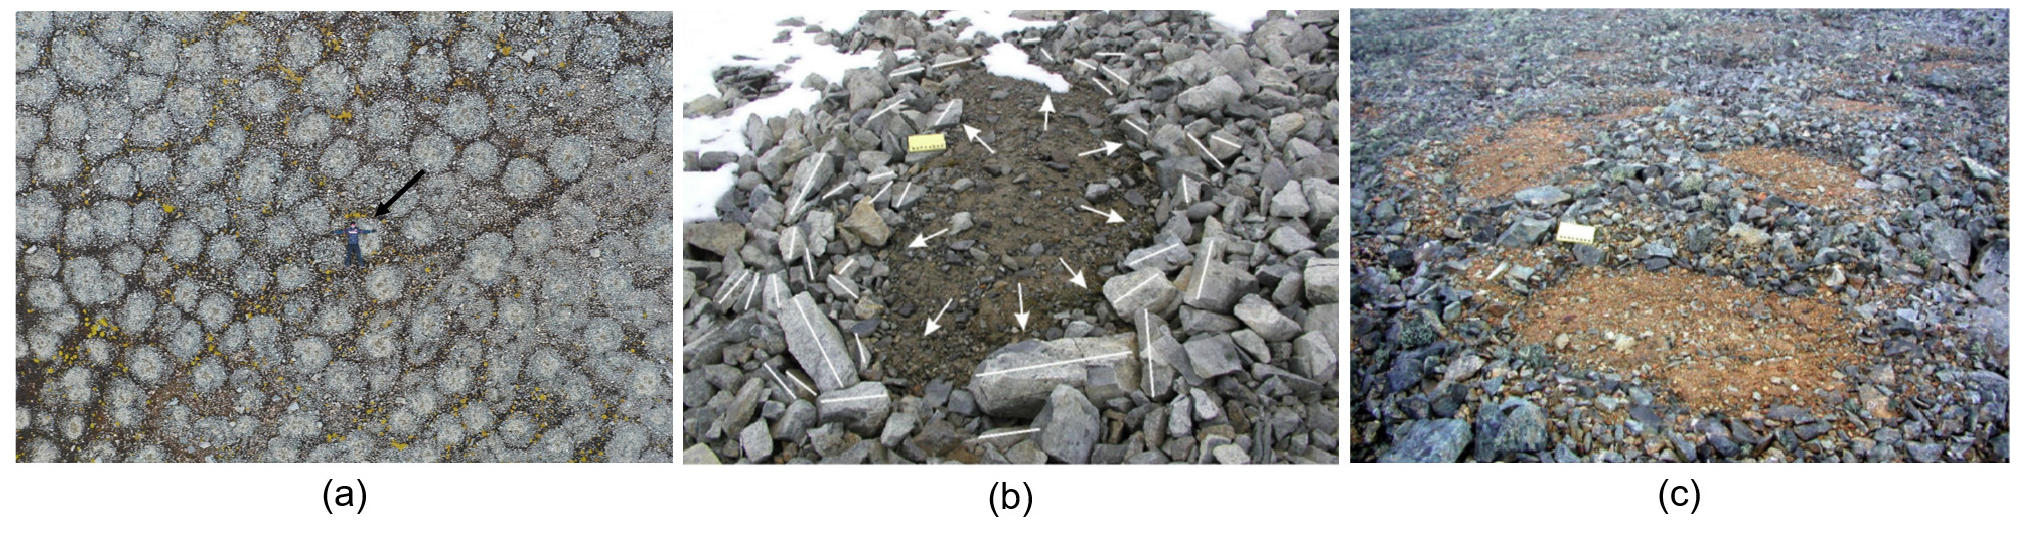
Fig. 3.
Example patterned ground features near King Sejong Station, Antarctica: (a) circular (drone picture from this study); (b) elliptical; and (c) polygon types (after Jeon et al., 2009). Note the person indicated by the black arrow in (a) for scale.
Field Work
Survey Site
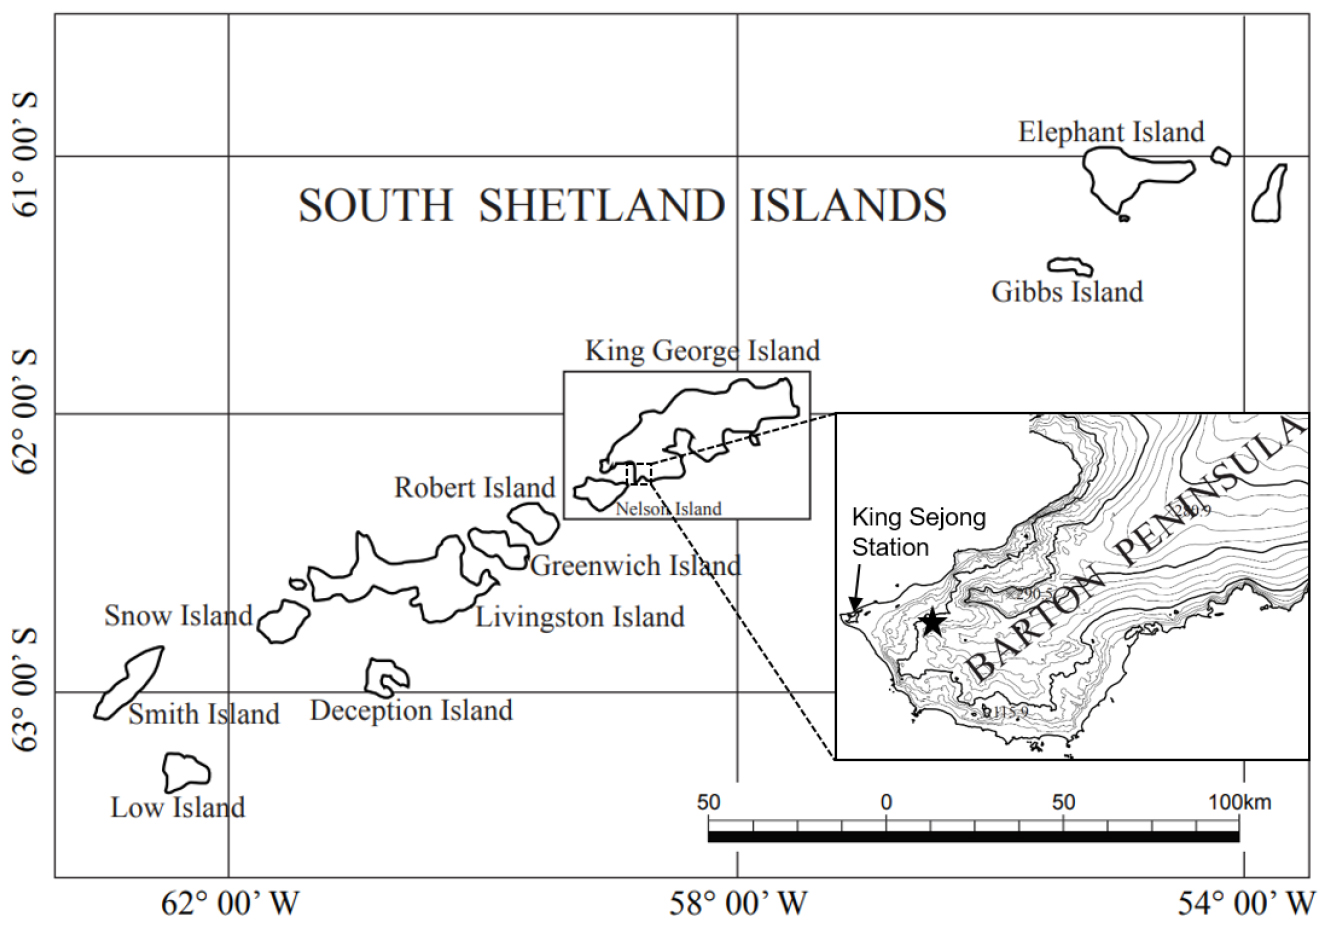
Our field area is located on the Barton Peninsula (62°13'S, 58°47'W), King George Island, South Shetland Islands, Antarctica (Fig. 4). The distance between the site and the King Sejong Station is about 1 km. Volcanic rocks cover the majority of the Barton Peninsula and consist mainly of basalt, basaltic andesite, agglomerate, and tuff. Plutonic rocks, including granodiorite and diorite, can also be seen across the northwestern sector of the Peninsula (Kim et al., 2020).
Most of the patterned ground types (circles, ellipses, polygons, steps) are well developed across the southwestern Barton Peninsula (Jeon et al., 2009), and possess stone borders consisting of clast-supported pebbles/boulders that surround central sections of sandy-silty material.
Selection of the GPR Method and Data Acquisition
The dielectric constant, which governs the propagation speed of radar waves, changes significantly between frozen and unfrozen material, with common relative dielectric constant () values in the 2~8 range for permafrost, around 25, 5, and 30 for the active layer, gravel, and saturated silt and clay, respectively (Reynolds, 2011; Kim et al., 2014).
We investigated the shallow subsurface structure of circular patterned ground using very-high-resolution GPR. On the other hand, due to the high electrical contact resistance of the boulders electrical resistivity tomography was not conducted during fieldwork.
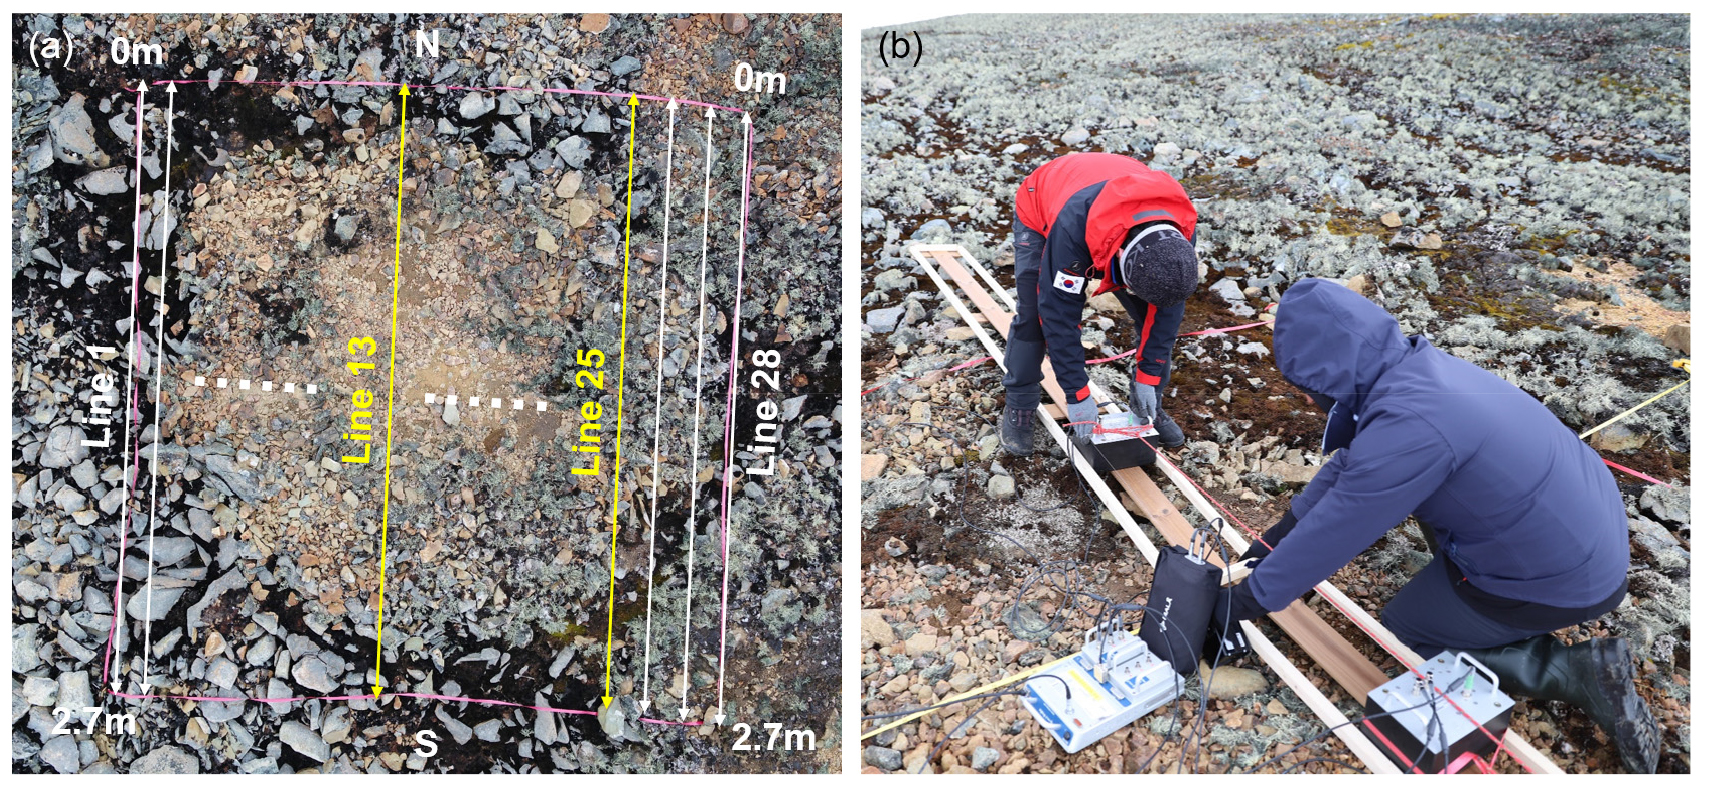
Fig. 5.
(a) Closeup image of the circular patterned ground, consisting of a fine-grained central zone surrounded by stone borders, which was selected for the GPR survey. Twenty-eight parallel N-S-oriented GPR lines were acquired. (b) Photograph of the bistatic (CMP-mode) data acquisition, with the transmitter and receiver moved along a wooden frame on the ground.
We acquired the GPR profiles across an area of circular patterned ground with an approximately 1.7-m-diameter feature. We conducted the data acquisition using a bistatic MALA system with a 400-MHz antenna during the early thawing season (December 25, 2018), with the primary goal of delineating the thawing depth beneath the patterned ground. We acquired 28 2.5-m-long, N-S-oriented parallel lines, with a 2.5-cm station interval and 0.1-m inter-line spacing employed (Fig. 5a). We placed a wooden frame on the ground (Fig. 5b) to reduce the coupling problem due to the uneven ground without distorting the radar signals. However, this introduced a time delay that needed to be accounted for during the analysis.
GPR Data Analysis
Active Layer from CMP Acquisition
Common mid-point (CMP) acquisition was conducted at a 2.5-cm interval to accurately constrain the active layer velocity. Both the transmitter and receiver are moved away from each other in a symmetrical manner during CMP acquisition, such that the imaged midpoint occurs at a fixed location (Fig. 6a); the central station along Line 13 is the CMP location for the radargram shown in Fig. 5a.
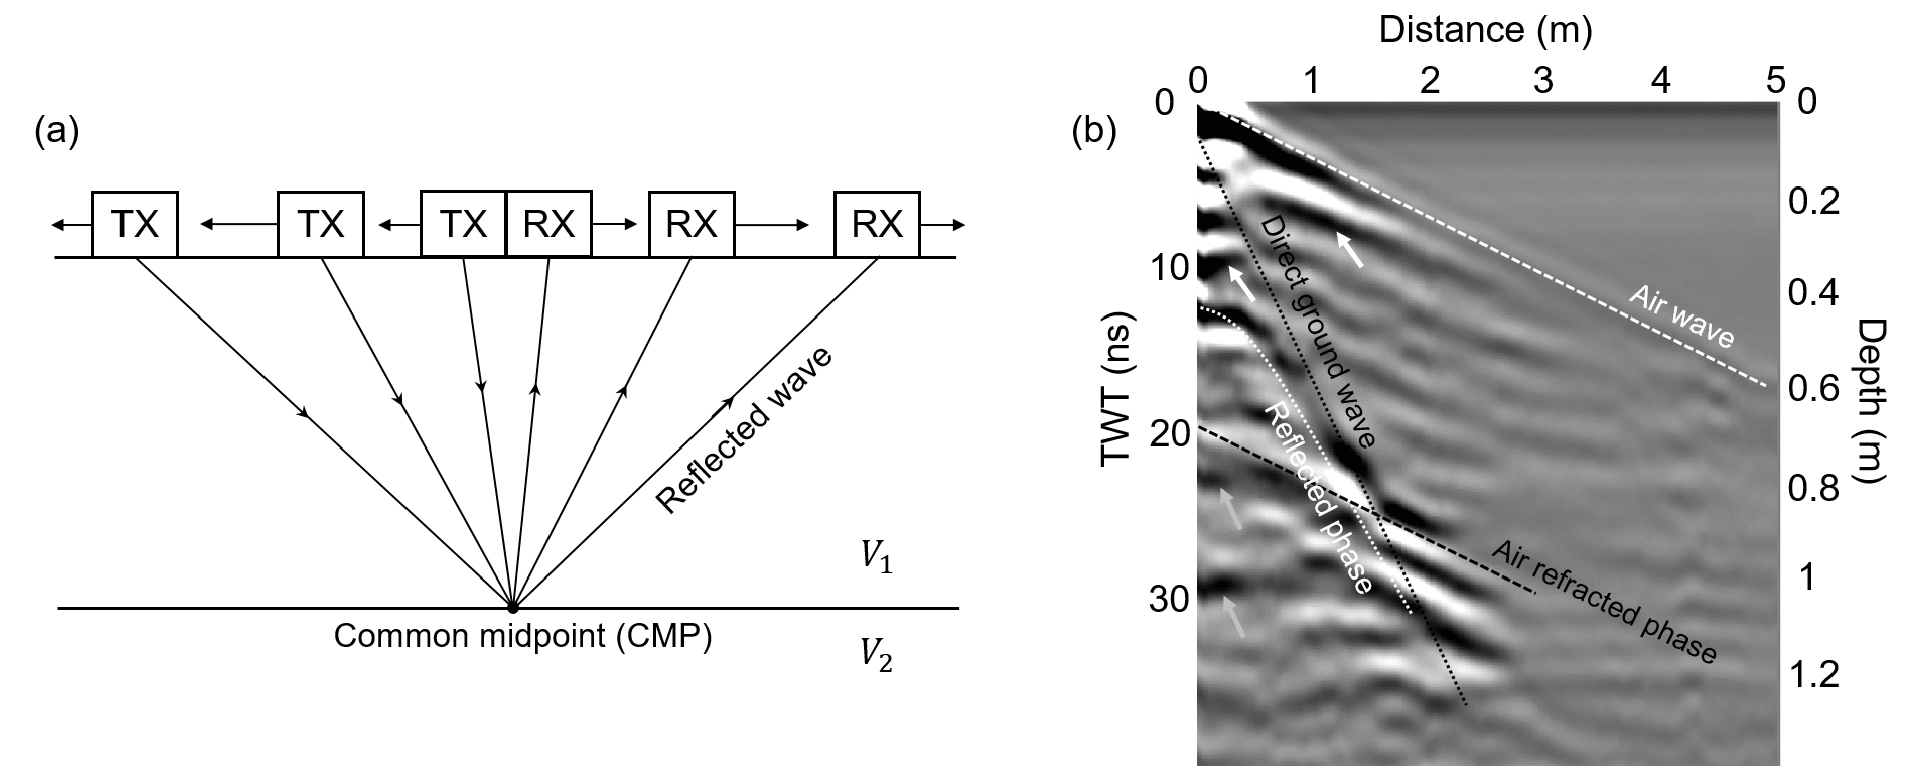
Fig. 6.
(a) Diagram of CMP acquisition, whereby both the transmitter (TX) and receiver (RX) move away from each other to image a fixed common mid-point. (b) Selected CMP gather from Line 13 (Fig. 5a), with the reflection hyperbolas for the base of the active layer and upper soil horizons, and the lower fractured rocks in the permafrost indicated by white and gray arrows, respectively. An RMS velocity of 69 mm/ns is estimated for the active layer (white dotted hyperbola), which is almost the same as the NMO velocity of the direct ground wave (black dotted line: 69 mm/ns). Two straight-line events (white and black dashed lines) with a velocity of 300 mm/ns represent the air wave. TWT: Two-way travel time.
The normal moveout (NMO) time is defined as (Fig. 6b):
where, is the offset of the reflection hyperbola, is the root-mean-square (RMS) velocity down to the thawing depth, which is estimated to be ~69 mm/ns and is also used for the radar time-depth conversion, and is the zero-offset time. Two evidences validate 69 mm/ns as the velocity of the active layer: the direct wave has a slope of 69 mm/ns (Fig. 6b), and a theoretical velocity of 60 mm/ns is calculated when using = 25 for the active layer and the following formula (Reynolds, 2011):
The hyperbola that marks the base of the active layer possesses a zero-offset time of 13 ns (white hyperbola in Fig. 6b), and the upper hyperbolas denote reflections from soil horizons (including the organic layer) within the active layer (white arrows in Fig. 6b). The discontinuous lower-frequency hyperbolas with zero-offset times that are >13 ns are likely to arise owing to fractured and frozen rocks with ice in the permafrost (gray arrows in Fig. 6b).
GPR Imaging of a Circular Patterned Ground Structure
An approximately 1.7-m-diameter sorted circle was also surveyed in monostatic mode along the 28 parallel lines using a single transmitter-receiver system that was pulled across the ground. The central lines mainly encompass the fine-grained silty zone, whereas the peripheral lines partially cross a gravel-rich border that is approximately 10 cm higher than the sorted circle (Fig. 5a).
The radar data were processed using the REFLEX software (Sandmeier-geo Ltd., 2020), which included automatic gain control to recover the far-offset amplitudes, filtering to enhance the signal-to-noise ratio, and time-delay corrections to correct for the wooden frame. A depth conversion was performed using the velocity of 69 mm/ns that was estimated from the CMP analysis (Fig. 6b).
Two selected sections across the center (Line 13) and edge (Line 25) of the sorted circle are shown in Figs. 7a and 7b, respectively. The interface at approximately 45 cm depth, which is characterized as a convex-down feature along the central profile (Line 13), represents the thawing depth (active layer depth) (Fig. 7a); this depth reduces to 40 cm along the edge profile (Line 25) (Fig. 7b), which mostly extended along the gravel-rich border of the sorted circle. This interpretation is supported by the schematic diagram of a soil convection cell (Fig. 2a), with a convex-down feature denoting the active layer in the fine-grained silty area and a convex-up feature denoting the coarse-grained stone border. The shallower reflections (above 40 cm depth) arise from soil horizons and the deeper reflections (below 45 cm depth) in the permafrost are at almost the same depths in Figs. 7a and 7b.
We further investigate the two shallow, thin (thicknesses of approximately 10 and 12 cm, respectively) layers at 4 and 8 ns (Fig. 7a) in terms of their vertical resolution, which is a measure of the ability to differentiate between two signals that are adjacent to each other in time. The theoretical resolution can be taken as one-quarter of the wavelength of the incident radiation (Reynolds, 2011):
where, is frequency. The vertical resolution of a 400-MHz signal and a velocity of 69 mm/ns is 4.3 cm, which indicates that 10-cm-thick layers can be confidently resolved in this study.
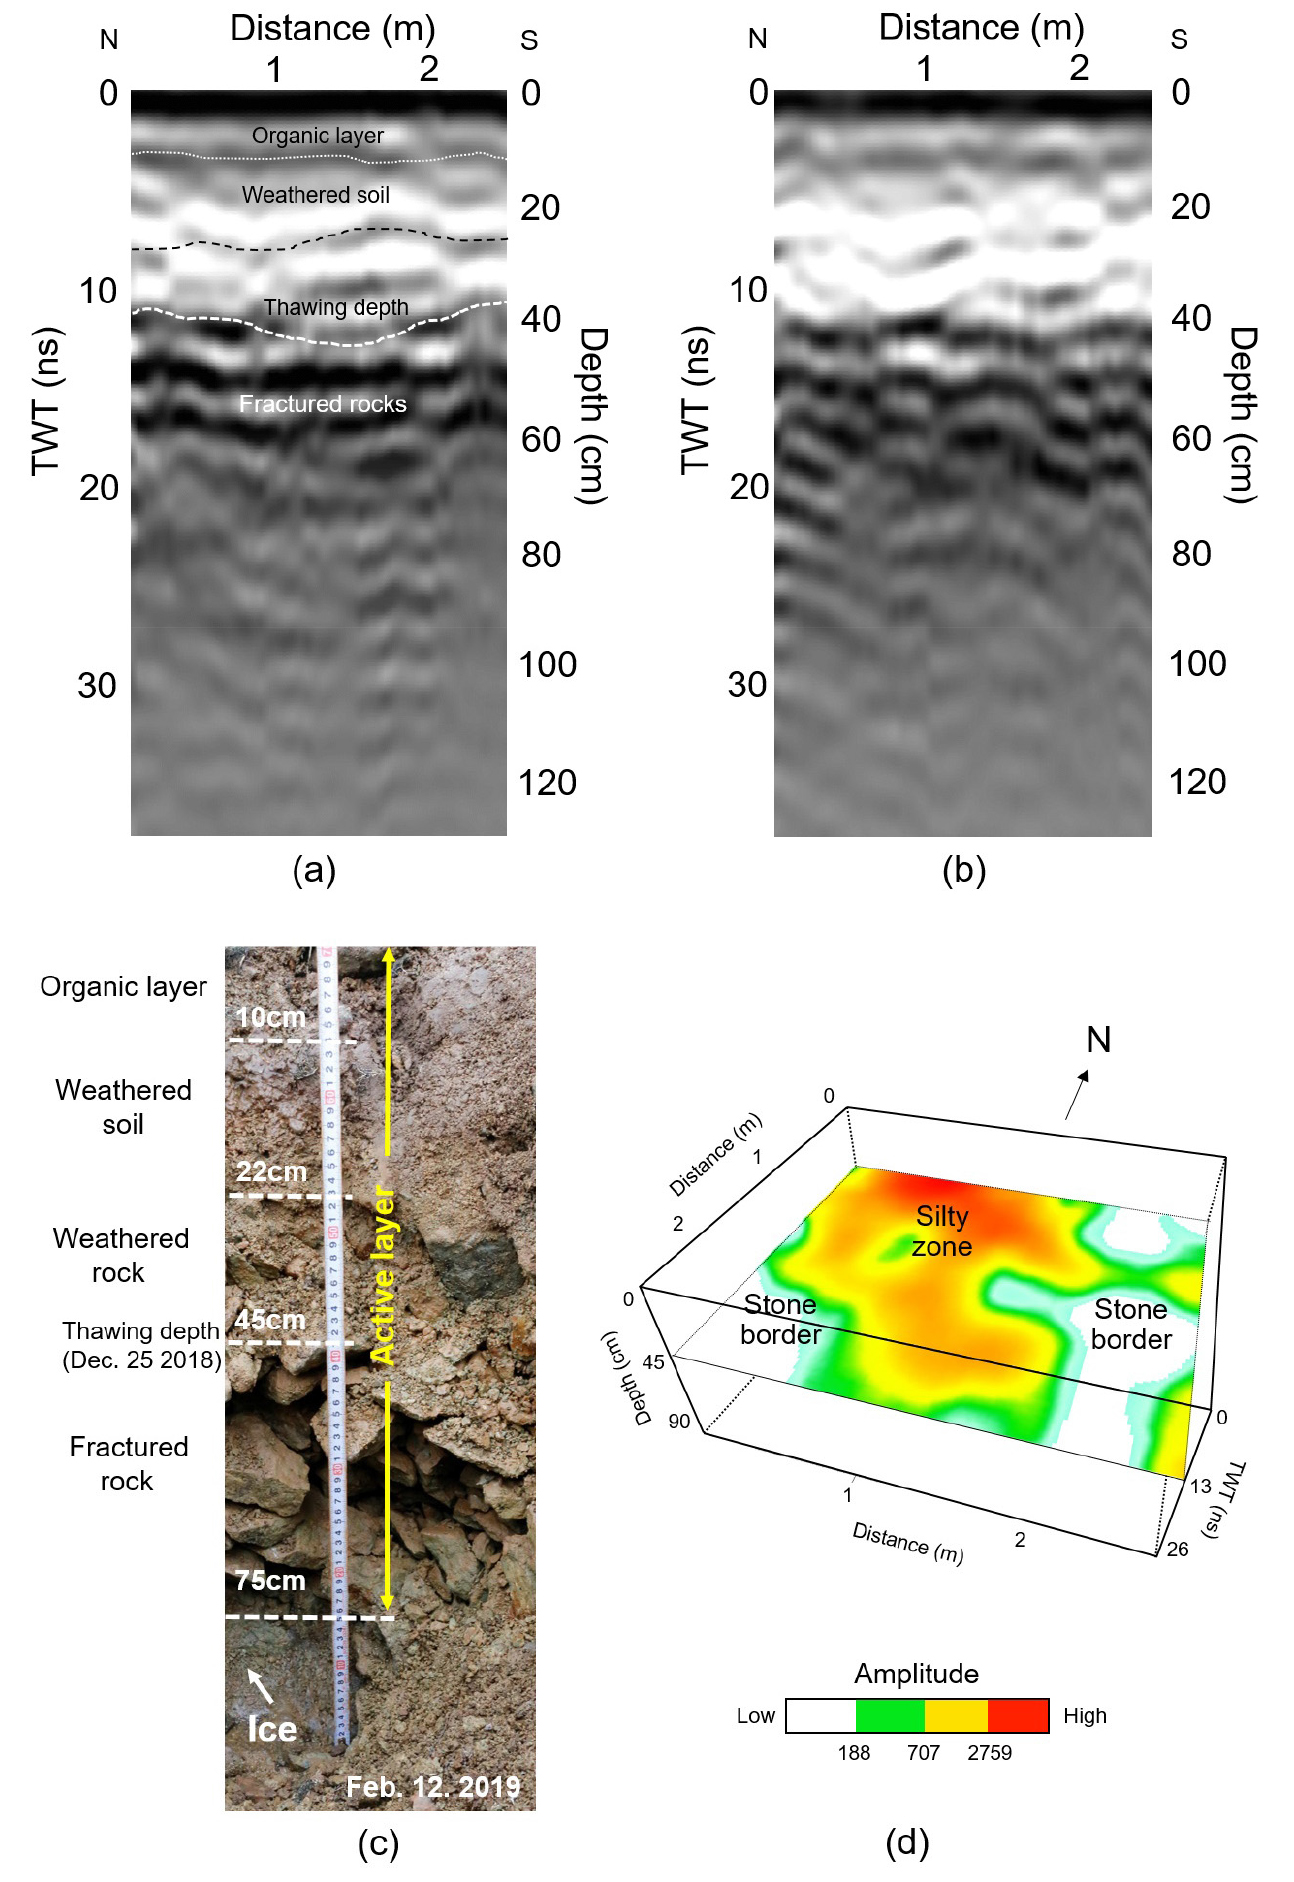
Fig. 7.
GPR reflection profiles for (a) Line 13 and (b) Line 25. The thawing depth associated with patterned ground is represented by the gray dashed line with a convex-up shape at the edges (coarse-grained stone border). Most of the layers visible in (a) and (b) correspond to the reflection hyperbolas in the CMP gather shown in Fig. 6b: the base of the active layer; the upper soil horizons (including the organic layer); and the lower fracture zones in the permafrost. The identified reflections are comparable to the (c) pit data that were acquired two months after the GPR survey to recognize the frozen rock. Note the increased depth to the ice-rich frozen rock (~70 cm) due to an increase in the ground temperature during the thaw season. (d) Amplitude map of the GPR profiles at 45 cm depth. Lower amplitudes at the edges are associated with intense energy dissipation due to wave propagation through the coarse-grained gravel border (Fig. 5a). TWT: Two-way travel time.
Discussion and Result
The detected GPR reflection positions are comparable to the depths to the organic layer, weathered soil, active layer (70 cm depth), and fractured rock that were observed in a nearby pit that was dug to recognize the frozen rock (Fig. 7c). This pit was unfortunately dug in the middle of the thawing season (February 2019), two months after GPR survey. Frozen rock with ice was encountered at 70 cm depth. This observed deeper base of the active layer is likely due to the increasing ground temperature during the thawing season, whereas the 40-cm-thick active layer from the GPR experiment was imaged in the early thawing season (Fig. 7a).
Both the active layer feature and base of the patterned ground across the survey area are investigated using a radar amplitude map at 45 cm depth (Fig. 7d). The lower amplitudes along the periphery of the study area are associated with severe energy absorption during the wave propagation through the coarse-grained gravel border of the sorted circle.
This energy absorption phenomenon is also examined in the frequency spectra of two selected zero-offset traces: one from Line 13 (in the silty zone) and another from Line 25 (in the stone border; Fig. 8a). The dominant frequencies of the zero-offset traces from Lines 13 and the Line 25 are around 340 and 230 MHz (Fig. 8b), respectively. The lower frequencies along Line 25 trace are explained by the rapid absorption of the higher frequency energy through porous media, such as the gravel-rich border.
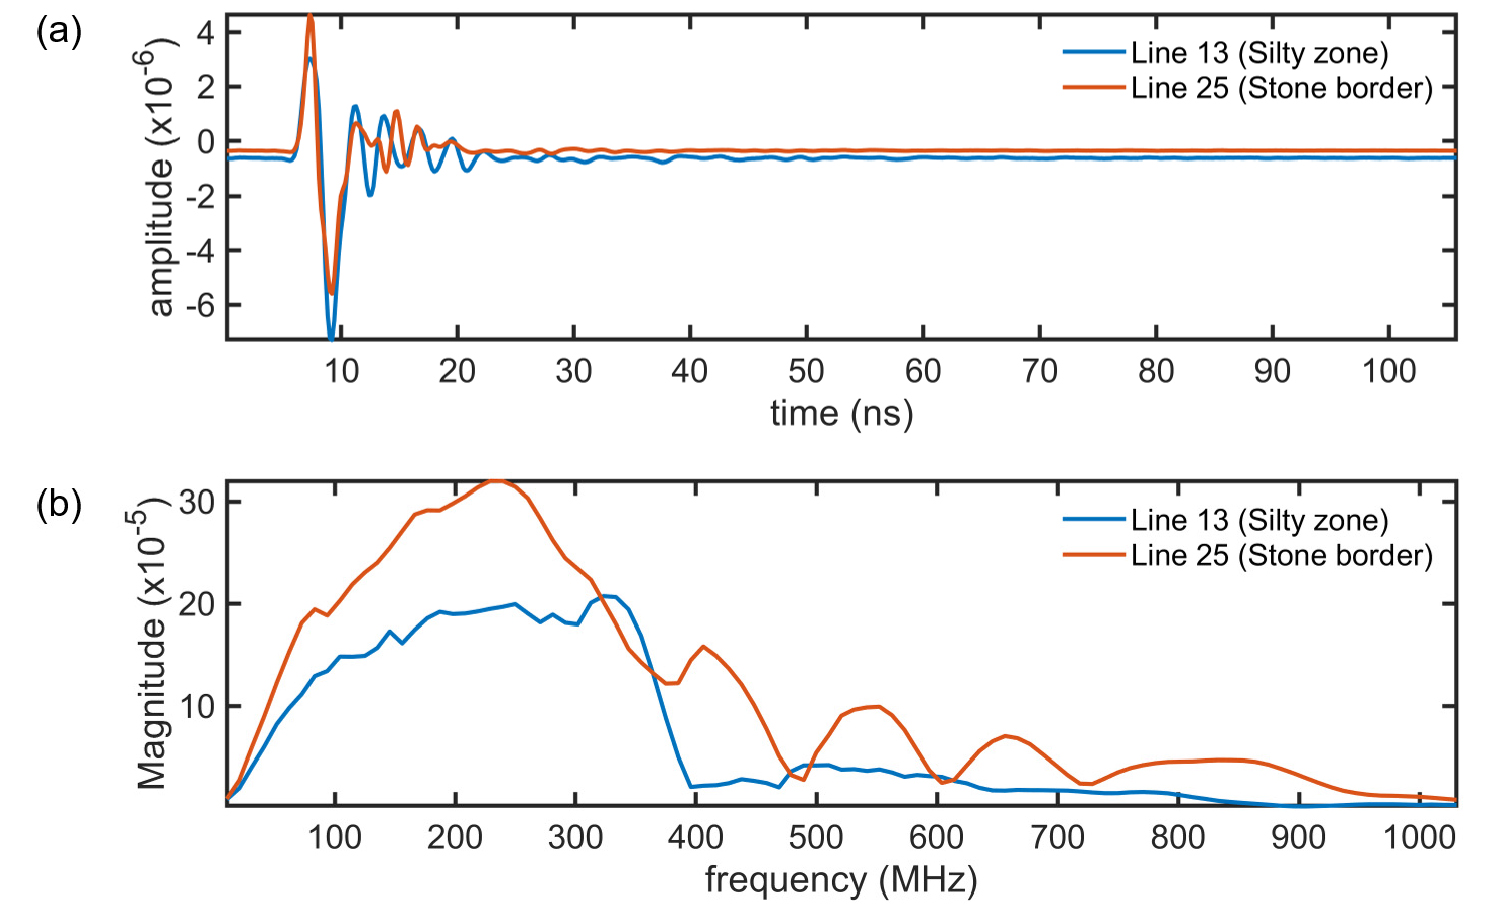
Fig. 8.
(a) Two selected zero-offset traces from Lines 13 (silty zone) and 25 (stone border). (b) Dominant frequencies of the selected zero-offset traces from Lines 13 (340 MHz) and 25 (230 MHz). The lower dominant frequencies for Line 25 trace are explained by the rapid absorption of the higher-frequency energy through porous media, such as gravel-rich material.
In conclusion, we have successfully delineated the subsurface structure of a sorted circle associated with circular patterned ground near King Sejong Station, Antarctica. We acquired a detailed radar velocity-depth profile from bistatic CMP imaging and a series of monostatic GPR profiles to accurately image the base of the active layer and top of the permafrost.
The correlation strategies developed here for very shallow and thin GPR reflection data are readily applicable to various types of patterned ground, and complementary time-lapse imaging can be conducted when additional information from the electric resistivity method becomes available after solving the electrical contact resistance problem.
