

Introduction
Regional Geological Setting of the Karnali Watershed
Methodology
Results
Description of Samples
Size and Shape
Composition of Sands from the Karnali River
Discussions
Grain Shape Variation
Grain Size Measures and Textural Maturity
Compositional Trend
Tributary Influence on Composition
Shift in Detrital Modes
Conclusions
Introduction
The Himalayan rivers flow through steep valleys with active glacio-fluvial processes, intense monsoonal rainfall and frequent seismic events contributing to high erosion rates (Hasnain and Thayyen, 1999; Singh et al., 1999; Bookhagen et al., 2005; Bridge, 2009). The size of the eroded materials vary from boulders to fine clay size (Thiede et al., 2004; Blöthe and Korup, 2013). Downstream fining of sediments is a widely accepted concept in fluvial sedimentology, because of longitudinal decreases in stream power (Church, 2006; Ferguson et al., 2006; Blum et al., 2013). Transportation of grain enhances roundness through abrasion and selective transport processes (Plumley, 1948; Friedman and Sanders, 1978; Folk, 1980). Size, shape, and compositional distribution vary based on source rock, topographic relief, and climate (Johnsson, 1993; Arribas et al., 2007; Lupker et al., 2012; Garzanti, 2016; Fielding et al., 2018; Yang et al., 2020; Cruz et al., 2023).
Textural maturity increases when sediments are well-sorted, well-rounded, and clay-poor, whereas compositional maturity increases when durable minerals dominate (Folk, 1951; Dott, 1964). Both tend to increase with transport energy, distance, and whethering, but these are conceptual guides rather than strict rules (Garzanti, 2017). The role of climate in enhancing the compositional maturity is crucial. Feldspars and micas break down to clays when sediments get exposed on flood plains for longer time. This process increases compositional maturity by leaving more durable quartz (Johnsson, 1993; Yang et al., 2020).
The tributary derived sediments near confluences also reverse the maturity trend (Dorsey, 1988). Likewise, the presence of dams and other human interventions can significantly alter these natural trends (Brenna et al., 2020). This highlights the complex interplay between natural processes and anthropogenic influences on sediment characteristics along river systems.
The detrital modes can reveal the tectonic history of source area, including the tectonic environment and sediment recycling processes (Suttner et al., 1981; Suttner and Basu, 1985; Dickinson, 2004). In tectonically stable areas, longer transport distances lead to more mature, quartz-rich sediments (McBride and Picard, 1987; Johnsson et al., 1991). Conversely, active tectonic settings with high erosion and short transport distances yield immature sediments rich in feldspar, mica, and rock fragments (Potter, 1994; Le Pera and Arribas, 2004; Garzanti et al., 2013, 2019). However, the composition of deposited sediment varies with grain size and sorting rather than the source rock lithology (Garzanti et al., 2008; Garzanti et al., 2010; Stutenbecker et al., 2023).
The Himalaya, one of the most geologically active mountain ranges globally serves as an excellent place to access maturity trend and shift in detrital mode (Najman et al., 2005; Garzanti et al., 2022). Downstream variations in texture (size, sorting, and shape), composition, and sand maturity along the Himalayan rivers help to understand detritus modification during high to low gradient transitions (McBride and Picard, 1987) and identify textural inversions (Folk, 1980; Potter, 1994).
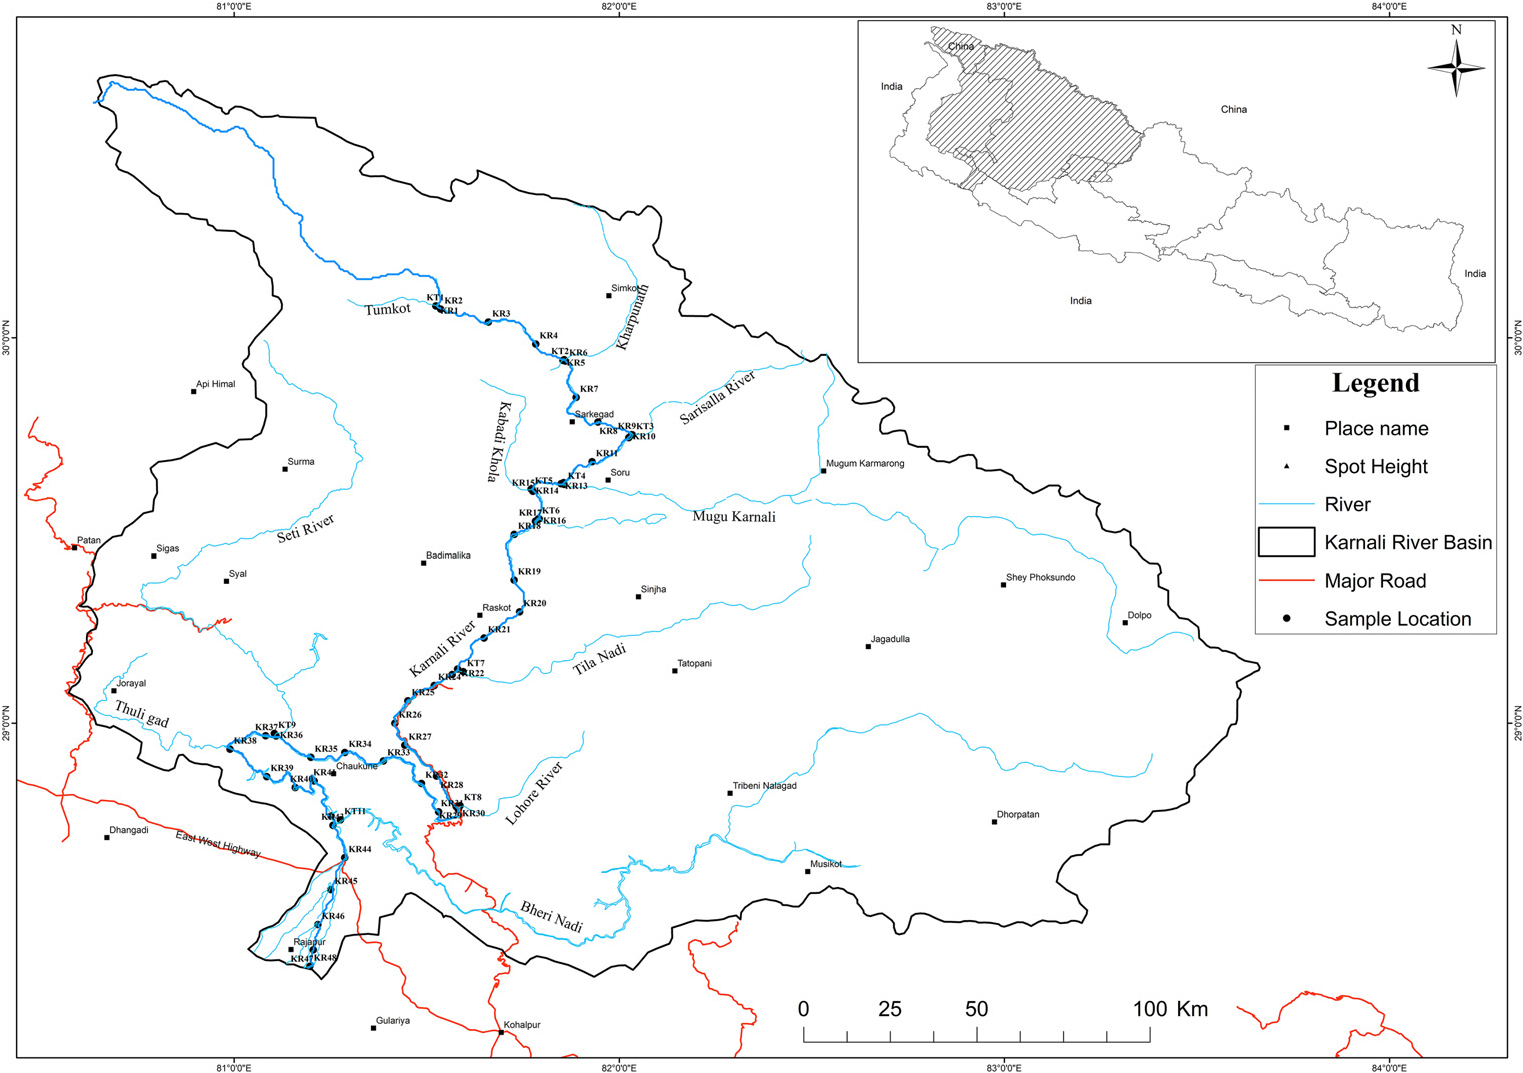
The Karnali River Basin (KRB) is the largest and the longest river system in the Nepal Himalaya. This trans-boundary river begins in China, in the glaciers of Mapchachungo, and flows through the western part of Nepal (28°20′–30°41′N and 80°33′–83°40′E) (Fig. 1). As it traverses all geological terrains of the Nepal Himalaya, it serves as an excellent case for examining sediment maturity, detrital composition and their downstream variation. Therefore, the main aims of this research are to establish status of textural and compositional maturities of fluvial sediment, and to explore detrital mode and its shift along the river or across the Himalaya.
Regional Geological Setting of the Karnali Watershed
The regional geological map of the Karnali and Far West Provinces published by the Department of Mines and Geology (DMG, 2020) has defined the geological units separated by various tectonic boundaries of the watershed area covering north to south (Fig. 2).
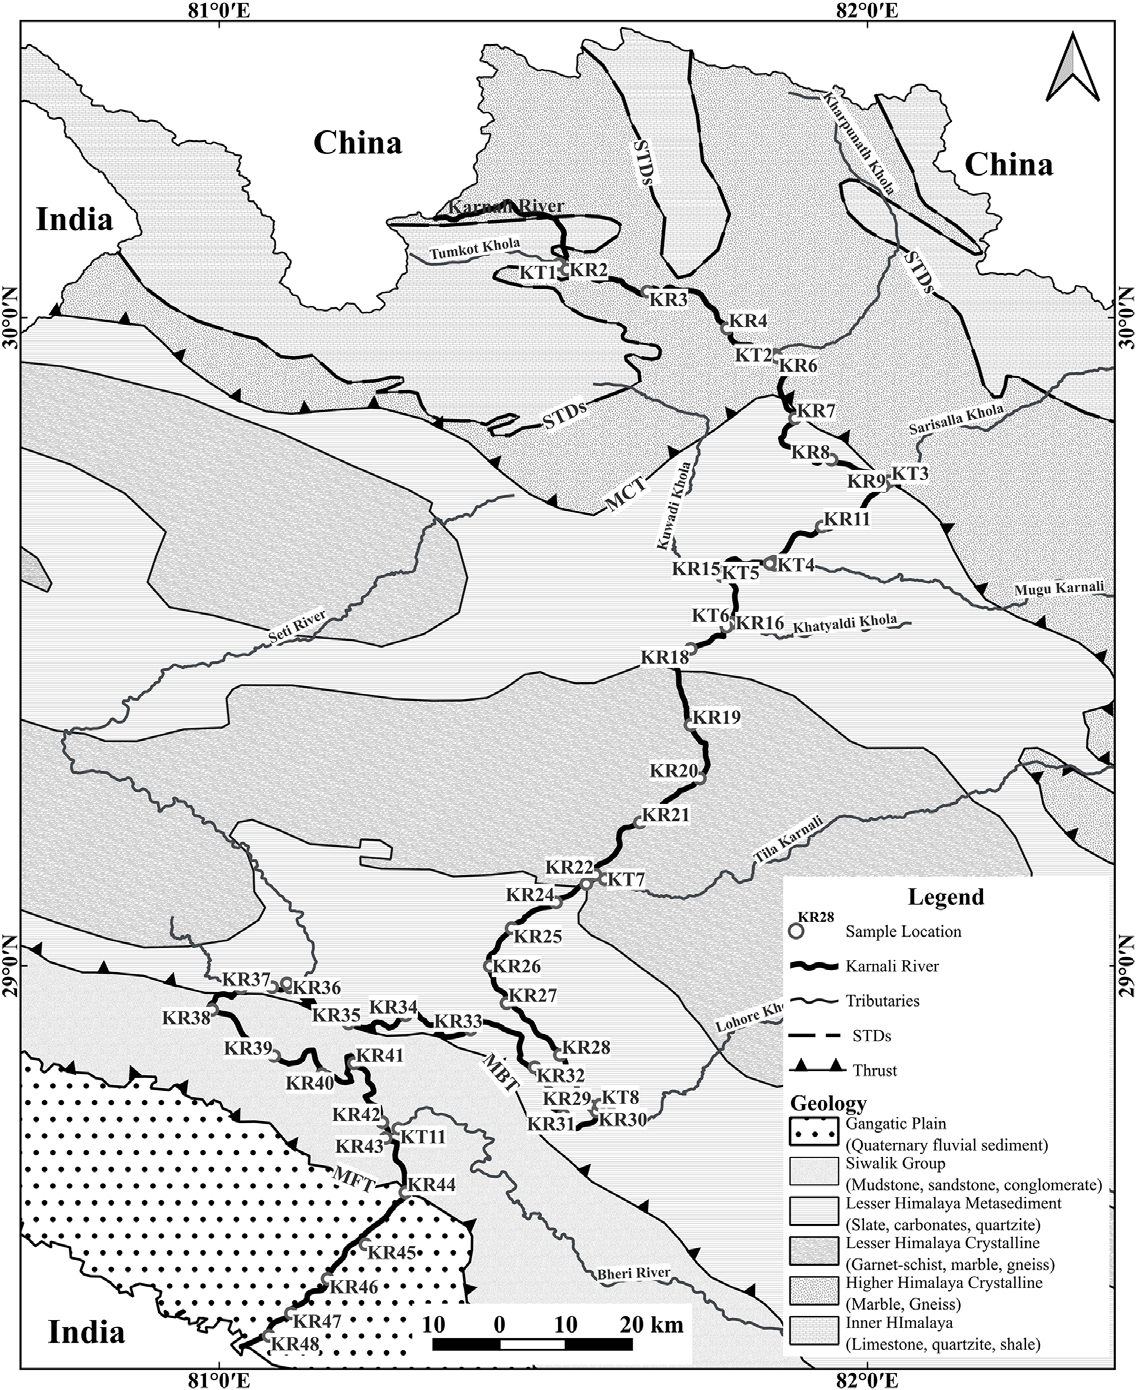
Fig. 2.
Geological map of the study area with sample location (DMG, 2020); STDS- South Tibetan Detachment System, MCT- Main Central Thrust, MBT- Main Boundary Thrust, MFT- Main Frontal Thrust.
The tectonic movement causing the collision between the two continental plates formed the Himalayan arc (Searle et al., 1997). During this process, the crustal layers were deformed to accommodate the continuous tectonic stress produced by the Indian continental plate, forming different geological structures, such as folds and faults. The thrusting of the crustal layers caused overriding of the older rock layers above the younger rock strata, which separated the rock layers into different geological units (Gansser, 1964; Valdiya, 1998). The five major geological units namely Tibetan Tethys Himalaya (TTH), Higher Himalaya (HH), Lesser Himalaya (LH), Siwalik, and the Indo-Gangetic Plain (IGP) throughout the Himalayan arc are separated by different thrust system, which are the South Tibetan Detachment System (STDS), Main Central Thrust (MCT), Main Boundary Thrust (MBT), and the Himalayan Frontal Thrust (HFT) respectively (Hagen, 1960; Gansser, 1964; Frank and Fuchs, 1970; Le Fort, 1975; Stöcklin, 1980; Kizaki, 1994; Dhital et al., 1995; Upreti, 1999; Dhital, 2015). Those thrusting activity has resulted in the present Himalayan terrain having varied mountain ranges. The topographical variation from east to west is similar throughout the region.
The Tethys Himalaya consists of Cambrian to Cretaceous-Eocene fossiliferous sedimentary rocks, including sandstone, mudstone, and limestones (Upreti, 1999). The Higher Himalaya is comprised of augen and banded gneiss along with high-grade schist, quartzite, granite and marble of Neoproterozoic to Ordovician time (Parrish and Hodges, 1996; Decelles et al., 1998). The rock units of the Lesser Himalaya consist mainly of sedimentary and metamorphic rocks, which are moderately metamorphosed due to heat and pressure (Fuchs and Frank, 1970; Stöcklin, 1980; Sakai, 1983; Tater et al., 1983; Colchen et al., 1986) with some granite, gneiss, amphibolite, and other volcanic rocks present at various stratigraphic units of the Lesser Himalaya (Pêcher, 1977; Stöcklin, 1980; Sharma and Kizaki, 1988; Upreti, 1999; Dhital, 2015). The chiefly found metamorphic rocks are slate, phyllite, quartzite, marble, and sedimentary rocks, such as limestone, dolomite, and sandstone (Fuchs and Frank, 1970; DMG, 2020). The Siwalik Group contains an unmetamorphosed sequence of mid-Miocene-Pleistocene synorogenic sedimentary rocks (Tokuoka et al., 1986; Corvinus, 1993; Corvinus and Nanda, 1994; DeCelles et al., 1998; Sah, 1998; Upreti, 1999; Paudel and Arita, 2000). The chiefly present rock units are mudstones, siltstones, shales, subordinate sandstones, and conglomerates, deposited in the Himalayan foreland (DeCelles et al., 1998; Upreti, 1999; Tamrakar et al., 2002; Ulak, 2004). The Indo-Gangetic plains exhibit fluvial sedimentation comprised of boulders, gravel, sand, silt, and clay (Sah et al., 1994; Sinha and Friend, 1994; Sah, 1998).
The tectonic processes in the Himalayas, which include thrusting, shearing, and frequent seismic activity, contribute to the creation of discontinuities that diminish the strength of the rock (Molnar et al., 2007). Tectonic activity coupled with climatic effect plays significant role in converting rocks to sediment (Molnar et al., 1993; Barnard et al., 2001; Burbank et al., 2003; Reiners et al., 2003; Bookhagen et al., 2005; Clift and Plumb, 2008; Herman et al., 2013; Zhang et al., 2025). The spatial distribution of precipitation varies, with the northern region characterized as a rain shadow zone, whereas the southern region receives significant rainfall, thereby augmenting the sediment supply to river catchments (Burbank et al., 2003; Andermann et al., 2011).
The Karnali River is a 7th order river system flowing through various lithological units of igneous, metamorphic, and sedimentary rocks originating from Precambrian to Recent period. The elevation ranges from 7,747 m to 163 m in the Karnali River Basin. The northern region is a mountainous terrain with steep slopes and deep cut valleys having gradient approximately around 30 m/km with the capacity to erode and transport larger sediments. The mid region with hills has gradient ranging between 10–20 m/km, here transportation exceeds the eroding capacity. The lower region area lying in the terai zone with gentle slope, has gradient approximately around 1–2 m/km. The capacity to transport decreases sharply leaving the sediments derived from mountainous terrain to settle here in the flood plains.
Methodology
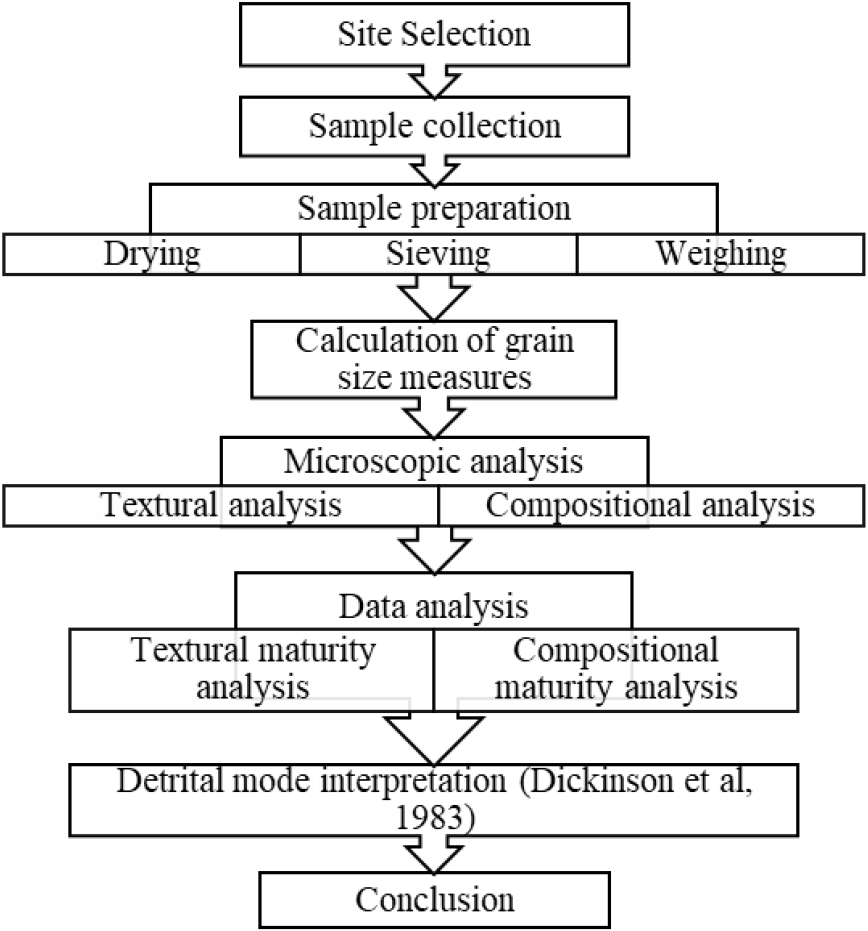
Various desk study, field work, and laboratory work were done to understand the textural and compositional maturity trend, and detrital mode of the Karnali River Basin (Fig. 3). Topographical map and Google earth explorer were used to define sampling locations throughout the river course. Sample as well as field data were acquired from the predefined locations in a scientific manner. The 48 samples along the mainstream were categorized as upstream: (KR1-KR7) covering some portions from the Tethys Himalaya and all the Higher Himalaya rock units upto the MCT, Midstream: (KR7-KR34) covering the Lesser Himalaya rock units, and downstream: (KR35-KR48) south of the MBT covering the Siwalik and the Indo-Gangetic Plains (Fig. 4). Additional samples from 11 major tributaries (KT1-KT11) upstream of the confluences were collected to analyze the role in disrupting downstream trend.
Laboratory work included drying and sieving of the collected samples. Folk and Ward (1957) method were adopted to obtain various statistical parameters. For roundness value, roundness chart of Powers (1953) were used. Similarly, to determine the sphericity of the quartz grains, it was matched with the chart developed by Rittenhouse (1943). QFL and QmFLt ternary diagrams were plotted using Dickinson et al. (1983) for identification of detrital mode and its shift from Tibetan Tethys, Higher Himalaya, Lesser Himalaya, Siwalik, and eventually to Indo-Gangetic Plain during downstream transport.

Sampling interval of 10 to 15 km (except for those nearer from the tributaries) between each sampling location were specified before sampling. Sand samples of approximately 500 grams were collected from the active point bars and side bars, 48 from the mainstem Karnali River and 11 from its major tributaries in a way that will represent the overall depositional environment. The collected samples were then dried in an oven for approximately 24 hours and around 200 grams of sample were weighed and sieved following Krumbein’s 1 ϕ interval (Krumbein, 1934) and the grain size grade of Udden (1914) and Wentworth (1922).
Different percentiles values were calculated from the cumulative weight obtained after sieving. These percentiles values were then used for the calculation of various statistical parameters. The results from all the locations were compared with downstream distance to analyze downstream variation in sediment size, sorting along the Karnali River.
The collected samples were recategorized as coarse, medium, and fine. More than 300 quartz grains from each fraction were evaluated for shape analysis and were tabulated to analyze downstream trend in textural maturity. The shape of a sediment is a measure of its roundness and sphericity. Roundness is related to the relative rounding or angularity (sharpness) of the corners and edges, while sphericity is considered as a measure of the degree to which the shape of a particle approximates that of a true sphere. Sphericity is dependent on both form and roundness because a perfect sphere has equal length, breadth, and thickness and is perfectly rounded (Blott and Pye, 2008).
Again, for the compositional analysis around 300 grains per size fraction were counted with the help of binocular microscope. Mono-crystalline quartz (Qm), poly-crystalline quartz (Qp), feldspar (F), aphanetic lithic fragments of metamorphic origin (Me) and sedimentary origin (sed), phaneritic fragments of quartz-mica (QM), quartz-feldspar-mica (QFM), quartz-feldspar (QF), feldspar-mica (FM), micaceous minerals muscovite (M) and biotite (B), opaque (Op) and non-opaque (NO) heavies, organic debris (OD), altered minerals (A), and unidentified minerals (Ud) were counted from the sediment sample. To make the procedure more convenient the method of staining of potassium feldspar as described by Hayes and Klugman (1959) were adopted to distinguish feldspar from the sample. Different magnifications as per the requirements of coarse, medium, and fine sand were used for compositional analysis.
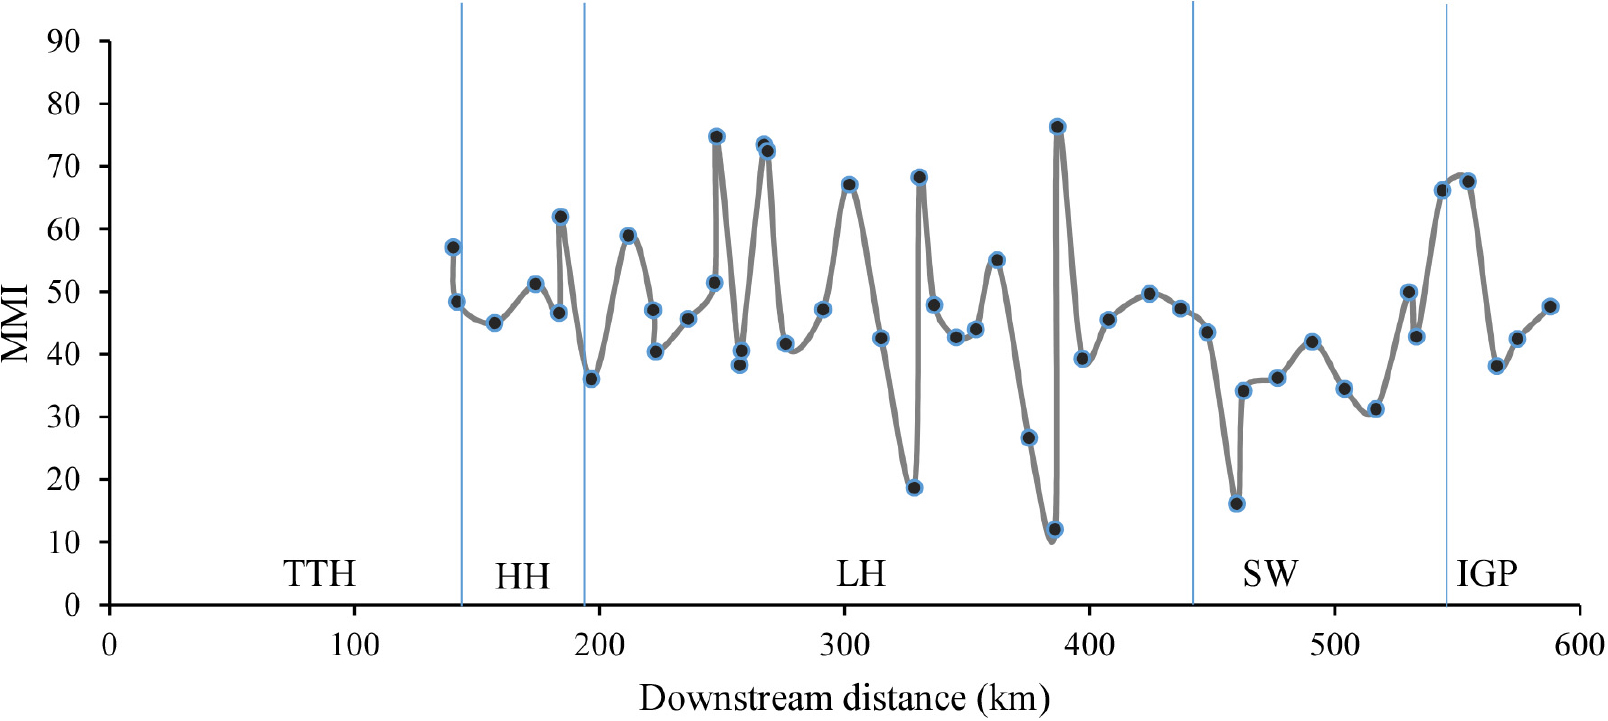
Also, the Modified Maturity Index (MMI) was calculated according to McBride and Picard (1987).
The MMI was plotted against the downstream distance of the river to observe the downstream variation in the mineralogical maturity of the sands.
Dickinson et al. (1983), have explained different detrital modes in a triangular diagram according to the compositional variation in percentage of quartz, feldspar, and lithic fragments. This is widely accepted method, in this study also the weighted percentages of quartz-feldspar-lithic (QFL) were plotted on a triangular diagram for the analysis of detrital modes of samples. This analysis shows how the detrital modes shifts and where our sample will fall on the provenance discriminating diagram of Dickinson et al. (1983).
Results
The sampling started from the Tumkot Village at an elevation of 3,020 m (Fig. 4), Humla District, Nepal lying in the northwestern region of the study area to extreme south near the border of India and Nepal. The mainstream sediments show significant change in grain size, sorting, roundness, and mineral composition as they progress along the river downstream.
Description of Samples
Total of 48 samples were collected from the downstream distance of about 588 km. Of these samples, 2 were from Tibetan Tethys sediment, 5 were from the Higher Himalaya crystalline, 26 were from the Lesser Himalayan Zone, 10 were from the Siwalik zone and the remaining 4 were from the Indo Gangetic Plain. Out of 11 tributaries samples 1 each was from Tibetan Tethys Sediment and the Higher Himalayan Crystalline, 6 were from the Lesser Himalayan Zone and 3 were from the Siwalik Zone (Table 1).
Table 1.
Description of samples
Size and Shape
Grain Size Measures
Table 2 presents detailed statistical parameters related to grain size variation along the Karnali River, including median, standard deviation (sorting), skewness, and kurtosis. These parameters were calculated using the phi values obtained from probability plot between grain size and cumulative weight percentages.
Table 2.
Statistical parameters of grain size distribution of the mainstream samples (symbolized KR) and the tributary samples (symbolized KT)
|
Sample No. | Cumulative weight (%) |
Median (𝜙 | 𝜎I(𝜙)1) | SKI2) | KG3) | ||||||||||
| -2 | -1 | 0 | 1 | 2 | 3 | 4 | Total | ||||||||
| KR1 | 8.41 | 11.18 | 12.78 | 15.29 | 39.60 | 87.28 | 97.72 | 100 | 2.10 | 1.65 | PS | -0.31 | SCS | 0.46 | VPK |
| KR2 | 0.05 | 0.48 | 3.05 | 10.69 | 31.90 | 83.22 | 97.65 | 100 | 2.45 | 1.08 | PS | -0.29 | CS | 0.51 | VPK |
| KR3 | 2.03 | 6.20 | 14.26 | 23.41 | 49.32 | 81.12 | 97.20 | 100 | 1.95 | 1.46 | PS | -0.23 | CS | 0.53 | VPK |
| KR4 | 1.18 | 4.83 | 15.96 | 31.55 | 64.52 | 92.33 | 98.82 | 100 | 1.58 | 1.27 | PS | -0.17 | CS | 0.54 | VPK |
| KR5 | 1.73 | 5.19 | 12.47 | 27.15 | 57.99 | 98.10 | 99.61 | 100 | 1.65 | 1.15 | PS | -0.35 | SCS | 0.50 | VPK |
| KR6 | 0.00 | 0.11 | 3.53 | 18.41 | 54.25 | 87.36 | 98.44 | 100 | 1.87 | 0.99 | MS | 0.00 | NS | 0.58 | VPK |
| KR7 | 0.00 | 0.02 | 0.20 | 1.26 | 12.11 | 51.09 | 89.77 | 100 | 2.89 | 0.81 | MS | -0.03 | NS | 0.55 | VPK |
| KR8 | 0.00 | 0.00 | 0.38 | 5.74 | 45.41 | 87.56 | 98.99 | 100 | 2.05 | 0.75 | MS | 0.11 | CS | 0.60 | VPK |
| KR9 | 0.00 | 0.00 | 0.36 | 7.11 | 65.93 | 95.76 | 99.39 | 100 | 1.84 | 0.71 | MWS | -0.02 | NS | 0.63 | VPK |
| KR10 | 0.00 | 0.04 | 0.14 | 0.57 | 11.46 | 67.14 | 95.03 | 100 | 2.75 | 0.68 | MWS | 0.01 | NS | 0.58 | VPK |
| KR11 | 0.68 | 2.38 | 5.09 | 10.78 | 41.59 | 81.64 | 97.25 | 100 | 2.17 | 1.04 | PS | -0.07 | NS | 0.54 | VPK |
| KR12 | 0.00 | 0.27 | 2.14 | 10.40 | 50.86 | 89.78 | 98.88 | 100 | 1.88 | 0.89 | MS | -0.01 | NS | 0.57 | VPK |
| KR13 | 0.00 | 0.03 | 0.10 | 1.71 | 23.52 | 77.27 | 97.86 | 100 | 2.55 | 0.77 | MS | 0.00 | NS | 0.57 | VPK |
| KR14 | 0.00 | 0.00 | 0.00 | 0.05 | 5.50 | 58.11 | 93.94 | 100 | 2.95 | 0.63 | MWS | 0.01 | NS | 0.57 | VPK |
| KR15 | 0.00 | 0.00 | 0.10 | 1.36 | 19.21 | 56.74 | 91.73 | 100 | 2.79 | 0.82 | MS | -0.01 | NS | 0.57 | VPK |
| KR16 | 0.00 | 0.00 | 0.05 | 0.29 | 10.42 | 74.32 | 97.83 | 100 | 2.61 | 0.63 | MWS | 0.08 | NS | 0.59 | VPK |
| KR17 | 0.29 | 0.85 | 2.32 | 4.75 | 27.74 | 78.41 | 96.67 | 100 | 2.44 | 0.83 | MS | 0.01 | NS | 0.58 | VPK |
| KR18 | 0.00 | 0.00 | 0.02 | 0.21 | 11.82 | 67.60 | 94.58 | 100 | 2.78 | 0.68 | MWS | 0.01 | NS | 0.57 | VPK |
| KR19 | 0.30 | 2.29 | 11.23 | 29.72 | 66.34 | 90.05 | 98.40 | 100 | 1.61 | 1.16 | PS | -0.06 | NS | 0.56 | VPK |
| KR20 | 0.00 | 0.03 | 0.70 | 6.33 | 36.97 | 84.44 | 97.68 | 100 | 2.22 | 0.85 | MS | 0.01 | NS | 0.58 | VPK |
| KR21 | 0.95 | 1.16 | 1.93 | 5.53 | 37.72 | 78.38 | 97.06 | 100 | 2.38 | 0.85 | MS | -0.01 | NS | 0.58 | VPK |
| KR22 | 0.00 | 0.08 | 0.09 | 0.28 | 5.90 | 54.72 | 98.37 | 100 | 2.89 | 0.56 | MWS | -0.01 | NS | 0.56 | VPK |
| KR23 | 0.00 | 0.22 | 3.18 | 16.53 | 60.20 | 93.28 | 99.18 | 100 | 1.80 | 0.90 | MS | -0.01 | NS | 0.57 | VPK |
| KR24 | 0.00 | 0.08 | 0.77 | 5.46 | 33.54 | 80.68 | 98.06 | 100 | 2.31 | 0.78 | MS | 0.01 | NS | 0.58 | VPK |
| KR25 | 0.00 | 0.00 | 0.00 | 0.43 | 14.35 | 70.45 | 98.09 | 100 | 3.19 | 0.47 | WS | -0.01 | NS | 0.58 | VPK |
| KR26 | 0.00 | 0.00 | 0.05 | 0.08 | 1.99 | 46.97 | 95.73 | 100 | 3.08 | 0.53 | MWS | -0.02 | NS | 0.58 | VPK |
| KR27 | 0.00 | 0.00 | 0.01 | 0.06 | 4.15 | 58.98 | 96.36 | 100 | 2.92 | 0.57 | MWS | 0.02 | NS | 0.59 | VPK |
| KR28 | 0.00 | 0.00 | 0.01 | 0.26 | 6.97 | 62.15 | 96.60 | 100 | 2.90 | 0.62 | MWS | -0.02 | NS | 0.58 | VPK |
| KR29 | 0.00 | 0.05 | 0.07 | 0.34 | 5.50 | 41.41 | 91.93 | 100 | 3.11 | 0.68 | MWS | -0.06 | NS | 0.52 | VPK |
| KR30 | 0.32 | 0.36 | 0.71 | 2.94 | 29.22 | 91.68 | 99.27 | 100 | 2.23 | 0.64 | MWS | 0.02 | NS | 0.58 | VPK |
| KR31 | 0.00 | 0.00 | 0.08 | 0.23 | 4.03 | 59.02 | 97.09 | 100 | 2.93 | 0.55 | MWS | 0.03 | NS | 0.58 | VPK |
| KR32 | 0.00 | 0.00 | 0.05 | 0.19 | 14.25 | 88.56 | 96.41 | 100 | 2.45 | 0.55 | MWS | 0.13 | FS | 0.61 | VPK |
| KR33 | 0.11 | 0.24 | 0.71 | 2.02 | 16.87 | 69.33 | 97.66 | 100 | 2.71 | 0.73 | MS | -0.10 | NS | 0.54 | VPK |
| KR34 | 0.00 | 0.00 | 0.10 | 0.70 | 14.10 | 65.40 | 96.98 | 100 | 2.75 | 0.69 | MWS | -0.03 | NS | 0.55 | VPK |
| KR35 | 0.00 | 0.13 | 0.40 | 1.76 | 17.04 | 61.10 | 95.71 | 100 | 2.71 | 0.79 | MS | 0.01 | NS | 0.57 | VPK |
| KR36 | 0.00 | 0.12 | 0.16 | 0.21 | 2.25 | 29.09 | 93.70 | 100 | 3.19 | 0.53 | MWS | -0.04 | NS | 0.56 | VPK |
| KR37 | 0.00 | 0.09 | 0.37 | 0.61 | 4.41 | 37.58 | 91.48 | 100 | 3.25 | 0.61 | MWS | -0.24 | CS | 0.56 | VPK |
| KR38 | 0.00 | 0.00 | 0.01 | 0.28 | 9.20 | 55.11 | 94.82 | 100 | 2.90 | 0.68 | MWS | 0.00 | NS | 0.58 | VPK |
| KR39 | 0.00 | 0.05 | 0.33 | 4.49 | 29.51 | 79.49 | 98.68 | 100 | 2.42 | 0.76 | MS | -0.07 | NS | 0.56 | VPK |
| KR40 | 0.00 | 0.00 | 0.05 | 0.14 | 3.72 | 52.58 | 95.24 | 100 | 3.02 | 0.55 | MWS | 0.02 | NS | 0.57 | VPK |
| KR41 | 0.00 | 0.00 | 0.01 | 0.11 | 5.14 | 68.41 | 98.45 | 100 | 2.81 | 0.56 | MWS | 0.00 | NS | 0.57 | VPK |
| KR42 | 0.00 | 0.00 | 0.00 | 0.04 | 4.22 | 70.51 | 97.50 | 100 | 2.81 | 0.53 | MWS | 0.06 | NS | 0.62 | VPK |
| KR43 | 0.00 | 0.00 | 0.01 | 0.05 | 8.31 | 77.13 | 98.08 | 100 | 2.61 | 0.53 | MWS | 0.12 | FS | 0.66 | VPK |
| KR44 | 0.06 | 0.09 | 0.15 | 0.26 | 6.20 | 69.12 | 97.14 | 100 | 2.85 | 0.57 | MWS | -0.01 | NS | 0.58 | VPK |
| KR45 | 0.00 | 0.00 | 0.00 | 0.09 | 1.30 | 21.55 | 86.59 | 100 | 3.45 | 0.50 | MWS | -0.11 | CS | 0.54 | VPK |
| KR46 | 0.00 | 0.00 | 0.01 | 0.24 | 6.71 | 50.88 | 89.17 | 100 | 3.03 | 0.71 | MWS | -0.01 | NS | 0.56 | VPK |
| KR47 | 0.00 | 0.00 | 0.06 | 0.55 | 22.63 | 78.49 | 96.85 | 100 | 2.57 | 0.67 | MWS | 0.02 | NS | 0.59 | VPK |
| KR48 | 0.00 | 0.00 | 0.47 | 1.03 | 6.95 | 46.57 | 89.12 | 100 | 3.08 | 0.71 | MWS | -0.03 | NS | 0.55 | VPK |
1) 𝜎I (Inclusive Graphic Standard Deviation) (Folk and Ward, 1957): WS, well sorted (0.35–0.50); MWS, moderately well sorted (0.51–0.70); MS, moderately sorted (0.71–1.0); PS, poorly sorted (1.0–2.0).
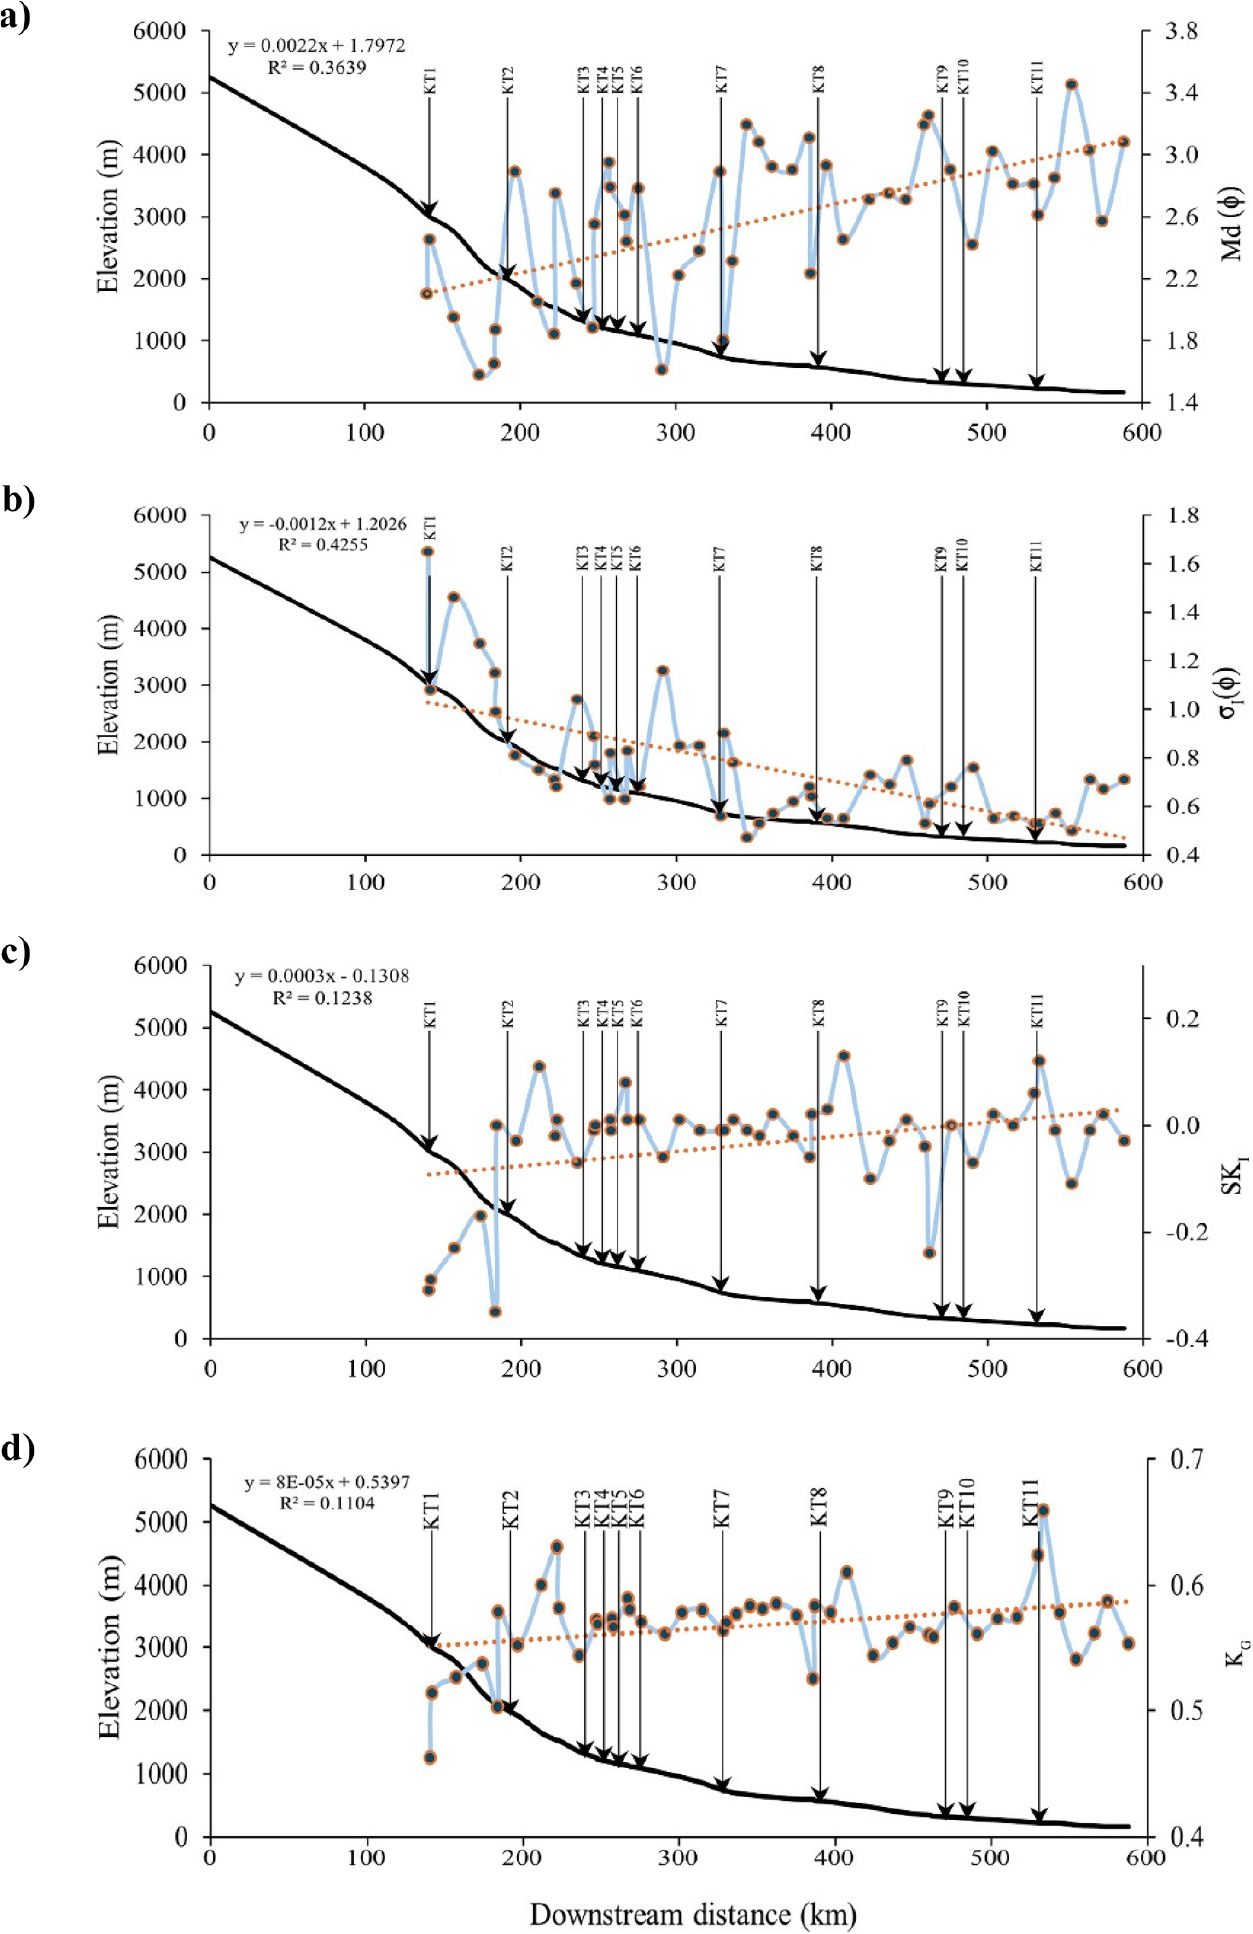
The median grain size varies from 0.09𝜙 to 0.33𝜙 (Table 2). Fig. 5a shows the median size markedly decreased from upstream to downstream, exhibiting a general decreasing trend of median grain size, and this relationship is statistically significant. Coarser sediments dominate the upstream stretches due to high energy and steep gradient. As the river moves into midstream and downstream regions, finer sediments progressively increase, indicating lower transport energy and enhanced sorting. The fluctuations in the median value can be seen throughout the river coarse especially closer to the confluences supplying coarser inputs disrupting the continuous fining trend. Although the trend does not indicate a perfect relation with distance, a moderate correlation with noticeable fluctuations indicate the effect of local inputs such as mass movement, anthropogenic activities or the role of major controlling factors such as lithology, slope, and contributing tributaries.
The Inclusive Graphic Standard deviation (𝜎I) varies from 0.47𝜙 to 1.65𝜙 as shown in Table 2. The standard deviation shows a good and statistically significant relationship (Fig. 5b) with the downstream distance. The upstream sediments are poorly sorted, indicating mixed grain sizes and it trends towards a decreasing downstream value (Fig. 5b). This shows that the sediments attain better sorting while flowing downstream.
The Inclusive Graphic Skewness (SKI) value lies between -0.35 and 0.12 (Table 2) showing a near symmetrical distribution throughout the river course, with slight coarse skewed patterns observed in upstream locations. Although the upstream samples are scattered with negative skewness, indicating coarse size dominance, while the downstream regions tend to shift towards positive skewness, indicating an increase in fine sediments (Fig. 5c).
The Graphic Kurtosis (KG) value varies between 0.4 to 0.66, indicating a very platy kurtic (VPK). This indicates variable grain size throughout the course of the river with no dominant grain size. The graph (Fig. 5d) shows a weak relationship with downstream distance.
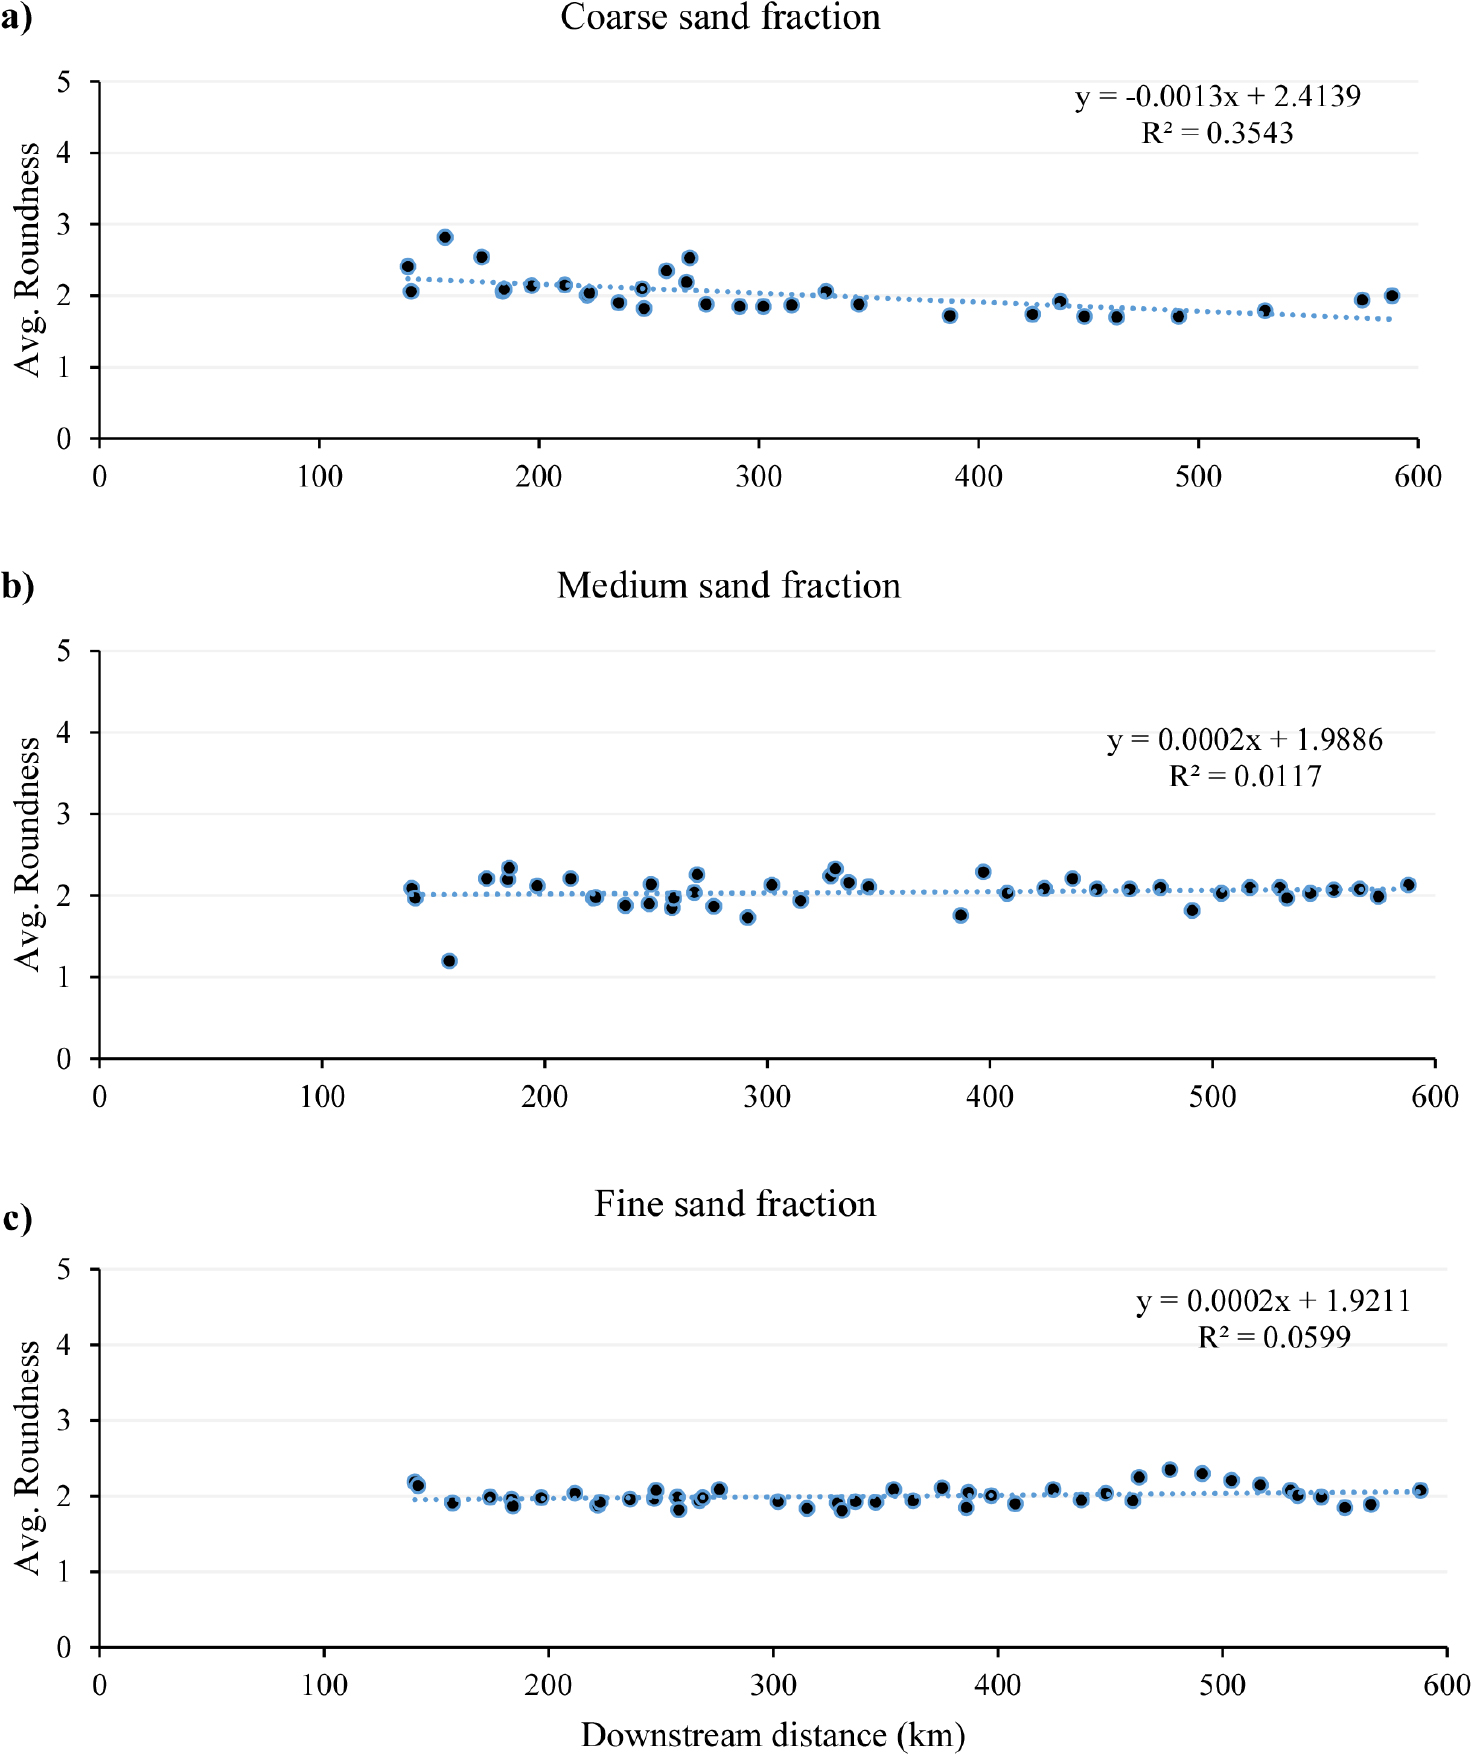
The roundness of the coarse sand fraction tends to diminish with downstream distance (Fig. 6a), whereas those of medium and fine sands show negligible increase in roundness (Fig. 6b and c). The statistically significant decrease of roundness in coarse sands with downstream distance of transport (Fig. 6a) reflects that coarse sands become more angular with downstream distance due to local supply of coarse sands from quartz-bearing rocks (granites, gneiss, quartzite, sandstones, etc.). Although the increasing roundness of fine sands are statistically not significant, the increasing roundness of fine sands indicates probable mixing of fine quartz from the recycling of sedimentary rocks (sandstones from the Siwaliks) to the gradual rounding of fines inherited from upstream sand transport.
The sphericity is medium to high, although the sphericity from the upstream to the midstream section is mostly medium. There are few locations of the upstream (KR10, KR13), mid-stream (KR28), sections where the sphericity is high, as shown in Table 3.
Table 3.
Textural maturity attributes of sands from the Karnali River
Textural Maturity
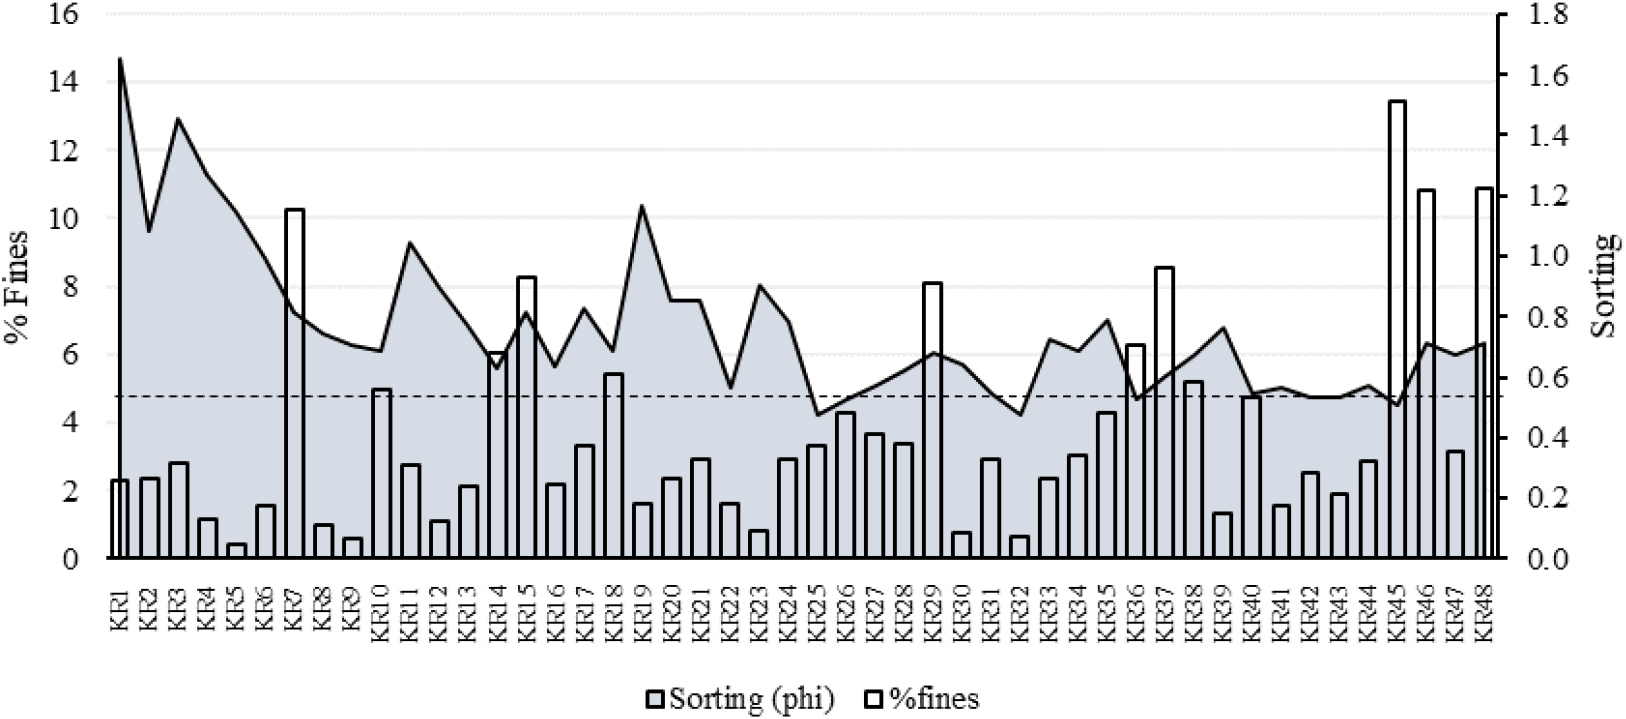
Percent fines (%fines), sorting, and average roundness were analyzed according to Folk (1980) to understand the textural maturity of sediment grains (Fig. 7). Predominantly the submature sediments were observed. Immature samples along the main channel in different parts of the upstream (KR7, KR14, KR15), midstream (KR18, KR29), and downstream (KR36, KR37, KR38, KR45, KR46, and KR48) sections are present.
The maturity analysis (Table 3) shows that there are fluctuations in the downstream maturity trend. This non-uniformity is due to dynamic nature of sediment transport by the rivers. Inversions can be identified in a linearly progressing stream by abrupt change in textural characteristics of sediment. There are different types of textural inversions given by Folk (1980). The inversion types were analyzed to identify the cause of the inversion of the maturity status downstream. Inversion type VI is the only inversion type responsible for changing the maturity status. This type of inversion clearly indicates that the maturity inversion is due to the mixing of sediments from two different rivers. The lower reaches of upstream KR14 and midstream KR18 and KR29 showed textural inversion, while most of the inversion occurred in the downstream section of the Karnali River. The immaturity observed at locations KR18, KR37, and KR38 is due to the mixing of sediments from the contributing tributaries, as indicated by the inversion type VI.
The abrupt change in maturity status at KR14, KR29, and KR36 also lies in inversion type VI; these samples lie just before the confluence possibly by means of riverbank erosion and mass wasting phenomena causing the input of fines. The inversion observed at locations KR45, KR46, and KR48 lies at the Indo Gangetic Plain in the lower stretches of the downstream section. These inversions highlight the complex nature of sediment transport and deposition in the Karnali River system, influenced by various factors such as tributary inputs and local geology.
Composition of Sands from the Karnali River
Mineralogical Composition along the Mainstream Karnali River
The major rock-forming minerals, such as quartz, feldspar, mica, heavies, rock fragments, organic debris, and altered minerals, were calculated (Table 4). The upstream stretch dominantly comprises rock fragments ranging from 25 to 61%, while quartz dominates in a few samples whose values range between 28% and 53%. The micaceous particles in the upstream stretch gradually increased up to 38% and began to diminish at a later stage. Few heavies (up to 6%) were present with very few, below 3%, feldspar and altered minerals.
Table 4.
Compositional analysis of the Karnali River samples
Qm (Mono crystalline quartz), Qp (poly crystalline quartz), F (Feldspar), RFm (Metamorphic), RFs (Sedimentary), QF (Quartz Feldspar), QFM (Quartz Feldspar Mica), QM (Quartz Mica), M (Muscovite), B (Biotite), S (Sericite), NO (Non-Opaque), Op (Opaque), OD (Organic Debris), A (Altered), Ud (Undifferentiated).
Quartz and rock fragments are present dominantly along the midstream section. There is an abrupt decrease in quartz of nearly 16% at KR29; the decreasing trend of rock fragments reaches approximately 25%, whereas mica rises to more than 58%. Again, just a few kilometers downstream at KR30, the percentage of quartz rises suddenly to approximately 60%; here, the rock fragment is nearly 35%, while mica drops at approximately 5%. Feldspars and heavies accounted for less than 3%.
The lower stretches contain predominantly quartz, ranging between 36 and 55%. Rock fragments gradually increased downstream, whereas micas fluctuated between 4% and 36%. Feldspar is present at extremely low values. Heavies, organic debris, and altered debris were observed in a small number of samples.
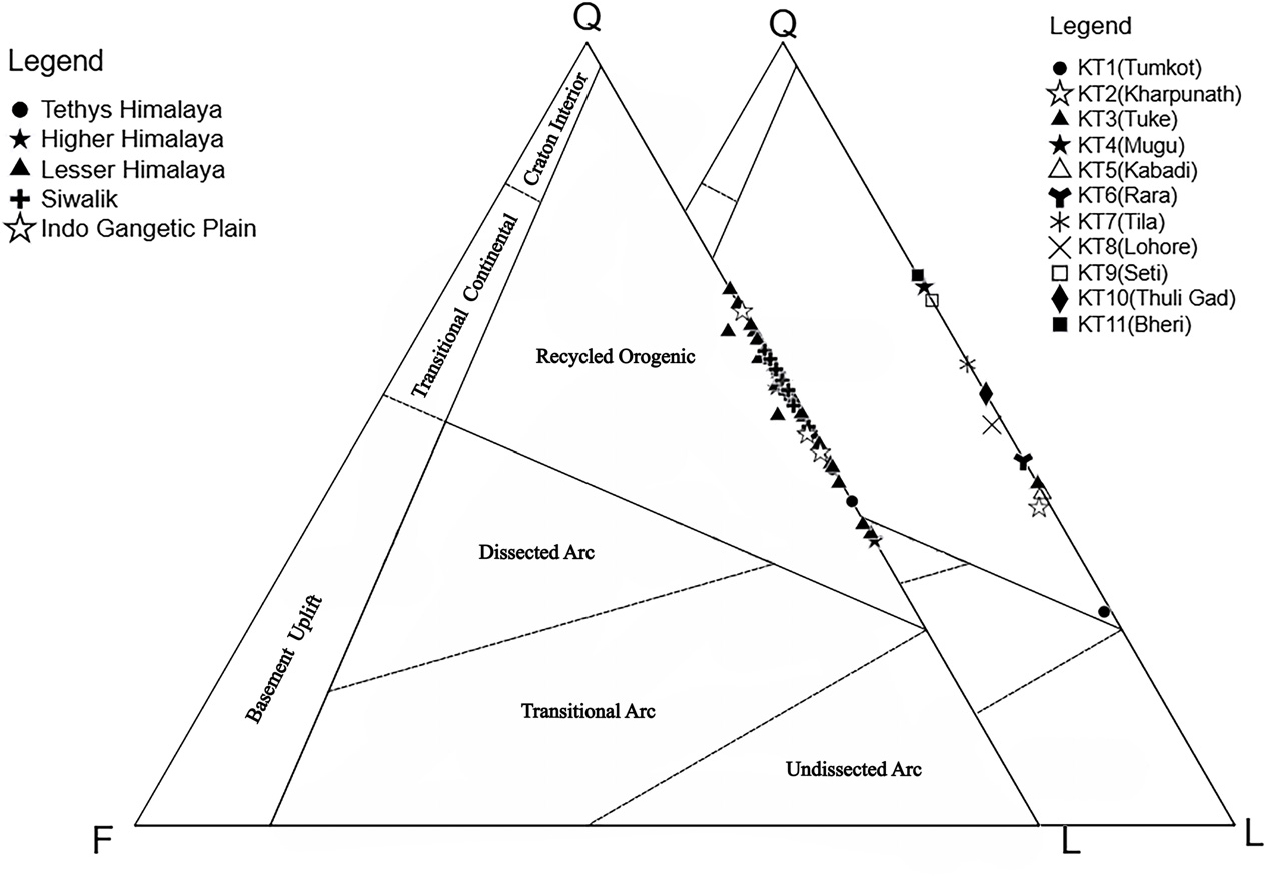
QFL component plots of the mainstem Karnali River sands clearly indicate that the Tethys and Higher Himalayan segment sands are dominantly quartzo-lithic sands and the Lesser Himalayan, Siwalik and Indo Gangetic Plain sands are mostly lithic-quartzose sands (Fig. 8).
Quartz and rock fragments are present predominantly; feldspar is extremely low (Fig. 9). Quartz and rock fragments show opposite trends of variation, that is quartz increases in place of rock fragments at most of the sample locations, and Quartz content slightly increases downstream while rock fragment content slightly diminishes downstream (Fig. 9). Significant amounts of micas with muscovite have higher values than biotite. Heavy minerals are below 5%, mostly opaque minerals are present in most of the samples while transparent minerals are present in the upstream and midstream stretches.

Mineralogical Composition of Tributaries of the Karnali River
The samples collected from the major tributaries of the Karnali River also fell under the lithic to quartzo-lithic categories (Table 4 and Fig. 8). The tributaries lying at the upstream stretches KT1, KT2, KT3, KT5, and KT6 namely Tumkot, Kharpunath, Sarisalla, Kabadi and Rara have higher value of rock fragments except Mugu Karnali (KT4) which has higher value of quartz. The tributaries KT7, KT8, KT9, KT10, and KT11 namely Tila Karnali, Lohore, Seti, Thuligad and Bheri lying at the midstream and downstream stretches are quartz rich. Feldspar is extremely low in all the tributaries.
Detrital Modes of Sands
The Q-F-L plot describes the detrital modes of the Karnali River sands. Fig. 10 shows that the sediments fell under the lithic-quartzose and quartzo-lithic sand categories. This indicates that all the samples consist of more than 25% lithic rock fragments with approximately 5–70% quartz minerals. The feldspar content is extremely low in all samples.
Although the detrital mode after plotting the compositional data in a triangular diagram developed by Dickinson et al. (1983), as shown in Fig. 10, lies within the recycled orogenic provenance, the quartz percentage in the Lesser Himalaya has higher percentage and remains uniform in the Siwalik and Indo Gangetic regions compared to that of the Higher Himalaya and Tibetan Tethys Himalaya.
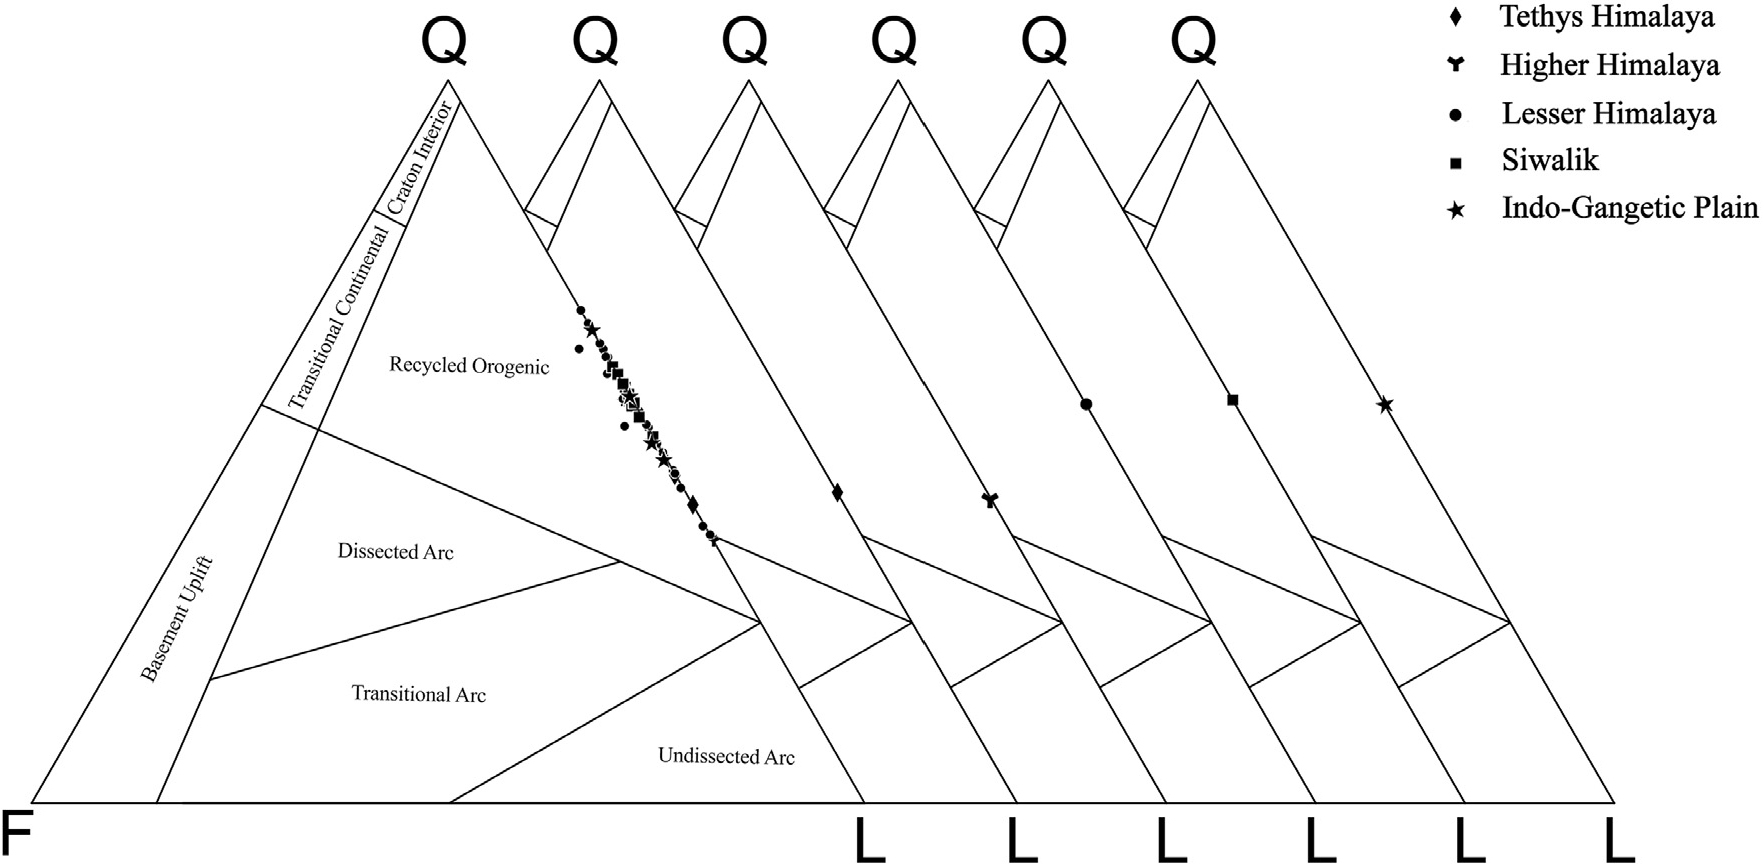
When QmFLt components were plotted on Qm-F-Lt diagram (Fig. 11), the average value of the QmFLt plot from the samples collected from different tectonic units showed a slight shift in the detrital mode from transitional recycled to quartzose recycled. The upstream region in the Tethys and Higher Himalayas is lithic-dominant. As the river flows downstream cross-cutting through the Lesser Himalaya and the Siwaliks, samples are more enriched by quartz minerals, showing a trend towards quartzose recycled orogeny. However, during the later stage of the Indo Gangetic Plain (IGP), the average value again shifts from the quartz dominant to slightly lithic dominant.
The presence of lithic fragments is high in the fine-sized IGP sediments. The enrichment in lithic grains is due to an increase in quartz-feldspar (QF) and quartz-mica (QM) rock fragments, along with a few metamorphic rock fragments in the IGP.

Compositional Maturity
The MMI value ranged from 12.06 to 76.37%, as shown in Table 5. Fig. 12 shows that the maturity status fluctuates along the river course. There is a slightly decreasing trend in the maturity status, indicating a decrease in the maturity level downstream. The poor correlation between the maturity index and the downstream distance signifies that the transport distance does not have significant role in enhancing maturity in context of active tectonic zone.
Table 5.
Modified Maturity Index observed along the Karnali River
Discussions
Grain Shape Variation
The presence of subangular to angular sediments throughout the river course suggesting limited abrasion during rapid transport. This lack of extensive rounding is typical in sediment derived from active orogenic setting, as seen in other Himalayan studies (Garzanti et al., 2021). The minor increase in roundness downstream has been similarly observed in the Ganga River, where textural maturity remains low due to constant erosion and input from nearby lithological units (Najman et al., 2005). Dadson et al. (2003) and Clift et al. (2008) documented similar disruptions in Himalayan rivers, attributing them to tributary inputs or landslides. Potter (1994) emphasized that active orogens like the Himalayas foster inversions due to variable lithology and dynamic transport regimes.
Grain Size Measures and Textural Maturity
The Karnali River exhibits a trend where sediments become finer and better sorted as they move downstream. This is a general trend in river (McBride and Picard, 1987; Dingle and Venditti, 2023). However, the observed textural inversion at KR18, and KR37 resemble findings by Dadson et al. (2003); and Clift et al. (2008) who reported sediment disruptions due to tributary influx or hillslope erosion. Similar situations were reported by Garzanti et al. (2021) in other Himalayan rivers, where abrupt inputs from tributaries or hillslope erosion disrupt equilibrium transport. Such phenomenon happens commonly in active tectonic settings (Folk, 1980; Potter, 1994).
Compositional Trend
The high presence of lithic fragments upstream and increasing quartz downstream in mainstream Karnali reflects the global patterns in tectonically active regions (Najman et al., 2005; Garzanti et al., 2013, 2021). The higher lithic content in the upstream regions can be related with the proximal source having short transport distance (Suttner et al., 1981; McBride and Picard, 1987; Najman et al., 2005; Garzanti et al., 2021) also the role of climate to alter compositional state is also minimum. However, the middle stretches are high in quartz content, with decreasing rock fragments. This signifies the river is attaining maturity as the transport distance increases as stated by Potter (1994). Garzanti et al. (2019) reported similar trend of increase in quartz percentage in Congo and Paraguay Rivers. Later the lower reaches of downstream region contains increased amount of lithic materials and high micaceous materials. Increase in percentage of rock fragments in downstream can be related with Himalayan studies where continuous erosion of the Lesser Himalayan sediments and the Siwalik rock provides enough lithic rock fragments (Najman et al., 2005; Garzanti et al., 2022). The monsoonal climate only enhances physical erosion, preserving lithic fragments and micas (Johnsson, 1993; Yang et al., 2020). Karnali River straddles these extremes: its high physical erosion rates under monsoonal climate preserve lithic fragments and micas (Fig. 6) but localized chemical weathering in floodplains enhances quartz content downstream a hybrid signal unique to tectonically active, humid settings.
Tributary Influence on Composition
The tributaries lying at the upstream and midstream seems to have very little effect in inversing the compositional maturity. Rather they are continually supporting the lithic state as they are mostly rock fragment dominant and quartz dominant. Likewise, Arribas et al. (2007) has reported that there is minimal effect in changing the downstream trend by the contributing tributaries in both texture and composition context, the Henares River resumes its downstream trend even after mixing with the tributary stream.
The Tuke and Khatyaldi Rivers showed significant heavies’ values. The tributaries located in the lower stretches, mainly the Lahore River, have significant amount of micaceous particles. The contributing tributaries (Tumkot, Kharpunath, Sarisalla, Kabadi and Rara) in the upstream stretch of the Karnali River significantly contribute rock fragments to the Karnali River as those streams have higher value of rock fragments. Contrarily, the contributaries in the midstream and downstream stretches (Tila Karnali, Lohore, Seti, Thuligad and Bheri ) of the Karnali River are quartz rich, thus contributing much quartz to the Karnali River.
Shift in Detrital Modes
In QFL plot, all the Karnal samples lies within the recycled orogenic region. The Tethys sediments and the Higher Himalaya sediments consist of higher lithic fragments than quartz while the percentage of quartz increases in the Lesser Himalaya, Siwalik, and the Indo Gangetic sediments with decrease in lithic fragments. Studies by Najman et al. (2005) and Garzanti et al. (2010) at Himalaya foreland, Bengal fan found similar status along the river of the Himalaya.
The shift from transitional recycled to quartzose recycled zones has been obtained in the QmFLt plot (Figs. 10 and 11). This trend aligns with Garzanti et al. (2022), who documented increasing quartz content downstream due to preferential weathering of unstable lithics. However, the resurgence of lithic fragments in the Indo-Gangetic Plain (IGP) suggests occasional flooding event and sudden energy drop a process amplified by monsoon-driven erosion and floodplain reworking (Singh et al., 1999; Allen, 2008).
The QFL plot classification by Dickinson et al. (1983) falls under recycled orogenic provenance and thus can be linked to the compositions related to erosion of fold-thrust belts. The Karnali River’s lithic-rich, immature sediments align with other Himalayan rivers like the Ganges-Brahmaputra, where rapid erosion of metamorphic and sedimentary rocks sustains high lithic fragment content (Garzanti et al., 2021; Najman et al., 2005).
Conclusions
(1) The sand collected from the Karnali River showed a decreasing grain size trend from upstream to downstream. Only a few changes in the size of sand particles in some areas were observed due to mixing of the sediments transported by the tributaries. The percentage fines have increased whereas the coarser sized sediments are extremely low at the downstream stretches compared to the upstream stretches. The medium grained sands are the dominant particle size throughout the river course.
(2) The textural analysis based on roundness of the sediment showed angular to subangular shape in all coarse, medium and fine size grades due to dynamic transport regimes and inputs from nearby lithological units.
(3) The compositional analysis showed increase in mica as the river flows downstream while the percentage of rock fragments decreases while flowing downstream. While climate and source lithology locally change the sediment composition, especially in the downstream regions where mica content increases derived from the Lesser Himalaya terrain. Quartz particles are significantly present throughout the Karnali River, and hence the MMI tends to diminish slightly with distance downstream of the Karnali River.
(4) Tributaries, namely Khatyaldi, Seti, Thuligad, and Bheri are responsible in inversing the textural maturity status at locations KR18, KR37, KR38, KR45, KR46, and KR48.
(5) The Karnali River’s sediments are texturally immature to submature, and compositionally variable between quartzo-lithic and lithic-quartzose sands. This serves as a signature of active collisional orogens. The detrital modes of sands from the upstream to downstream stretches gradually shifted from lithic to quartzose recycled orogeny provenance.
