서 론
지중 유체 주입은 이산화탄소 포집, 활용 및 저장(carbon capture, utilization & storage, CCUS), 인공저류층 지열시스템(enhanced geothermal system, EGS) 구축, 수압 파쇄(hydraulic fracturing) 등 다양한 목적으로 수행된다(Stephens and Jiusto, 2010; Tapia et al., 2018). 최근, 주입정 위치 및 주입량과 지진 발생 시기 및 시점 사이에 대한 통계 분석 연구는 유체 주입 이후 지진 발생률의 급증을 제시하고 있다(Horton, 2012; Ellsworth, 2013; Keranen et al., 2014; Weingarten et al., 2015). 2006년 스위스 바젤(Basel)의 EGS 프로젝트에 의해 규모 2.6의 지진(Deichmann and Giardini, 2009), 2016년 미국 오클라호마(Oklahoma)에서 폐수 주입에 의해 규모 5.1의 지진(Goebel et al., 2017), 2019년 영국 프레스턴(Preston)에서 셰일가스 추출을 위한 수압 파쇄에 의해 규모 2.9의 지진(Cao et al., 2022)이 발생했다. 주입 유발지진은 인적/물적 피해로 이어질 수 있으며(Ellsworth, 2013), CCUS 사업의 경우 재활성화된 단층을 따라 이산화탄소가 누출될 가능성도 존재한다(Rinaldi et al., 2015). 이는, 지역 주민들에게 유체 주입에 대한 불안감을 느끼게 하며, 사회적 수용성을 감소시키는 원인으로 작용한다. 지중 유체 주입에 대한 사회적 반발은 네덜란드의 바렌드레흐트(Barendrecht) 이산화탄소 포집 및 저장(carbon capture and storage, CCS) 프로젝트(Terwel et al., 2012; van Egmond and Hekkert, 2015)나 독일의 바텐팔(Vattenfall) CCS 프로젝트(Dütschke, 2011) 등의 사례처럼, 사업 지연 등의 제한을 가할 수 있다(Brunsting et al., 2011; Kraeusel and Möst, 2012; Lee and Min, 2013; Haug and Stigson, 2016). 원활한 프로젝트 진행을 위해서는 유체 주입과 지구조 응력 사이의 역학적 관계에 대한 상세한 연구를 기반으로 사회적 수용성을 향상할 필요가 있다. 또한, 지중 유체 주입 중/후 발생한 미소지진으로 인해 유체 주입률을 감소시키거나(Cipolla et al., 2012), 주입을 중단하였으나 이후에 더 큰 지진이 발생하는 국외 사례(Yim and Min, 2022)가 있다. 안전한 지중 유체 주입을 위해서는, 유체가 저장되는 층의 수리지질학적 특성(예, 공극률, 투수계수 등)과 지질역학적 특성(예, 지층의 탄성계수, 단층 마찰계수 등)을 고려한 주입-유발지진(단층 미끌림) 발생 시나리오 구축이 필수적이다(Chang et al., 2013).
유발지진 발생의 대표적 메커니즘으로 (1) 주입된 유체가 단층면에 닿음으로써 가해지는 단층면 공극압의 직접적인 증가(예, Nolte et al., 2017; Yeo et al., 2020)와 (2) 유체가 단층에 닿지는 않았지만, 공극 골격의 부피변화에 따른 다공탄성 응력 섭동(예, Yeck et al., 2016; Chang and Yoon, 2020) 등이 제시된다. 다공탄성 이론(Biot, 1941; Segall, 1989; Piombo et al., 2005; Segall and Lu, 2015)은 다공성 매질 내에서의 유체의 흐름과 고체 변형 사이 상호작용에 대한 역학적 모형을 제공하며, 주입-유발지진 연구에 널리 적용되어 왔다(예, Deng et al., 2016; Safari and Ghassemi, 2016; Jin and Zoback, 2018). 본 연구에서는 다공탄성 및 단층 미끌림 결합 수치 모사 방법을 제안하고, 공극압 및 지중응력 변화, 표면 변위에 대한 계산을 수행하고자 한다.
수치 모사는 대상 지역의 수리지질학적 특성과 다양한 주입 시나리오(주입 유체의 종류, 주입량 등)에 대한 복합적인 고려가 가능하므로, 시공간적으로 관측이 제한된 지점에서의 결과값(예, 공극압 및 지중응력 변화량 등)에 관한 정량적 추정을 가능하게 해준다(Lee et al., 2008). 기존 다공탄성 연구는 유체 주입에 따른 공극압 및 지중응력의 변화 계산(Altmann et al., 2010; Chang and Segall, 2016)과 지진에 의한 다공탄성 반발 계산(Hughes et al., 2010; McCormack and Hesse, 2018)을 각각 독립적으로 수치 모사했지만, 정확한 결과값 도출을 위해서는 유체 주입과 지질역학적 특성(예, 단층 미끌림)을 결합한 수치 모사가 필요하다(Jha and Juanes, 2014).
본 연구에서는, 유한요소 상용 소프트웨어인 COMSOL Multiphysics® (이하, COMSOL)를 사용하여 다공탄성(poroelasticity) 방정식을 약형식(weak form)으로 이산화하고, 파이썬(Python) 기반의 유한요소 소프트웨어인 PyLith(Aagaard et al., 2013)를 사용하여 단층 미끌림에 의한 변위를 계산하고자 한다. COMSOL은 수치 모형의 형태, 경계 조건, 물성 등을 자유롭게 조절할 수 있다는 장점이 있다(Lee and So, 2020). 뿐만 아니라, 다양한 솔버(solver)와 요소 차수(element order)를 제공(예, Hoffmann et al., 2009)하기 때문에 유체와 고체의 상호작용에 대한 다공탄성 수치 모사 연구에 적용된 다수의 예가 있다(Pampillón et al., 2018; Wetzler et al., 2019; Hui et al., 2021). 하지만 유한요소법은 연속체 역학을 바탕으로 하므로, 단층 미끌림이나 파괴에 대한 수치 모사 시 어려움이 있다(Zienkiewicz and Taylor, 2005; Agathos et al., 2016; Lee and So, 2019). 이에 반해 PyLith는 영역 내에 존재하는 단층면을 다수의 영역으로 분리하여 내부 마찰 경계로 간주하는 영역분해법(domain decomposition approach)을 이용해서, 불연속면이 미끄러지는 현상인 지진을 엄밀하게 수치 모사할 수 있다(Williams and Wallace, 2015; Kim et al., 2022; Xue et al., 2022). 우리는 공극 유체의 흐름과 다공매질의 연속체적인 변형 사이의 다공탄성 상호작용 계산에는 COMSOL을, 단층의 불연속적인 거동 모사에는 PyLith를 적용했다.
본 연구는 유체 주입/중지 상황 및 단층 미끌림 현상에 대한 수치 모사를 통해 응력 변화량, 변위 등을 계산하였다. 이러한 수치 모사는 단층 미끌림 이후 주입량의 감소 정도를 설정하거나, 주입 중단 이후 지중응력이나 지표 변위 등을 추정하는데 기여할 것으로 판단된다.
연구 방법
지배방정식
다공탄성(Poroelasticity)
Biot(1941)의 다공탄성 이론은 공극 유체 흐름과 암석 변형 사이의 상호작용에 대한 설명으로(Wang, 2000; McCormack et al., 2020), 주입-유발지진 연구(예, Ge and Saar, 2022) 및 지진 후 공탄성 반발 연구(예, Barbot and Fialko, 2010)에 널리 사용되어 왔다. 지층 내 인위적 유체 주입은 공극 내 유체 양을 변화시킴으로써 물질 거동의 변화를 일으킨다.
식 (1)과 (2)는 고체와 유체의 상호작용을 고려하는 등방성 선형 다공탄성 지배방정식의 구성방정식으로, 각각 힘평형방정식(force equilibrium equation)과 유체 질량 보존 방정식(fluid mass conservation equation)이다. 는 공극압, 는 유체의 점성도, 는 투수계수, 는 고체의 변위장(displacement field)을 의미한다. 응력 텐서 는 식 (3)에서, 변형률 텐서 와 그 대각합이자 부피변형률인 , 배수(drained) 포아송비 , 전단계수 , identity 텐서 등의 조합으로 표현된다. 식 (4), (5)를 이용해서 Biot-Willis 계수 와 비저류계수(specific storage) 를 계산할 수 있다.
와 는 각각 비배수(undrained) 포아송비와 Skempton 계수(Skempton’s coefficient)이다. 우리는 기준 모형(reference model)을 주 대상으로 수치 모사를 진행했으나, 주입층의 수리적/공탄성적 물성 변화에 의한 효과를 정량 분석하기 위해 매개변수 중 주입층의 투수계수와 Biot-Willis 계수를 기준 모형과 다르게 설정한 후 추가 수치 모사를 수행했다. 기준 모형에 대한 자세한 물성 수치는 Table 1에 제시했다. 또한, 본 연구에서는 다공탄성에 관한 다수의 기존 연구(Chang and Segall, 2016; Deng et al., 2016; De Simone et al., 2017; Rathnaweera et al., 2020)와 같이, 초기의 응력 상태를 자기 평형(self-equilibrium) 상태로 가정 후 공극압, 쿨롱 파괴 응력 등의 변화량에 대한 수치 모사를 수행했다. 따라서 중력에 의한 효과를 고려하지 않았으며, 중력항에 의한 영향에 대해서는 이후 부록을 통해 서술하도록 한다.
쿨롱 파괴 응력 변화량(Coulomb Failure Stress Change, CFS)
쿨롱 파괴 응력 변화량은 단층의 미끌림 발생 기준 설정 시 널리 사용된다(King et al., 1994; Rutqvist et al., 2007). 특정 단층의 쿨롱 파괴 응력 변화량 CFS가 음수인 경우, 단층면이 닫히는 상태를 의미하지만, 양수일 때는 단층 미끌림에 가까워진 상태를 의미하며(Shan et al., 2013) 식 (6)으로 표현된다.
, , , 는 각각 전단 응력 변화, 수직 응력 변화, 마찰 계수와 공극압 변화로, 의 부호가 양수이면 단층이 닫히고 있는 압축상태임을 지시한다. 본 연구에서는 초기 상태를 자기 평형 상태로 가정하고, 중력을 무시한다고 가정함에 따라, 수치 모형의 공극압과 응력 텐서의 초기 조건은 모두 0으로 설정하였다. 따라서 본 연구를 통해 계산된 , , 등은 변화량을 의미한다. 우리는 단층 미끌림 발생 여부의 판단 기준인 임계 쿨롱 파괴 응력 변화량 CFSC를 0.1 MPa로 설정했다. CFS가 1 bar (= 0.1 MPa)인 경우 미끄러짐 임계점에 도달한 것으로 간주하는 기존 지구물리학 연구들(예, Papadimitriou, 2002; Bagge and Hampel, 2016)과 유사한 기준이다. 유체 주입에 의한 공탄성 효과와 공급압의 효과로 인해 단층의 CFS가 CFSC = 0.1 MPa에 도달하는 시점이 지진 발생 시점이며, 이때부터는 PyLith를 주 소프트웨어로 사용해 지진에 의한 변위를 계산한다.
수치 모형 설정
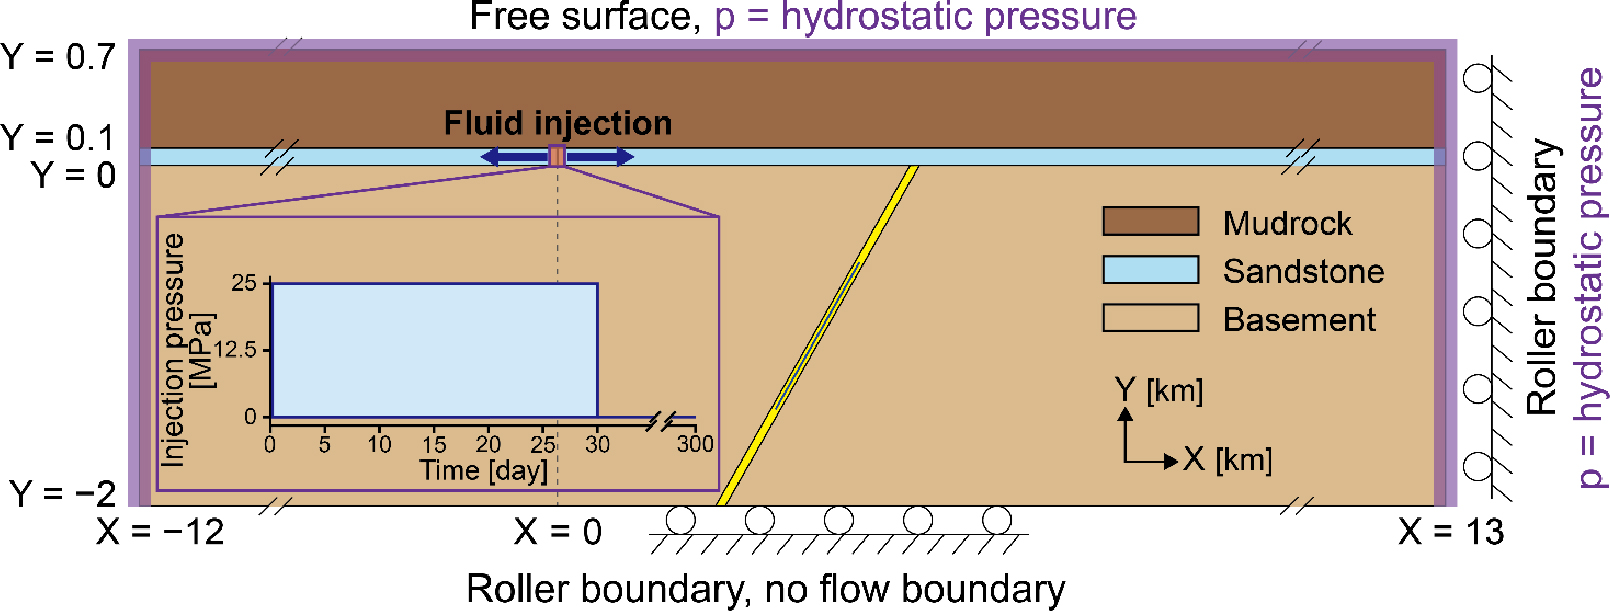
우리는 유체 주입에 의한 공극압 진화 및 단층 미끌림 수치 모사를 위해, Chang and Segall(2016)의 모형 및 매개변수를 바탕으로 수치 모형을 제작했다. 수치 모형을 구성하는 이암, 사암(주입층), 기반암의 두께는 각각 0.6 km, 0.1 km, 2 km이며, 총 25 km (수평방향) × 2.7 km (수직방향)인 2차원 모형이다. 주입된 유체가 지표로 누출되는 현상을 방지하기 위해 사암에 비해 상대적으로 투수성이 낮은 이암을 사암층 위에 위치시켰으며(Shukla et al., 2010), 이는 실제 유체 저장층의 환경과 유사하다(Rutqvist et al., 2010). 기반암 내에 60°의 경사를 갖는 단층은 선 형태의 미끌림면(slip surface)과 이를 둘러싼 면 형태의 단층핵(fault core)으로 표현하였다. 힘평형방정식(식 (1))의 경계 조건으로 상부 경계는 자유면(free surface) 경계 조건, 그 외 경계는 롤러(roller) 경계 조건이 적용되었다. 유체의 질량 보존 방정식(식 (2))에 대한 경계 조건은 하부 경계는 무흐름(no flow) 경계 조건, 그 외 경계는 디리클렛(p = 0) 조건을 부여하였다. 사암층 내, 직경 0.2 m의 주입정을 정의했으며(Fig. 1a의 확대 그림), X = ±0.1 m인 지점의 수직선에서 주입 시나리오에 따라 공극압 값을 조절해 유체의 주입을 모사했다. 디리클렛 조건으로 설정된 주입압력은 Fig. 1c와 같이, 30일 동안 25 MPa의 일정한 압력을 가했다. 본 연구 수행을 위한 수치 모형 및 경계 조건은 Fig. 1a, 수치 모형을 구성하는 격자 구조는 Fig. 1b, 주입 시나리오는 Fig. 1c에 나타내었고, 각각의 층 및 단층핵의 물성 값은 Table 1에 명시하였다. 총 481,932개의 DOF로 이루어진 수치 모형은 삼각형 선형 요소로 구성되었으며, 격자의 최대 크기와 최소 크기는 각각 50 m와 0.3 m이다. 유체 확산 및 단층 미끌림이 발생하는 주입층과 단층핵의 경계는 주변보다 더욱 세밀한 격자 구조를 갖도록 설정함으로써(Fig. 1b) 수치 모사 결과의 정확도를 제고했다. PyLith에서 사용한 수치 모형의 경계 조건과 물성은 COMSOL과 동일하다. 단층 미끌림은 0.5 m, 1 m, 2 m, 3 m 등 다양한 단층 미끌림 길이로 수치 모사하였고, 지표면에서의 수직/수평 변위와 이암층에서의 본 미세스 응력(von Mises stress) 변화를 계산하였다.

Fig. 1.
Model set-up. (a) Numerical model domain with three layers: mudrock, sandstone, and basement. The fault core is 2 km from the injection well at X = 0 km in the sandstone layer. The plane and line represent the fault core and slip surface, respectively. The three points within the slip surface are denoted by Points A, B, and C to track the time evolution of pore pressure and Coulomb failure stress changes. (b) Magnification of the mesh structure near the junction of the sandstone layer and fault. (c) Injection scenario continues with constant injection pressure of 25 MPa for 30 days.
Table 1.
Material properties used in the reference model
|
Material properties
|
Mudrock1) |
Sandstone1) |
Basement2) |
Fault core2) |
Fluid
|
| (m2)
|
1 × 10-19 |
6.4 × 10⁻¹⁴ |
2 × 10-17 |
1 × 10-13 |
-
|
|
0.1
|
0.25
|
0.05
|
0.02
|
-
|
|
0.3
|
0.15
|
0.2
|
0.2
|
-
|
|
0.35
|
0.25
|
0.25
|
0.33
|
-
|
|
0.5
|
0.6
|
0.6
|
0.6
|
-
|
| (GPa)
|
11.5
|
7.6
|
25
|
6
|
-
|
|
0.8
|
0.62
|
0.85
|
0.62
|
-
|
| (kg/m3)
|
2,600
|
2,500
|
2,740
|
2,500
|
1,000
|
| (Pa ‧ s)
|
-
|
-
|
-
|
-
|
1 × 10⁻³ |
COMSOL과 PyLith 순차 적용 알고리즘
본 연구의 수행 순서는 다음과 같다. (1) COMSOL을 사용하여 일정 기간 동안의 유체 주입과 중지 상황을 수치 모사하여, 시간에 따른 주입 중/후의 공극압, 변위, 응력 등을 계산한다. (2) 단층에 가해지는 공탄성 응력이 사용자가 지정한 임계점에 도달하는 경우, 단층 미끌림에 의한 수직 및 수평 변위를 수치 모형에 삽입한다. 해당 수직 및 수평 변위는 PyLith에 지층 물성(예, 영률, 포아송비 등), 단층 위치, 단층 각도, 미끄러짐 양 등을 입력하고 유한요소 수치 계산하여 구한다. (3) 단층 미끌림 이후의 공극압 및 응력을 계산한다. 각 소프트웨어의 적용 순서 및 변경 시점 등의 알고리즘은 Fig. 2에 제시했다. CFS 분포, 유체 속도장, 공극압 변화, 계산 영역의 변위 등에 관한 시각화 및 후처리는 사용자가 원하는 변량에 관한 시각화 자료를 생성할 수 있는 소프트웨어인 ParaView(Ahrens et al., 2005)를 이용해 수행했다.
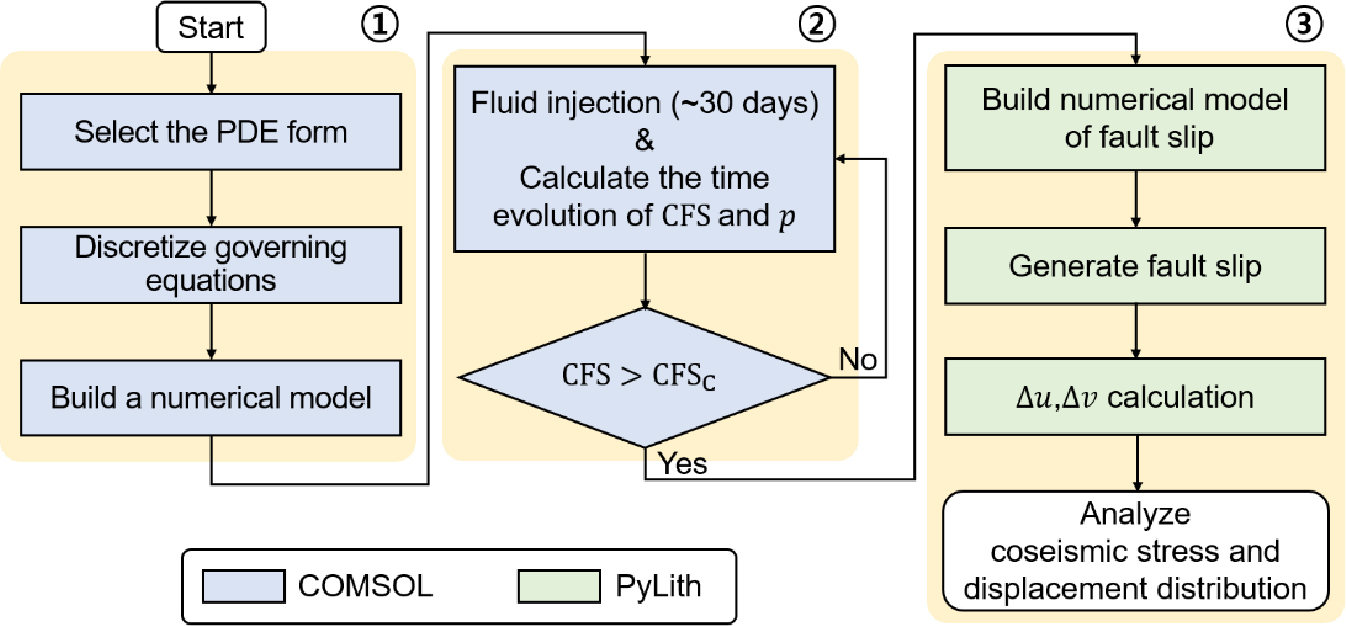
Fig. 2.
Flow chart for simulating pore pressure evolution, poroelastic stressing, and fault slip in the fluid injection model. COMSOL (blue) and PyLith (green) compute the effects of poroelasticity and fault slip, respectively. To build a detailed poroelastic model, we select an option to customize the partial differential equations in the first step. In the discretized domain with the numerical conditions (i.e., boundary and initial conditions) and properties (e.g., permeability and fluid viscosity), the pore pressure and poroelastic stress fields are redistributed by injection for 30 days. When the Coulomb failure stress change of the fault overcomes the pre-defined critical value CFSC, the main numerical software is switched from COMSOL to PyLith to simulate the fault slip and the resulting coseismic stress distribution.
결과 및 토의
COMSOL을 이용한 유체 주입에 의한 공극압 및 응력 상태의 변화와 지표에서의 변위 계산
유체 주입 및 중지에 따른 이암층, 사암층(주입층), 기반암층에서의 공극압 변화 (Fig. 3a~3d)와 수직 변위 (Fig. 3e~3h)의 시계열 진화를 수치 모사했다. 초기 30일 간 주입층에 25 MPa의 주입압력을 주고(Fig. 3a and 3b 및 Fig. 3e and 3f), 200일(Fig. 3c and 3d 및 Fig. 3g and 3h)까지의 와 의 진화를 관찰하였다. 유체 주입이 활발한 시기에는 사암층의 가 주입정 근처에서 가장 큰 값을 갖으며, 투수율이 높게 설정된 단층핵에 의 상승이 국지화되고 음의 Y 방향으로 확산된다. 주입이 중지된 후에는, 전체적으로 가 시간에 따라 완화하지만, Fig. 3b와 Fig. 3d의 단층 뿌리 부분의 를 비교해보면, 단층의 뿌리 부분은 주입이 중지되어도 가 상승하는 구간이 존재함을 파악할 수 있다. 주입 시나리오(Fig. 1c 참조)에 따라 주입정에서 최대 압력(25 MPa)에 도달한 시기에는 주입정 바로 위인 X = 0 km 지점에서 ~3 cm로 가장 높은 표면 수직 변위를 보여준다(Fig. 3f). 주입정에 가해지는 압력이 주입 시나리오(Fig. 1c)에 따라 주입이 중단되면, 표면 수직 변위의 크기는 점점 감소한다(Fig. 3g and 3h).

Fig. 3.
Time evolution (10 to 200 days) of (a-d) pore pressure and (e-h) vertical displacement owing to fluid injection. The residual pore pressure changes after injection stops on the 30th day. Vertical displacements along the surface (dotted lines) are exaggerated by 5,000 times to emphasize surface deformation.
단층 안정성을 정량화하는 쿨롱 파괴 응력 변화 CFS와 지중 유체 주입 사이의 관계를 이해하기 위해, 주입 중/후 시점에 따른 모형의 전체적 CFS분포 및 단층 내 CFS분포를 Fig. 4에 도시했다. 대상 단층이 양의 CFS구역에 존재할 경우 단층의 파괴 가능성을 지시하므로, 단층과 그 주변부 CFS분포 양상에 관한 정량적 추정은 주입-유발지진 위험성을 최소화하기 위한 지중 유체 주입 시 필수적이다. 본 연구에서는 0.1 MPa (예, Papadimitriou, 2002; Bagge and Hampel, 2016)을 단층 미끄러짐을 위한 임계 쿨롱 파괴 응력 변화 CFSC로 설정하였다. 유체 주입이 지속되는 30일 동안 CFS는 사암층을 통해 주입정에서부터 수평방향으로 증가하며, 이암과 기반암에 비해 높은 투수율을 갖는 단층핵에서도 CFS가 증가했다(Fig. 4a and 4b). 유체 주입 중단 이후(즉, 30일 이후), 공극압이 확산함에 따라(Fig. 3c and 3d 참조) 사암층 주변부(X = ±6 km)와 단층핵의 뿌리 부분(Y = -2 km)에서는 100일 및 200일 시점에도 양의 CFS가 잔류한다(Fig. 4c and 4d). 우리는 단층핵 내 3개의 지점(Points A, B, and C)에서 CFS의 시간 진화를 비교했다(Fig. 4e). 3개 지점의 CFS 최대값은 A의 경우 ~120일에 ~3.5 MPa이며, B와 C는 300일 이후에도 꾸준히 증가하는 것으로 계산되었다. A, B, C 지점의 CFS는 각각 ~13일, ~21일, ~32일 시점에 임계점 CFSC에 도달하며(Fig. 4e), 단층핵 내의 CFS 분포 양상(Fig. 4f)도 사암층과 근거리인 점에서 더 빠르게 CFSC에 도달함을 보여준다.
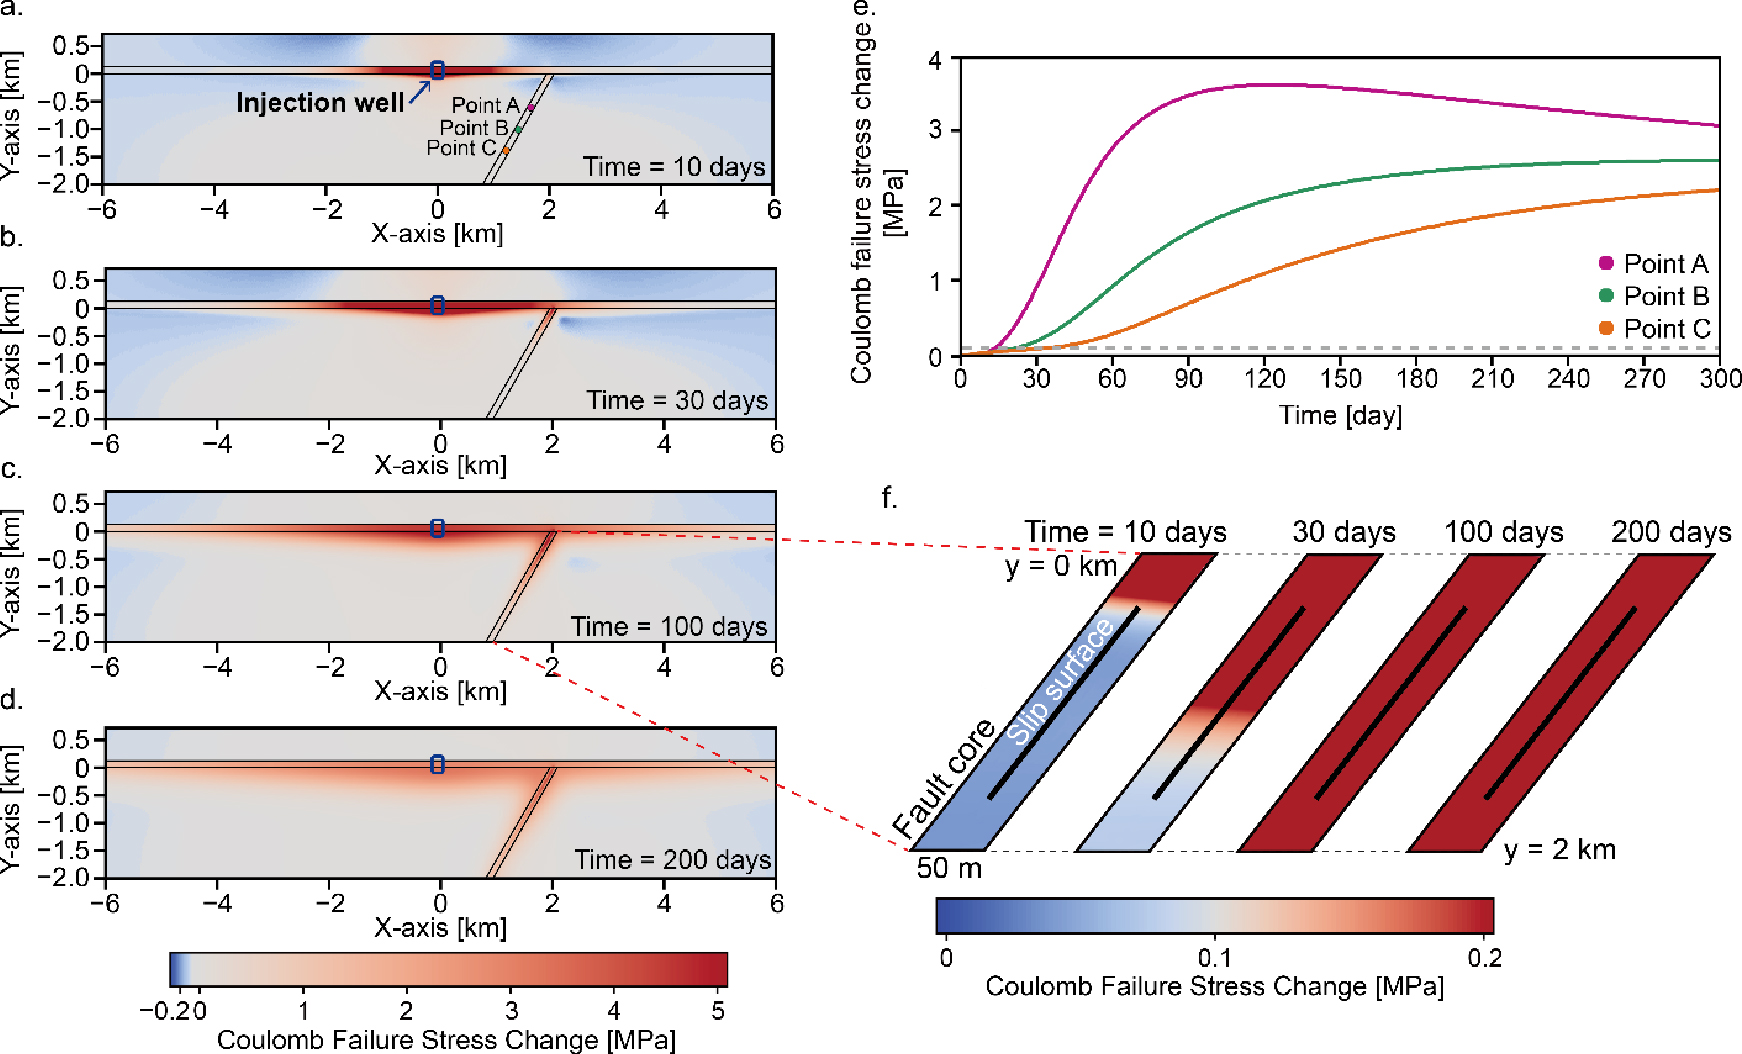
Fig. 4.
Coulomb failure stress change (CFS) induced by fluid injection. (a-d) Evolution of CFS with time from (a) 10 to (d) 200 days. (e) CFS changes during 300 days measured at Points A (pink), B (green), and C (orange). The gray dotted line indicates the threshold, 0.1 MPa. (f) Variations of CFS changes with time within the fault core.
CFS는 공극압 관련 항 와 다공탄성 응력(poroelastic stressing) 관련 항 으로 구성되어 있다. 두 항 모두 더 큰 양수일수록 CFS값도 더 크다. Fig. 5a~5d는 분포를 각각 10일, 30일, 100일, 200일 시점에서 보여준다. 주입이 진행되는 동안 주입정을 중심으로 사암층을 따라 가 확산되며, 단층을 통해서도 가 확산되는 현상이 나타난다(Fig. 5a and 5b). 주입이 종료된 이후에도 는 사암층과 단층 내에 여전히 존재한다(Fig. 5c and 5d). 양의 값은 단층에 작용하는 수직 응력보다 전단 응력의 크기가 더 큼을 의미하고, 이는 단층이 미끄러지기에 용이한 상태임을 지시한다(Fig. 5e~5h). 유체를 주입하는 30일 동안 주입정 주변의 사암층에서는 음의 값이 나타나 사암층이 압축 중임을 지시하고, 반대로 단층에서는 양의 값이 나타나 단층의 미끄러짐 가능성을 암시한다(Fig. 5e and 5f). 이후, 주입이 종료된 후, 100일과 200일에서 사암층과 단층에서는 주입 중 시점과 유사하게 각각 음의 값과 양의 값이(Fig. 5g and 5h) 나타난다.
Fig. 5i와 5j에 각각 Points A, B, and C지점에서 시간에 따른 와 값 변화 그래프를 도시했다. 주입 기간(~30일) 중 초반부에는 값이 음수이며, 중반부터는 증가하다가 결국 양의 값을 보인다(Fig. 5i). 이는, 주입 유체의 도달 시점과 가 관련이 있음을 지시한다. 주입층인 사암층과 상대적으로 가장 가까운 Point A에서는 주입 시작 후 ~15일부터 가 상승하며 ~130일 시점에서 최대 값 ~2 MPa가 나타났다. 반면, 사암층에서 가장 멀리 떨어진 Point C에서는 주입 후 ~30일부터 상승하는 추세를 보였으며, 300일 이후에도 값은 지속적으로 상승했다. 는 주입 시작과 동시에 상승한다. ~13일까지는 사암층에서 멀리 있을수록 더 큰 값을 보이지만, 이후 상대적으로 사암층과 가까이에 위치한 Point A가 가장 큰 값을 보이고 ~115일 시점에서는 최대 값이 ~1.6 MPa에 이른다. ~15일 시점에서 Point B는 Point C보다 더 큰 값을 갖기 시작하며, ~280일 시점에 1.2 MPa의 최대 값을 갖는다. 사암층으로부터 가장 멀리 떨어진 Point C는 300일 이후에도 값이 상승하는 경향을 보였다.

Fig. 5.
Evolution of (a-d) and (e-h) , which are terms related to pore pressure and poroelastic stressing, respectively. (i, j) Daily variations of each value measured at Points A (pink), B (green), and C (orange) in the slip surface.
Fig. 6a and 6b는 단층핵과 사암층(주입층)의 물성 조합(투수계수 및 Biot-Willis 계수)에 따라 단층의 최하단 Point C지점(Fig. 1 참고)의 CFS가 임계점 CFSC에 도달하는 시간(critical time)을 도시했다. Fig. 6a의 가로축은 단층 투수계수의 로그값, 세로축은 사암층 투수계수의 로그값이다. 이 때 사용된 사암층의 Biot-Willis 계수는 기준 모형(reference model)의 물성(Table 1 참조)을 이용해 계산하고 고정하였다. Fig. 6a는 단층핵의 투수계수가 ~1 × 10-14.5 m2보다 클 경우, 단층핵과 사암층의 투수계수가 클수록 더 빠르게 CFSC에 도달함을 보여준다. 예를 들어, 단층의 투수계수가 1 × 10-13 m2이고, 사암층의 투수계수가 6 × 10-13 m2인 경우, Point C에서의 CFS는 10일 이내에 CFSC에 도달하지만, 단층과 사암층의 투수계수가 작을 경우(예, 각각 1 × 10-14 m2, 6 × 10-15 m2인 경우)에는 100일 이후에 도달한다. Fig. 6b의 가로축은 단층 투수계수의 로그값, 세로축은 사암층 Biot-Willis 계수이다. 이때 사용된 사암층의 투수계수는 기준 모형 값인 6.4 × 10⁻¹⁴ m2으로 고정하였다. Fig. 6b의 도달시간에 대한 등고선의 형태는 CFS의 CFSC 도달 시간에는 주입층의 Biot-Willis 계수보다는, 단층의 투수계수가 더 큰 영향을 미침을 암시한다. 예를 들어, 단층의 투수계수를 1 × 10-14 m2으로 고정하고, 주입층의 Biot-Willis 계수가 0.1부터 1.0까지의 범위 내에 존재하는 경우, CFSC에 도달하는데 약 26일부터 약 46일의 시간이 소요되지만, 주입층의 Biot-Willis 계수를 0.6으로 고정 후, 단층의 투수계수를 1 × 10-15 m2부터 1 × 10-13 m2로 설정할 경우, CFSC까지 도달하는데 걸리는 시간은 약 11일부터 약 326일 사이다.

Fig. 6.
Maps of critical time at which the CFS value reaches CFSC (i.e., 0.1 MPa) at Point C (see Fig. 5a). (a) The critical time map varied with the permeability of sandstone (horizontal axis) and the fault (vertical axis). (b) Variation of critical time with the Biot-Willis coefficient of sandstone and the permeability of the fault when sandstone’s permeability is 6.4 × 10⁻¹⁴ m2. The dotted lines connect points with the same critical times. Other material properties are identical to the reference model (see Table 1).
PyLith를 이용한 단층 미끌림 계산
단층 최하부(Fig. 5a의 Point C지점)에 가해지는 CFS값이 임계값인 CFSC에 도달하면, PyLith를 이용해 0.5, 1, 2, 3 m의 역단층 미끄러짐을 수치 모사했다. 단층의 가장 아래 부분을 기준으로 삼은 이유는 단층의 asperity가 단층 최하부에 존재한다고 가정하여, 가장 늦은 미끄러짐 시점을 추정하기 위해서다. 만약 기준을 Point A(Fig. 5a)로 설정하면 더욱 이른 미끄러짐 시점을 추정할 것이다. Fig. 7a~7d는 단층 미끌림 크기에 따른 본 미세스(von Mises) 응력 분포를 보여준다. 본 미세스 응력은 편차응력텐서를 대표하는 양으로 재료의 파괴기준 설정에 주로 사용되며, 높은 본 미세스 응력은 높은 파괴 가능성을 지시한다. 직관적인 응력 분포 및 변위 관찰을 위해 수직 방향으로 300배 확대하여 표현하였다. 단층의 미끄러진 길이가 증가할수록 더 큰 변위와 본 미세스 응력이 도출되었음을 파악할 수 있다. 정량적인 판단을 위해서 Fig. 7e에 단층 미끌림 크기에 따른 지표 수평 변위(실선)와 지표 수직 변위(점선)를 도시했다. 단층이 0.5 m 미끄러진 경우, 최대 수평 변위는 -0.03 m, 수직 변위는 0.11 m이다. 단층이 3 m 미끄러진 경우, 최대 수평 및 수직 변위는 각각 -0.21 m와 0.67 m로 단층 미끄러짐 양이 클수록, 수평 및 수직 변위가 증가했다. Fig. 7f는 단층 미끌림 크기에 따른 사암층 내 수평 측선(Y = 0.4 km)에서 추출한 본 미세스 응력 프로파일이다. 미끌림에 의한 최대 본 미세스 응력은 단층 주변에서 나타나며, 단층의 미끌린 양이 증가할수록 더 큰 본 미세스 응력이 발생한다.

Fig. 7.
von Mises stresses and vertical displacements with difference the amount of fault slip (a-d). The developments of von Mises stress and vertical displacements with increasing fault slip displacements of 0.5, 1, 2, and 3 m. The surfaces of the model are deformed proportionally to the vertical displacements (which are exaggerated here by a factor 300). (e) Horizontal (solid lines) and vertical (dashed lines) displacements along the surface with different slip amounts. The red, orange, green, and blue indicate the slip amount of 0.5, 1.0, 2.0, and 3.0 m respectively. The gray lines represent the location of the fault contacted by the sandstone layer (X = 2 km). (f) von Mises stress within the mudstone layer (Y = 0.4 km).
토의 및 결론
본 연구에서는 공극 유체의 질량 보존 방정식과 공극 골격의 힘평형방정식을 결합한 다공탄성 모사에 유용한 COMSOL과, 영역분해법 바탕의 단층 미끄러짐 모사에 특화된 PyLith를 순차적으로 적용하여 유체를 지중 주입하는 수치 모형을 제작하였으며, 주입에 의한 공극압, 지중응력 변화, 단층 미끌림에 의한 변위 및 응력장 변화를 계산하였다. 유체 주입압력을 시간에 대해 일정하게 유지하면, 주입정 주변의 공극압 및 쿨롱 파괴 응력 변화, 수직 변위량이 증가하는 양상을 보이는데, 이는 유체 주입이 장기간 지속될 경우 지중 암반에 가해지는 응력이 증가함으로써, 불안정한 암반 상태로 이어질 수 있음을 의미한다. 주입이 종료된 후에도 주입 중 발생한 공극압과 응력이 주입정의 근거리에서부터 원거리까지 확산 및 전달되며, 단층의 경우에는 유체 주입 중단 이후의 쿨롱 파괴 응력 변화 값이 주입 중에 비해 오히려 더 큰 값을 보이는 것을 확인하였다. 이는, 유체 주입의 중단이 지중 암반의 안정적인 상태를 담보하는 것이 아니며, 주입 중지 후에도 지속적인 모니터링이 필요함을 제안한다.
사암층(주입층)과 단층 물성의 특성(예, 투수계수와 Biot-Willis 계수 등)은 유체 주입에 의해 단층의 쿨롱 파괴 응력 변화량이 임계점에 도달하는 시간을 결정하는 요인이다. 사암층과 단층의 투수계수가 모두 높은 경우, 단층의 최하부인 C지점에 가해지는 쿨롱 파괴 응력 변화량이 임계점에 도달하는데 걸리는 시간은 10일 이내지만, 사암층과 단층의 투수계수가 낮은 경우에는 200일 이후에 도달한다. 사암층의 Biot-Willis 계수도 쿨롱 파괴 응력 변화량 임계점 도달 시간에 영향을 미치지만, 단층의 투수계수에 비하면 그 효과가 작음을 확인했다. 이는, 주입정 위치 탐색에 있어 주입층과 주변 지층의 물성, 특히 투수계수를 파악하는 것의 중요성을 지시한다. 유체 주입에 따른 응력 변화와 단층 미끌림에 대한 다양한 시나리오 설정 및 다공탄성 수치 모사는 주입층 주변의 지층 파괴 가능성을 파악하고, 유체 누출 위험성을 저감하는 데 중요할 것으로 판단된다.
부 록
지중 유체 주입에 의한 공극압 및 지중응력 변화에 대한 기존 수치 모사 연구에서 다공탄성 방정식은 지배방정식으로 널리 사용되어 왔다. 다공탄성 방정식엔 체적력(body force) 즉, 중력과 관련된 항이 존재하지만, 다수의 기존 연구들은 해당 항을 무시하고 계산해왔다(Chang and Segall, 2016; Deng et al., 2016; De Simone et al., 2017). 이는 초기 응력 상태를 평형상태로 가정하며, 연구의 목적이 유체 주입에 의한 공극압, 지중응력의 변화(증가 및 감소 등) 정도를 파악하기 때문이다. 유체 주입 수치 모사에서 중력이 공극압 및 쿨롱 파괴 응력변화량에 미치는 영향을 파악하기 위하여, 중력에 의한 효과를 고려해 공극압과 쿨롱 파괴 응력을 계산했다.
기준 모형의 초기 응력 상태를 평형상태로 설정하기 위해 힘평형방정식과 유체 질량 보존 방정식에 각각 , 인 체적력 항을 추가했다. 이를 수식으로 표현하면 부록-식 (1)과 부록-식 (2)로 나타낼 수 있으며, 이때 , 와 는 각각 지층 물질의 밀도, 유체의 밀도, 중력가속도를 의미한다.
또한, 정수압 상태를 고려하기 위하여 상부와 양쪽 경계 조건을 [Pa] = (700-Y) [m] × [kg/m3] × [m/s2]로 설정했다(부록-Fig. 1).
부록-Fig. 1.
The numerical model under gravitational forces. The hydrostatic pressures, which describe the depth-dependent gravitational effects on the pore fluid flow, are imposed along the top, left, and right boundaries.
중력을 고려한 경우에 대한 수치 모사는 중력을 고려하지 않은 경우와 동일한 주입 시나리오를 사용했으며, 중력을 고려한 결과를 부록-Fig. 2에 나타냈다. 부록-Fig. 2의 1행, 2행, 3행은 각각 공극압(부록-Fig. 2a, 2d, and 2g) 쿨롱 파괴 응력(부록-Fig. 2b, 2e, and 2h), 수직 변위(부록-Fig. 2c, 2f, and 2i)와 관련된 결과이다. 부록-Fig. 2의 1열은 유체 주입 전 중력에 의한 효과에만 의존하는 결과값이며(부록-Fig. 2a~2c), 2열은 유체 주입과 중력에 의한 효과가 결합된 100일 째의 결과값이다(부록-Fig. 2d~2f). 3열은 1열과 2열 사이의 잔차로, 중력 효과가 존재할 때, 유체 주입에 의한 변화량을 의미한다(부록-Fig. 2g~2i). 중력을 고려하였을 때 계산되는 변화량(부록-Fig. 2g~2i)은 각각 중력을 고려하지 않았을 때의 공극압 변화량(Fig. 3c) 및 수직 변위(Fig. 3g), 쿨롱 파괴 응력 변화량(Fig. 4c)에 대하여 유사한 값과 경향성을 보임을 알 수 있다. 유체 주입에 의한 공극압 및 쿨롱 파괴 응력 변화, 수직 변위 등의 변화량 계산시 중력은 미미한 영향을 미치는 것으로 보여진다.

부록-Fig. 2.
The effects of gravity on the fluid injection models, which are indicated by changes in pore pressure, CFS, and vertical displacement distributions in the cases with and without injections. The differences in pore pressure, CFS, and vertical displacement fields between poroelastic models with (a-c) and without (d-f) injections under gravitational effects are denoted by g, h, and i, respectively. The blue rectangles show the positions of the injection well.
Acknowledgements
본 연구는 “행정안전부 방재안전분야 전문인력 양성”사업과 한국연구재단 중점연구소지원 사업(No. 2019R1A6A1A03033167), 산업통상자원부(MOTIE)의 재원으로 한국에너지기술평가원(KETEP) 지원을 받아 수행되었습니다(No. 20226A10100030).
References
Aagaard, B.T., Knepley, M.G., Williams, C.A., 2013, A domain decomposition approach to implementing fault slip in finite-element models of quasi-static and dynamic crustal deformation, Journal of Geophysical Research: Solid Earth, 118, 3059-3079.
10.1002/jgrb.50217Agathos, K., Chatzi, E., Bordas, S.P., Talaslidis, D., 2016, A well-conditioned and optimally convergent XFEM for 3D linear elastic fracture, International Journal for Numerical Methods in Engineering, 105, 643-677.
10.1002/nme.4982Ahrens, J., Geveci, B., law, C., 2005, Paraview: An end-user tool for large data visualization, The Visualization Handbook, 717-731.
10.1016/B978-012387582-2/50038-1Altmann, J.B., Müller, T.M., Müller, B.I., Tingay, M.R., Heidbach, O., 2010, Poroelastic contribution to the reservoir stress path, International Journal of Rock Mechanics and Mining Sciences, 47, 1104-1113.
10.1016/j.ijrmms.2010.08.001Bagge, M., Hampel, A., 2016, Three-dimensional finite-element modelling of coseismic Coulomb stress changes on intra-continental dip-slip faults, Tectonophysics, 684, 52-62.
10.1016/j.tecto.2015.10.006Barbot, S., Fialko, Y., 2010, A unified continuum representation of post-seismic relaxation mechanisms: Semi-analytic models of afterslip, poroelastic rebound and viscoelastic flow, Geophysical Journal International, 182(3), 1124-1140.
10.1111/j.1365-246X.2010.04678.xBiot, M.A., 1941, General theory of three-dimensional consolidation, Journal of Applied Physics, 12, 155-164.
10.1063/1.1712886Brunsting, S., Desbarats, J., de Best-Waldhober, M., Duetschke, E., Oltra, C., Upham, P., Riesch, H., 2011, The public and CCS: The importance of communication and participation in the context of local realities, Energy Procedia, 4, 6241-6247.
10.1016/j.egypro.2011.02.637Cao, W., Verdon, J.P., Tao, M., 2022, Coupled poroelastic modelling of hydraulic fracturing-induced seismicity: Implications for understanding the post shut-in
ML 2.9 earthquake at the Preston New Road, UK, Journal of Geophysical Research: Solid Earth, 127, e2021JB023376.
10.1029/2021JB023376Chang, D., Boulanger, R., Brandenberg, S., Kutter, B., 2013, FEM analysis of dynamic soil-pile-structure interaction in liquefied and laterally spreading ground, Earthquake Spectra, 29(3), 733-755.
10.1193/1.4000156Chang, K.W., Segall, P., 2016, Injection-induced seismicity on basement faults including poroelastic stressing, Journal of Geophysical Research: Solid Earth, 121(4), 2708-2726.
10.1002/2015JB012561Chang, K.W., Yoon, H., 2020, Hydromechanical controls on the spatiotemporal patterns of injection-induced seismicity in different fault architecture: Implication for 2013-2014 Azle earthquakes, Journal of Geophysical Research: Solid Earth, 125, e2020JB020402.
10.1029/2020JB020402Cipolla, C., Weng, X., Mack, M., Ganguly, U., Gu, H., Kresse, O., Cohen, C., 2012, Integrating microseismic mapping and complex fracture modeling to characterize fracture complexity, Proceedings of the SPE/EAGE European Unconventional Resources Conference & Exhibition - From Potential to Production, Copenhagen, Denmark, cp-285.
10.2118/140185-MSDe Simone, S., Carrera, J., Vilarrasa, V., 2017, Superposition approach to understand triggering mechanisms of post-injection induced seismicity, Geothermics, 70, 85-97.
10.1016/j.geothermics.2017.05.011Deichmann, N., Giardini, D., 2009, Earthquakes induced by the stimulation of an enhanced geothermal system below Basel (Switzerland), Seismological Research Letters, 80, 784-798.
10.1785/gssrl.80.5.784Deng, K., Liu, Y., Harrington, R.M., 2016, Poroelastic stress triggering of the December 2013 Crooked Lake, Alberta, induced seismicity sequence, Geophysical Research Letters, 43, 8482-8491.
10.1002/2016GL070421Dütschke, E., 2011, What drives local public acceptance - Comparing two cases from Germany, Energy Procedia, 4, 6234-6240.
10.1016/j.egypro.2011.02.636Ellsworth, W.L., 2013, Injection-induced earthquakes, Science, 341, 1225942.
10.1126/science.122594223846903Ge, S., Saar, M.O., 2022, Review: Induced seismicity during geoenergy development-A hydromechanical perspective, Journal of Geophysical Research: Solid Earth, 127(3), e2021JB023141.
10.1029/2021JB023141Goebel, T.H.W., Weingarten, M., Chen, X., Haffener, J., Brodsky, E.E., 2017, The 2016 Mw5.1 Fairview, Oklahoma earthquakes: Evidence for long-range poroelastic triggering at >40 km from fluid disposal wells, Earth and Planetary Science Letters, 472, 50-61.
10.1016/j.epsl.2017.05.011Haug, J.K., Stigson, P., 2016, Local acceptance and communication as crucial elements for realizing CCS in the Nordic region, Energy Procedia, 86, 315-323.
10.1016/j.egypro.2016.01.032Hoffmann, J., Hafner, C., Leidenberger, P., Hesselbarth, J., Burger, S., 2009, Comparison of electromagnetic field solvers for the 3D analysis of plasmonic nano antennas, Proceedings of SPIE, 7390, 174-184.
10.1117/12.828036Horton, S., 2012, Disposal of hydrofracking waste fluid by injection into subsurface aquifers triggers earthquake swarm in central Arkansas with potential for damaging earthquake, Seismological Research Letters, 83, 250-260.
10.1785/gssrl.83.2.250Hughes, K.L.H., Masterlark, T., Mooney, W.D., 2010, Poroelastic stress-triggering of the 2005 M8.7 Nias earthquake by the 2004 M9.2 Sumatra-Andaman earthquake, Earth and Planetary Science Letters, 293, 289-299.
10.1016/j.epsl.2010.02.043Hui, G., Chen, S., Chen, Z., He, Y., Wang, S., Gu, F., 2021, Investigation on two M
w 3.6 and M
w 4.1 earthquakes triggered by poroelastic effects of hydraulic fracturing operations near Crooked Lake, Alberta, Journal of Geophysical Research: Solid Earth, 126, e2020JB020308.
10.1029/2020JB020308Jha, B., Juanes, R., 2014, Coupled multiphase flow and poromechanics: A computational model of pore pressure effects on fault slip and earthquake triggering, Water Resources Research, 50, 3776-3808.
10.1002/2013WR015175Jin, L., Zoback, M.D., 2018, Fully dynamic spontaneous rupture due to quasi-static pore pressure and poroelastic effects: An implicit nonlinear computational model of fluid-induced seismic events, Journal of Geophysical Research: Solid Earth, 123, 9430-9468.
10.1029/2018JB015669Keranen, K.M., Weingarten, M., Abers, G.A., Bekins, B.A., Ge, S., 2014, Sharp increase in central Oklahoma seismicity since 2008 induced by massive wastewater injection, Science, 345, 448-451.
10.1126/science.125580224993347Kim, H.S., Kim, M.S., Kim, N.W., So, B.D., 2022, Numerical investigation for the effect of the subducting slab geometry on the postseismic deformation using finite element method, Journal of the Geological Society of Korea, 58, 191-203 (in Korean with English abstract).
10.14770/jgsk.2022.58.2.191Kim, S., Hosseini, S.A., 2014, Above-zone pressure monitoring and geomechanical analyses for a field-scale CO
2 injection project in Cranfield, MS, Greenhouse Gases: Science and Technology, 4(1), 81-98.
10.1002/ghg.1388King, G.C., Stein, R.S., Lin, J., 1994, Static stress changes and the triggering of earthquakes, Bulletin of the Seismological Society of America, 84, 935-953.
Kraeusel, J., Möst, D., 2012, Carbon capture and storage on its way to large-scale deployment: Social acceptance and willingness to pay in Germany, Energy Policy, 49, 642-651.
10.1016/j.enpol.2012.07.006Lee, C.I., Min, K.B., 2013, Effect of ground vibration on surface structures and human environments -Application of blasting vibration to induced seismicity in EGS hydraulic stimulation-, Tunnel and Underground Space, 23, 521-537 (in Korean with English abstract).
10.7474/TUS.2013.23.6.521Lee, H.J., Park, E.G., Kim, K.J., Park, K.H., 2008, A joint application of DRASTIC and numerical groundwater flow model for the assessment of groundwater vulnerability of Buyeo-eup area, Journal of Soil and Groundwater Environment, 13, 77-91 (in Korean with English abstract).
Lee, H.J., So, B.D., 2020, Numerical simulation of coseismic and postseismic deformation using finite element modeling with weak elastic fault, Journal of the Geological Society of Korea, 56(6), 771-787 (in Korean with English abstract).
10.14770/jgsk.2020.56.6.771Lee, S.H., So, B.D., 2019, Two dimensional finite element numerical model for slab detachment using Arbitrary Lagrangian Eulerian and remeshing, Journal of the Geological Society of Korea, 55(6), 663-682 (in Korean with English abstract).
10.14770/jgsk.2019.55.6.663McCormack, K.A., Hesse, M.A., 2018, Modeling the poroelastic response to megathrust earthquakes: A look at the 2012
Mw 7.6 Costa Rican event, Advances in Water Resources, 114, 236-248.
10.1016/j.advwatres.2018.02.014McCormack, K., Hesse, M.A., Dixon, T., Malservisi, R., 2020, Modeling the contribution of poroelastic deformation to postseismic geodetic signals, Geophysical Research Letters, 47(8), e2020GL086945.
10.1029/2020GL086945Nolte, K.A., Tsoflias, G.P., Bidgoli, T.S., Lynn W.W., 2017, Shear-wave anisotropy reveals pore fluid pressure-induced seismicity in the U.S. midcontinent, Science Advances, 3, e1700443.
10.1126/sciadv.170044329255798PMC5733107Pampillón, P., Santillán, D., Mosquera, J.C., Cueto-Felgueroso, L., 2018, Dynamic and quasi-dynamic modeling of injection-induced earthquakes in poroelastic media, Journal of Geophysical Research: Solid Earth, 123, 5730-5759.
10.1029/2018JB015533Papadimitriou, E.E., 2002, Mode of strong earthquake recurrence in the central Ionian Islands (Greece): Possible triggering due to Coulomb stress changes generated by the occurrence of previous strong shocks, Bulletin of the Seismological Society of America, 92(8), 3293-3308.
10.1785/0120000290Piombo, A., Martinelli, G., Dragoni, M., 2005, Post-seismic fluid flow and Coulomb stress changes in a poroelastic medium, Geophysical Journal International, 162, 507-515.
10.1111/j.1365-246X.2005.02673.xRathnaweera, T.D., Wu, W., Ji, Y., Gamage, R.P., 2020, Understanding injection-induced seismicity in enhanced geothermal systems: From the coupled thermo-hydro-mechanical-chemical process to anthropogenic earthquake prediction, Earth-Science Reviews, 205, 103182.
10.1016/j.earscirev.2020.103182Rinaldi, A.P., Vilarrasa, V., Rutqvist, J., Cappa, F., 2015, Fault reactivation during CO
2 sequestration: Effects of well orientation on seismicity and leakage, Greenhouse Gases: Science and Technology, 5, 645-656.
10.1002/ghg.1511Rutqvist, J., Birkholzer, J., Cappa, F., Tsang, C.F., 2007, Estimating maximum sustainable injection pressure during geological sequestration of CO
2 using coupled fluid flow and geomechanical fault-slip analysis, Energy Conversion and Management, 48, 1798-1807.
10.1016/j.enconman.2007.01.021Rutqvist, J., Vasco, D.W., Myer, L., 2010, Coupled reservoir-geomechanical analysis of CO
2 injection at In Salah, Algeria, Energy Procedia, 1(1), 1847-1854.
10.1016/j.egypro.2009.01.241Safari, R., Ghassemi, A., 2016, Three-dimensional poroelastic modeling of injection induced permeability enhancement and microseismicity, International Journal of Rock Mechanics and Mining Sciences, 84, 47-58.
10.1016/j.ijrmms.2015.12.007Segall, P., 1989, Earthquakes triggered by fluid extraction, Geology, 17, 942-946.
10.1130/0091-7613(1989)017<0942:ETBFE>2.3.CO;2Segall, P., Lu, S., 2015, Injection-induced seismicity: Poroelastic and earthquake nucleation effects, Journal of Geophysical Research: Solid Earth, 120, 5082-5103.
10.1002/2015JB012060Shan, B., Xiong, X., Wang, R., Zheng, Y., Yang, S., 2013, Coulomb stress evolution along Xianshuihe-Xiaojiang Fault System since 1713 and its interaction with Wenchuan earthquake, May 12, 2008, Earth and Planetary Science Letters, 377-378, 199-210.
10.1016/j.epsl.2013.06.044Shukla, R., Ranjith, P., Haque, A., Choi, X., 2010, A review of studies on CO
2 sequestration and caprock integrity, Fuel, 89(10), 2651-2664.
10.1016/j.fuel.2010.05.012Stanislavsky, E., Garven, G., 2002, The minimum depth of fault failure in compressional environments, Geophysical Research Letters, 29(24), 8-1.
10.1029/2002GL016363Stephens, J.C., Jiusto, S., 2010, Assessing innovation in emerging energy technologies: Socio-technical dynamics of carbon capture and storage (CCS) and enhanced geothermal systems (EGS) in the USA, Energy Policy, 38, 2020-2031.
10.1016/j.enpol.2009.12.003Tapia, J.F.D., Lee, J., Ooi, R.E., Foo, D.C., Tan, R.R., 2018, A review of optimization and decision-making models for the planning of CO
2 capture, utilization and storage (CCUS) systems, Sustainable Production and Consumption, 13, 1-15.
10.1016/j.spc.2017.10.001Terwel, B.W., ter Mors, E., Daamen, D.D., 2012, It’s not only about safety: Beliefs and attitudes of 811 local residents regarding a CCS project in Barendrecht, International Journal of Greenhouse Gas Control, 9, 41-51.
10.1016/j.ijggc.2012.02.017van Egmond, S., Hekkert, M.P., 2015, Analysis of a prominent carbon storage project failure - The role of the national government as initiator and decision maker in the Barendrecht case, International Journal of Greenhouse Gas Control, 34, 1-11.
10.1016/j.ijggc.2014.12.014Wang, H., 2000, Theory of linear poroelasticity with applications to geomechanics and hydrogeology (Vol. 2), Princeton University Press, 304p.
10.1515/9781400885688Weingarten, M., Ge, S., Godt, J.W., Bekins, B.A., Rubinstein, J.L., 2015, High-rate injection is associated with the increase in US mid-continent seismicity, Science, 348(6241), 1336-1340.
10.1126/science.aab134526089509Wetzler, N., Shalev, E., Göbel, T., Amelung, F., Kurzon, I., Lyakhovsky, V., Brodsky, E.E., 2019, Earthquake swarms triggered by groundwater extraction near the dead sea fault, Geophysical Research Letters, 46, 8056-8063.
10.1029/2019GL083491Williams, C.A., Wallace, L.M., 2015, Effects of material property variations on slip estimates for subduction interface slow-slip events, Geophysical Research Letters, 42, 1113-1121.
10.1002/2014GL062505Willson, J.P., Lunn, R.J., Shipton, Z.K., 2007, Simulating spatial and temporal evolution of multiple wing cracks around faults in crystalline basement rocks, Journal of Geophysical Research: Solid Earth, 112, B08408.
10.1029/2006JB004815Xue, L., Moucha, R., Scholz, C.A., 2022, Climate-driven stress changes and normal fault behavior in the Lake Malawi (Nyasa) Rift, East Africa, Earth and Planetary Science Letters, 593, 117693.
10.1016/j.epsl.2022.117693Yeck, W.L., Weingarten, M., Benz, H.M., McNamara, D.E., Bergman, E.A., Herrmann, R.B., Rubinstein, J.L., Earle, P.S., 2016, Far-field pressurization likely caused one of the largest injection induced earthquakes by reactivating a large preexisting basement fault structure, Geophysical Research Letters, 43, 10198-10207.
10.1002/2016GL070861Yeo, I.W., Brown, M., Ge, S., Lee, K.K., 2020, Causal mechanism of injection-induced earthquakes through the M
w 5.5 Pohang earthquake case study, Nature Communications, 11, 1-12.
10.1038/s41467-020-16408-032457321PMC7251101Yim, J., Min, K.B., 2022, A hydro-mechanical basic study on the effect of shut-in on injection-induced seismic magnitude, Tunnel and Underground Space, 30, 203-218 (in Korean with English abstract).
Zhang, Y., Person, M., Rupp, J., Ellett, K., Celia, M.A., Gable, C.W., Bowen, B., Evans, J., Bandilla, K., Mozley, P., Dewers, T., Elliot, T., 2013, Hydrogeologic controls on induced seismicity in crystalline basement rocks due to fluid injection into basal reservoirs, Groundwater, 51(4), 525-538.
10.1111/gwat.1207123745958Zienkiewicz, O.C., Taylor, R.L., 2005, The finite element method for solid and structural mechanics, Elsevier, 736p.


