

Introduction
Theoretical Background
Borehole Fluid Injection Tests
One-dimensional Radial Diffusion Equation
In Situ Permeability Measurement
Quantitative Risk Assessment
Conclusions
Introduction
Rock permeability is a fundamental parameter to understand underground fluid flow in porous media (Bjorlykke, 1993; Luijendijk and Gleeson, 2014; Uehara and Takahashi, 2014). A reliable estimation of rock permeability is especially essential for characterizing oil and gas reservoirs where fluid migration and production efficiency depend highly on rock permeability (Bethke, 1989; Knipe et al., 1998; Crolet and Hatri, 1998; Bai and Elsworth, 2000). It is also important for CO2 geological sequestration projects, in which permeability of CO2 storage formations and overlying cap-rocks have significant impact on the success of the projects (Cappa and Rutqvist, 2011).
Conventionally, rock permeability is determined either by laboratory tests in recovered cores (Aplin et al., 1999; Yang and Aplin, 2007; Alireza and Rick, 2015), or by in situ tests (pressure pulse test, Lugeon, and packer permeability test) conducted in boreholes (Johnson et al., 1966; Pearson and Money, 1977; Oliver, 1992; Domenico and Schwartz, 1998; Mollah and Sayed, 1995; Hamm et al., 2007). The laboratory permeability tests, in which fluid is allowed to migrate under a controlled boundary condition, provide relatively precise estimates of core-scale permeability. However, laboratory measurements may not always provide representative large-scale permeability since (1) recovered rock samples may be disturbed during extraction of the cores, causing alteration of permeability (Mollah and Sayed, 1995), and (2) there may be a scale dependency in permeability (Rasmussen et al., 1993). Thus, in situ permeability measurements are normally preferred to obtain more reliable permeability estimates. In situ tests normally provide permeability estimates at a larger scale, but generally under uncontrollable drainage conditions at the boundary. Thus, interpretations of the in situ test results are often more difficult than those from laboratory tests.
Existing in situ permeability tests have been developed based on their successful applications in the field. The Lugeon test conducted by using a pair of packer to isolated test interval is used to determine adequate hydraulic conductivity in the field (Pearson and Money, 1997). Packer tests can also be used to perform pulse tests (Selvadurai and Carnaffan, 1997), which are used to measure formation flow properties between wells in which the pressure is recorded and measured using a sensitive differential pressure gauge following a series of flow rate changes in the well (Johnson et al., 1966). To perform these techniques, we need open-hole section isolated between expandable double packers or the bottom hole sealed with a packer, as well as additional time to perform these tests.
On the other hand, fluid injection tests such as hydraulic fracturing tests and leak-off tests are quite routinely conducted during drilling. The purpose of such fluid injection tests is either to measure stress conditions at depth or to assess borehole/casing integrity and frac-gradient needed for further drilling (Raaen et al., 2006; Lin et al., 2008). During these tests, pressure and injected volume of fluid are recorded, which may provide useful information on permeability. If we are able to decipher the recorded data into permeability, it would be beneficial in terms of time and cost. In this study, we investigate the feasibility of using leak-off test results to estimate in situ permeability in the frame of one-dimensional radial diffusion equation that suits for the configuration of the injection tests.
Theoretical Background
Borehole Fluid Injection Tests
We briefly describe how leak-off tests are conducted. After installing casing in a borehole, drillers test the integrity of casing by injecting fluid into the borehole, raising the pressure, and checking how much pressure the borehole can sustain (Fig. 1). Fluid is injected normally at a constant flow rate (White et al., 2002), while pressure and the flow rate of the injected fluid are recorded continuously at the surface. Depending on how much the pressure is attained, the test is called formation integrity test (FIT), leak-off test (LOT), or extended leak-off test (XLOT). FIT is named when the maximum pressure at the bottom hole is below leak-off pressure (LOP) where the relation between pressure-injected fluid volume starts to deviate the initial linear trend (Addis et al., 1998). If the pressure is raised further above LOP, the test is called LOT. LOP provides an indirect information about fracture gradient necessary for further drilling below the current casing shoe (Gjønnes et al., 1998). A direct measurement for the fracture gradient is made by reaching formation breakdown pressure and subsequently extending the hydraulically-induced fractures, which is called XLOT. Since drillers normally do not want to breakdown the formation, this fluid injection test is often terminated immediately after reaching LOP before formation breakdown.
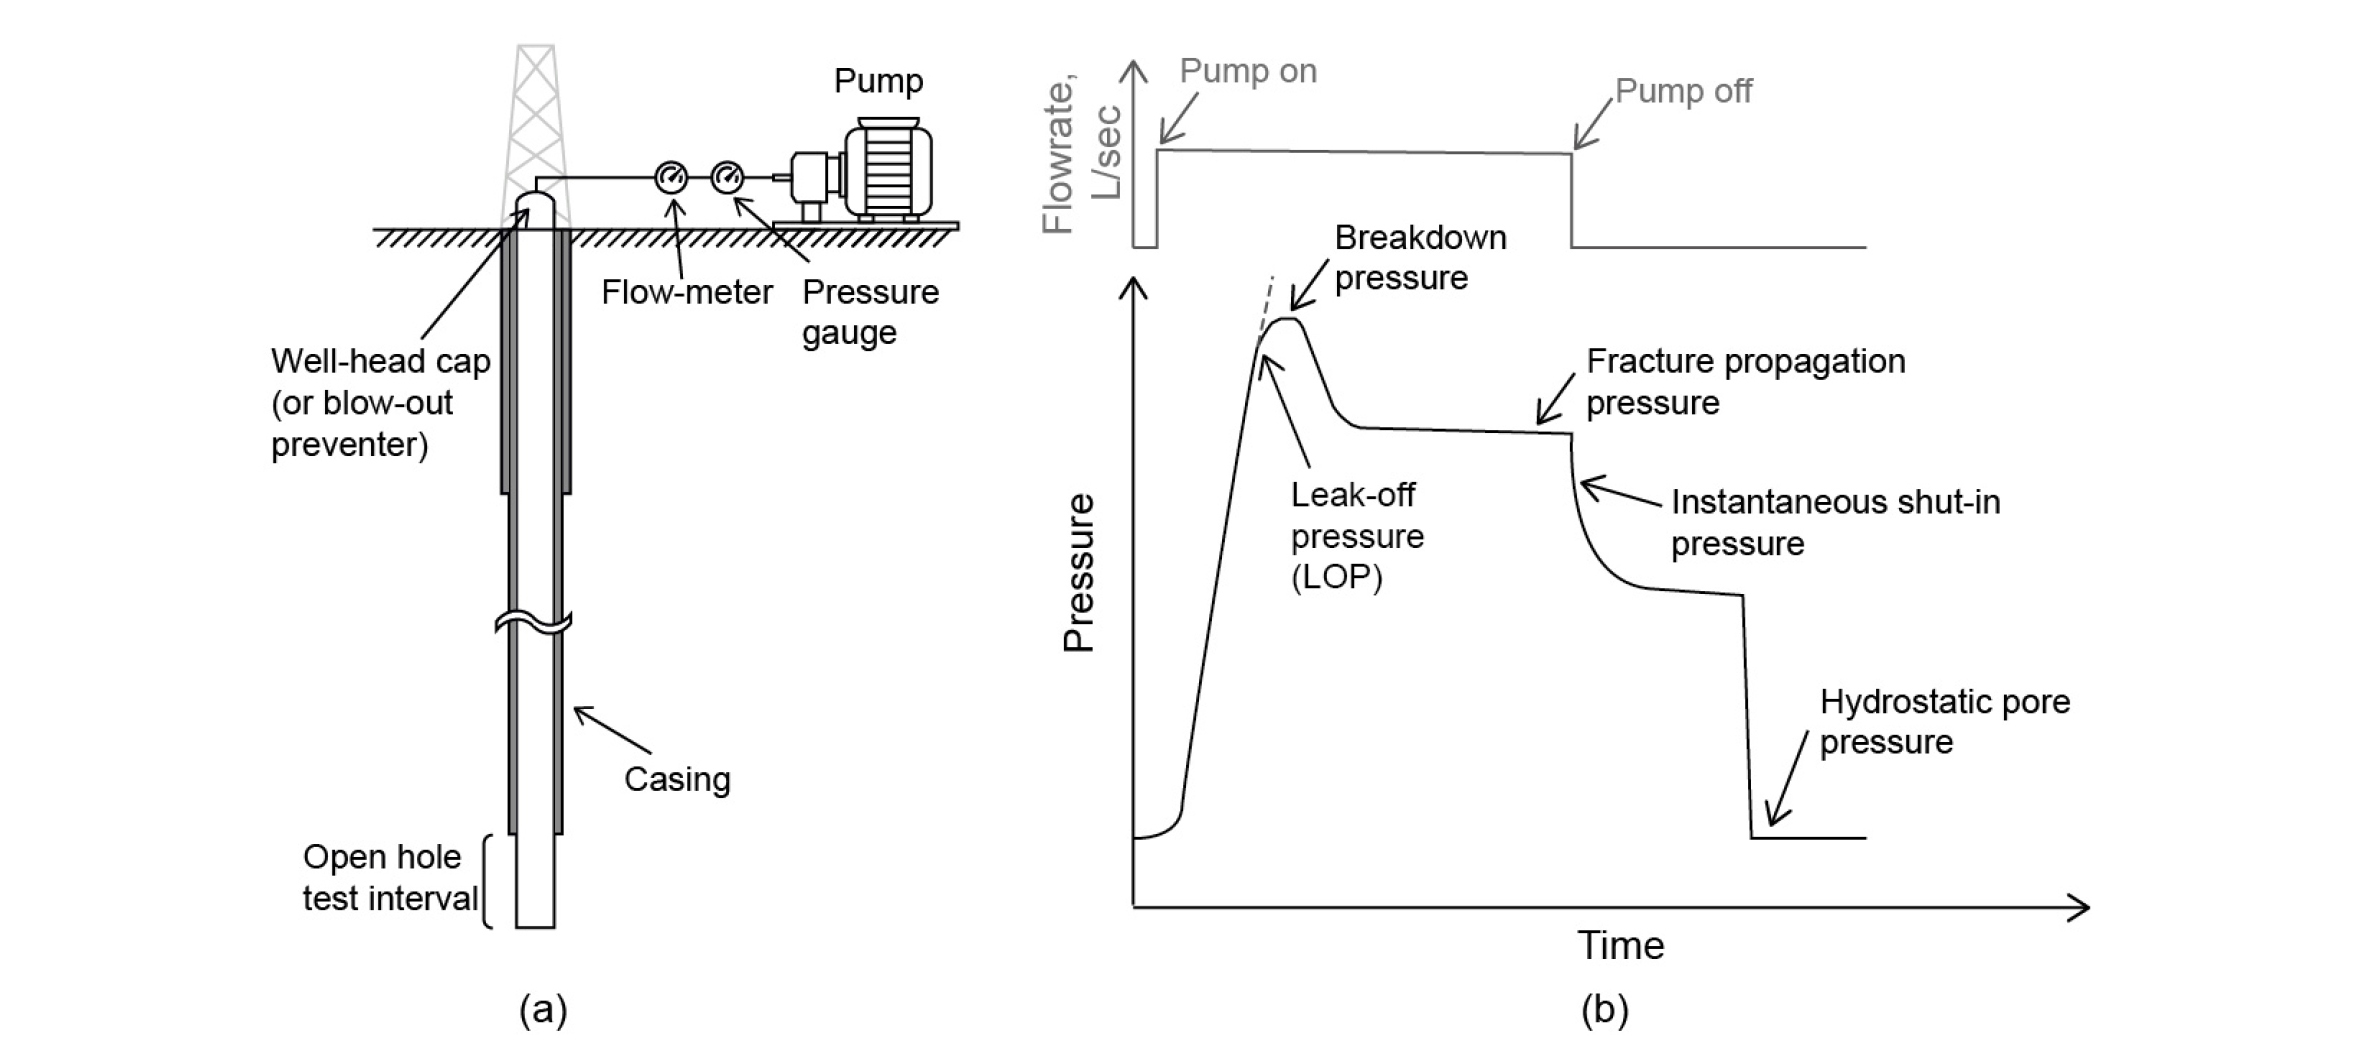
In these fluid injection tests, boreholes are cased entirely except for a short open hole section below the casing shoe at the bottom. Thus, the borehole fluid pressure is transferred into the rock formation at the open hole section, while fluid is continuously discharged through the rock formation during injection. Note that pressure and injected volume of fluid are measured at the surface. If we can estimate pressure conditions at the bottom and the amount of fluid that flows out through the open hole section, it may be possible to estimate permeability of the rock at that section.
A simplest and most straightforward approach is based on following assumptions. We assume that the pressure at the bottom hole be the pressure at the surface plus hydrostatic pressure exerted by the column of fluid along the borehole. The estimation of flowing-out volume of fluid through the open hole section is somewhat complicated because of possible casing expansion and fluid compressibility during pressurization. If we assume that the fluid compressibility is ignorable and casing is fairly rigid, the injected volume of fluid will drain partly through the open hole formation and any built-up amount of fluid volume acts as a pressure riser. The rate of drainage through the open hole section will depend on permeability of the rock formation. Thus, the rise of borehole pressure as a function of time can be used as a measure of rock permeability. In the following section, we derive an explicit solution that expresses the measure quantitatively by means of radial diffusion equation.
One-dimensional Radial Diffusion Equation
Darcy’s law can typically be used to describe fluid flow in steady-state condition, in which pressure gradient is time-independent (Lohman, 1972; Bethke, 1989; Wang and Yeh, 2008). In fluid injection tests described above, the pressure condition changes continuously with time, implying that Darcy’s law is not applicable. We use one-dimensional radial diffusion equation for estimating permeability from transient flow in wellbore configuration (Bai and Elsworth, 2000; Wu and Pruess, 2000). The diffusion equation we use incorporates coupling process between rock deformation and fluid movement during injection (Wu and Pruess, 2000). The derivation of the diffusion equation is given in detail by Kruseman et al. (1994) and Wu and Pruess (2000).
Here we briefly review the derivation. Assumptions imposed are that the rock formation is homogeneous and isotropic such that porosity (Φ) and permeability (k) are constant, and that total compressibility (c) of rock and fluid is constant. The diffusion equation is of the form:
 (1)
(1)
where P is pressure, m is fluid viscosity, R is radius, and t is time. Initial and boundary conditions are needed to derive the solution. The initial condition is that pressure is its virgin state at t=0: . Two boundary conditions are that (a) drainage rate through the open wellbore section is Q, and that (b) pressure at infinite distance from the well remains constant at its initial pressure (Pi). Given these conditions, we can obtain the exact solution in the form of an integral solution (Kruseman et al., 1994; Wu and Pruess, 2000):
 (2)
(2)
which is also known as the exact Theis’s solution. Although Eq. (2) looks somewhat complicated, its solution is well known and available for most commercial software such as MATLAB. Eq. (2) expresses how the pressure evolves with time over the reservoir during the fluid injection tests. As an example, we plot pressure distribution in the reservoir for different times in Fig. 2a. In this example, we assume constant permeability (5×10-16 m2) of rock formation. As fluid is injected, pressure rises and its front advances gradually with time. By the time of t=400 sec, the pressure front reaches approximately 3 m from the well.
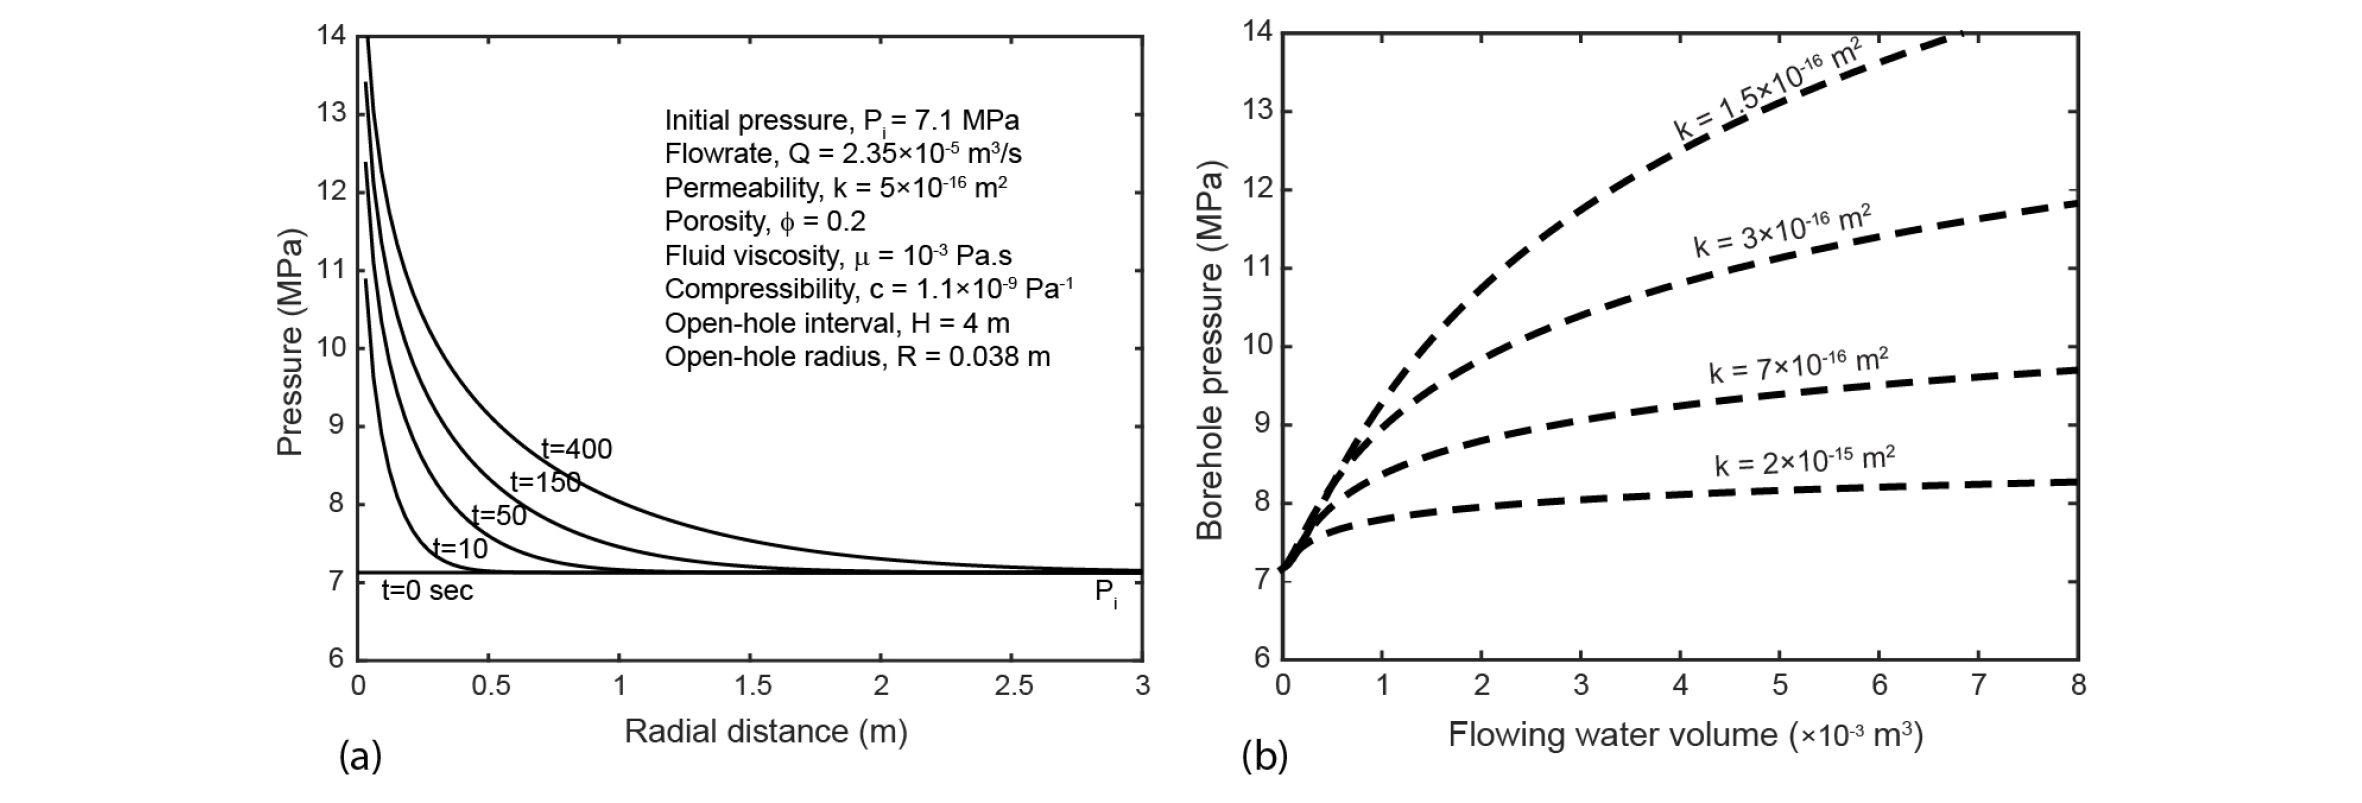
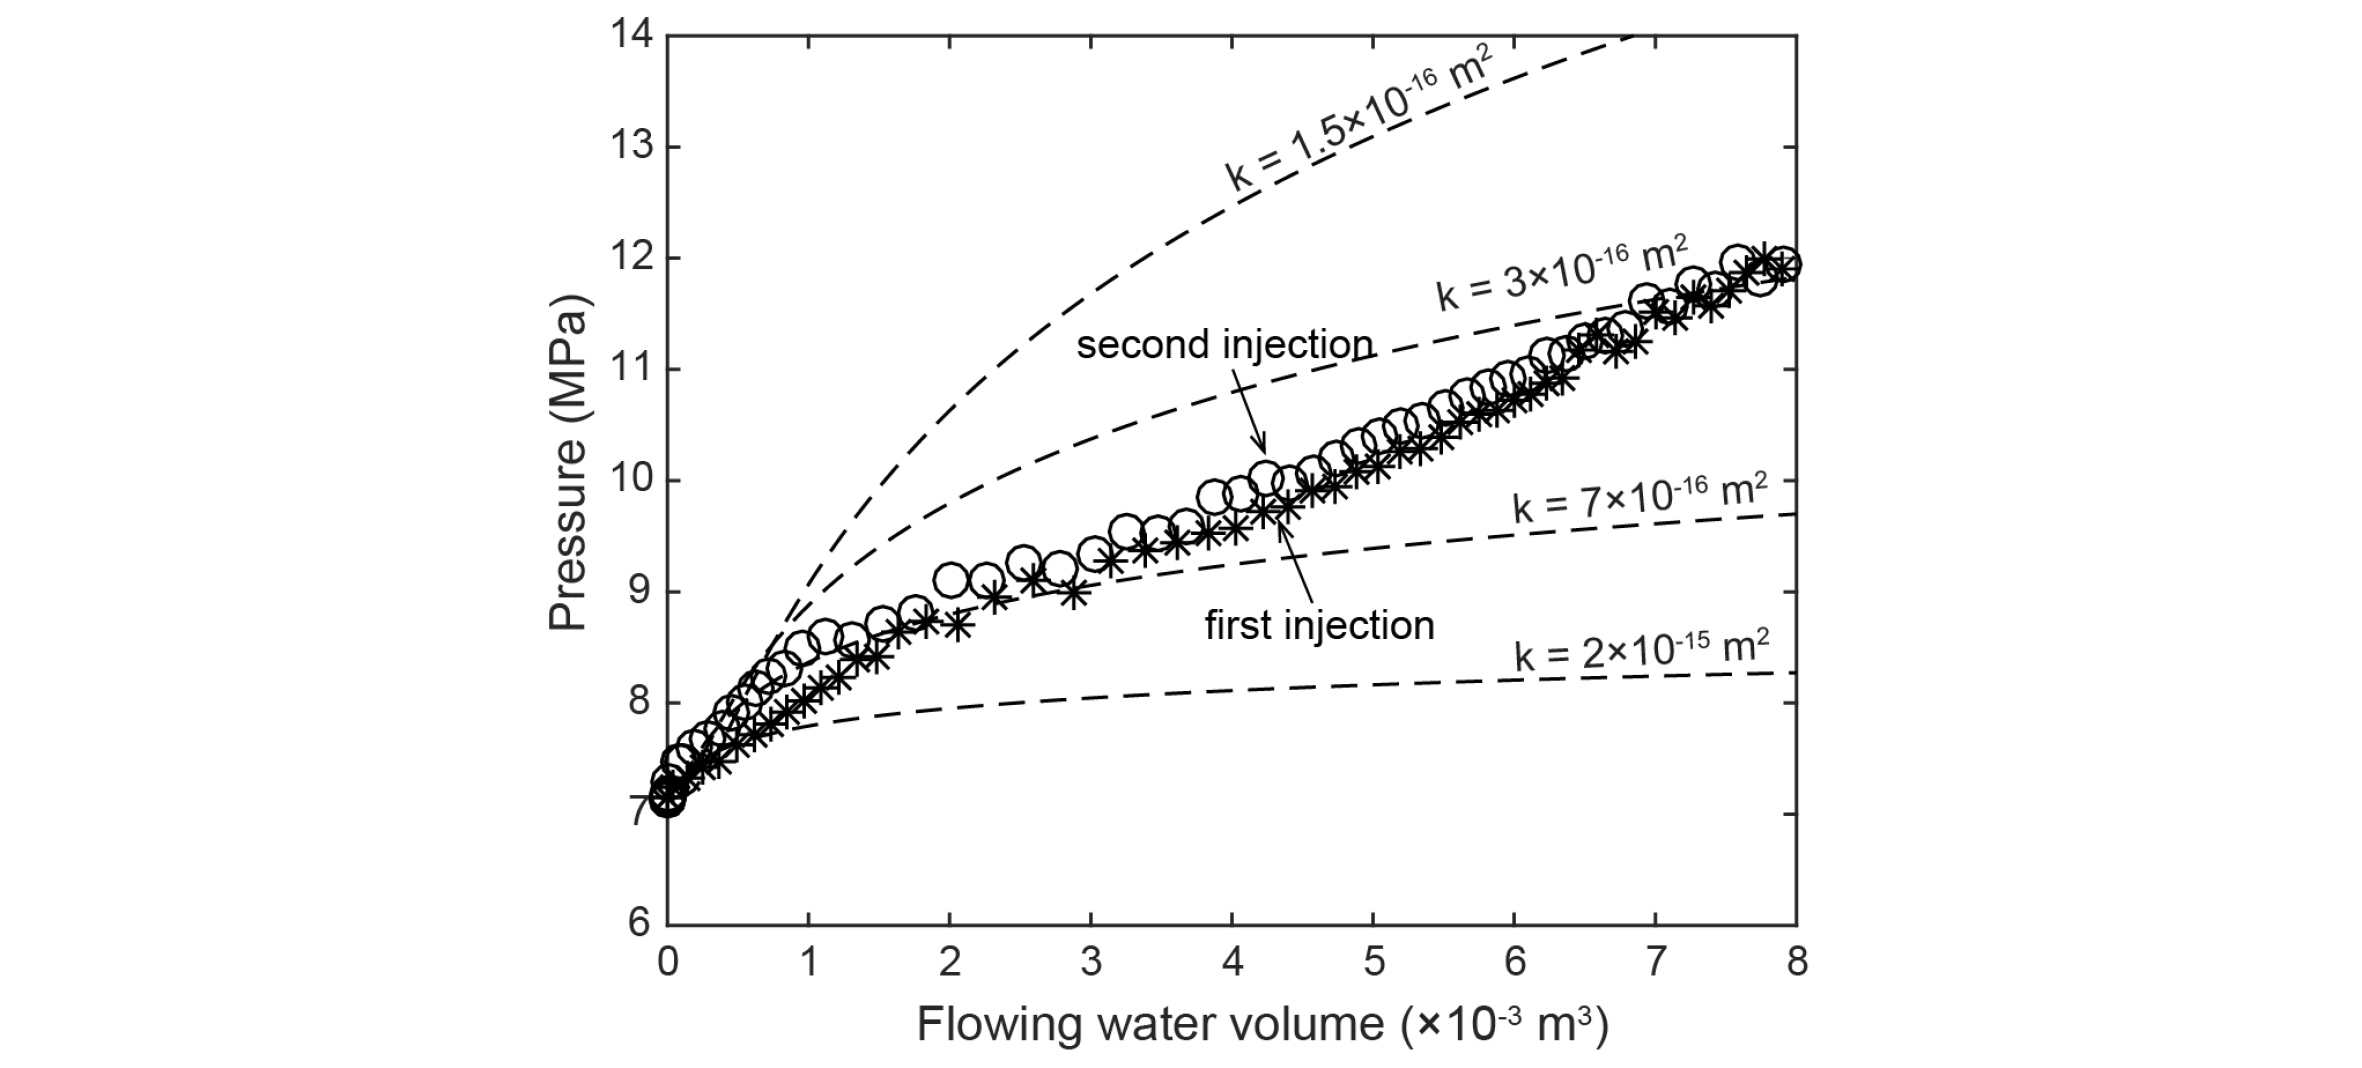
Since we are interested in pressure in the borehole, we extract the borehole pressure and plot it as a function of time, i.e., P(R=R0, t) in Fig. 2b for different permeabilities of rock formation. As expected, the rate of pressure increase varies depending on permeability. As rock permeability is lower, the drained water volume would be smaller, resulting in a faster pressure increase with time. Thus, if we can measure pressure change with time in borehole, it can give an estimate of rock permeability.
In Situ Permeability Measurement
We apply the exact Theis’s solution (Eq. 2) to a leak-off test (LOT) we conducted in a borehole at offshore Pohang basin, southeast Korea. The site is the location where CO2 geological storage will be tested. The water depth is approximately 13 m. The borehole was drilled for the purpose of exploration and coring. After the borehole was drilled down to 700 m, casing was installed, followed by cement-grouting and 4 days of curing. Then, the hole was further drilled below the casing shoe to create an open-hole interval (length: 4 m, diameter: 76 mm) at the bottom. We ran LOT at a depth of 700 m below casing shoe mainly in order to estimate stress conditions at that depth. The rock formation at that depth is a part of cap-rock consisting of mudstone, which is approximately 50 m above the interface between cap-rock and storage reservoir. The measurement of permeability in the mudstone is important to ensure the sealing integrity as cap-rock formations.
The borehole was fully filled with water initially. After closing the casing head using an end-cap, water was injected into the borehole using a hydraulic pump at an approximately constant flowrate (2.4×10⁻⁵ m3/s). Since we assume that water compressibility is ignorable, the bottom-hole pressure can be estimated to be the surface pressure recorded plus hydrostatic water column pressure (= 7.1 MPa). At the first pressurization, the borehole pressure measured at the surface increased monotonically up to as high as 9 MPa, which corresponds to 16.1 MPa at the bottom hole, upon which breakdown was attained. At the second and third pressurizations, bottom hole pressures reached 12.5 MPa and 13.0 MPa, respectively, which are presented in Fig. 3.
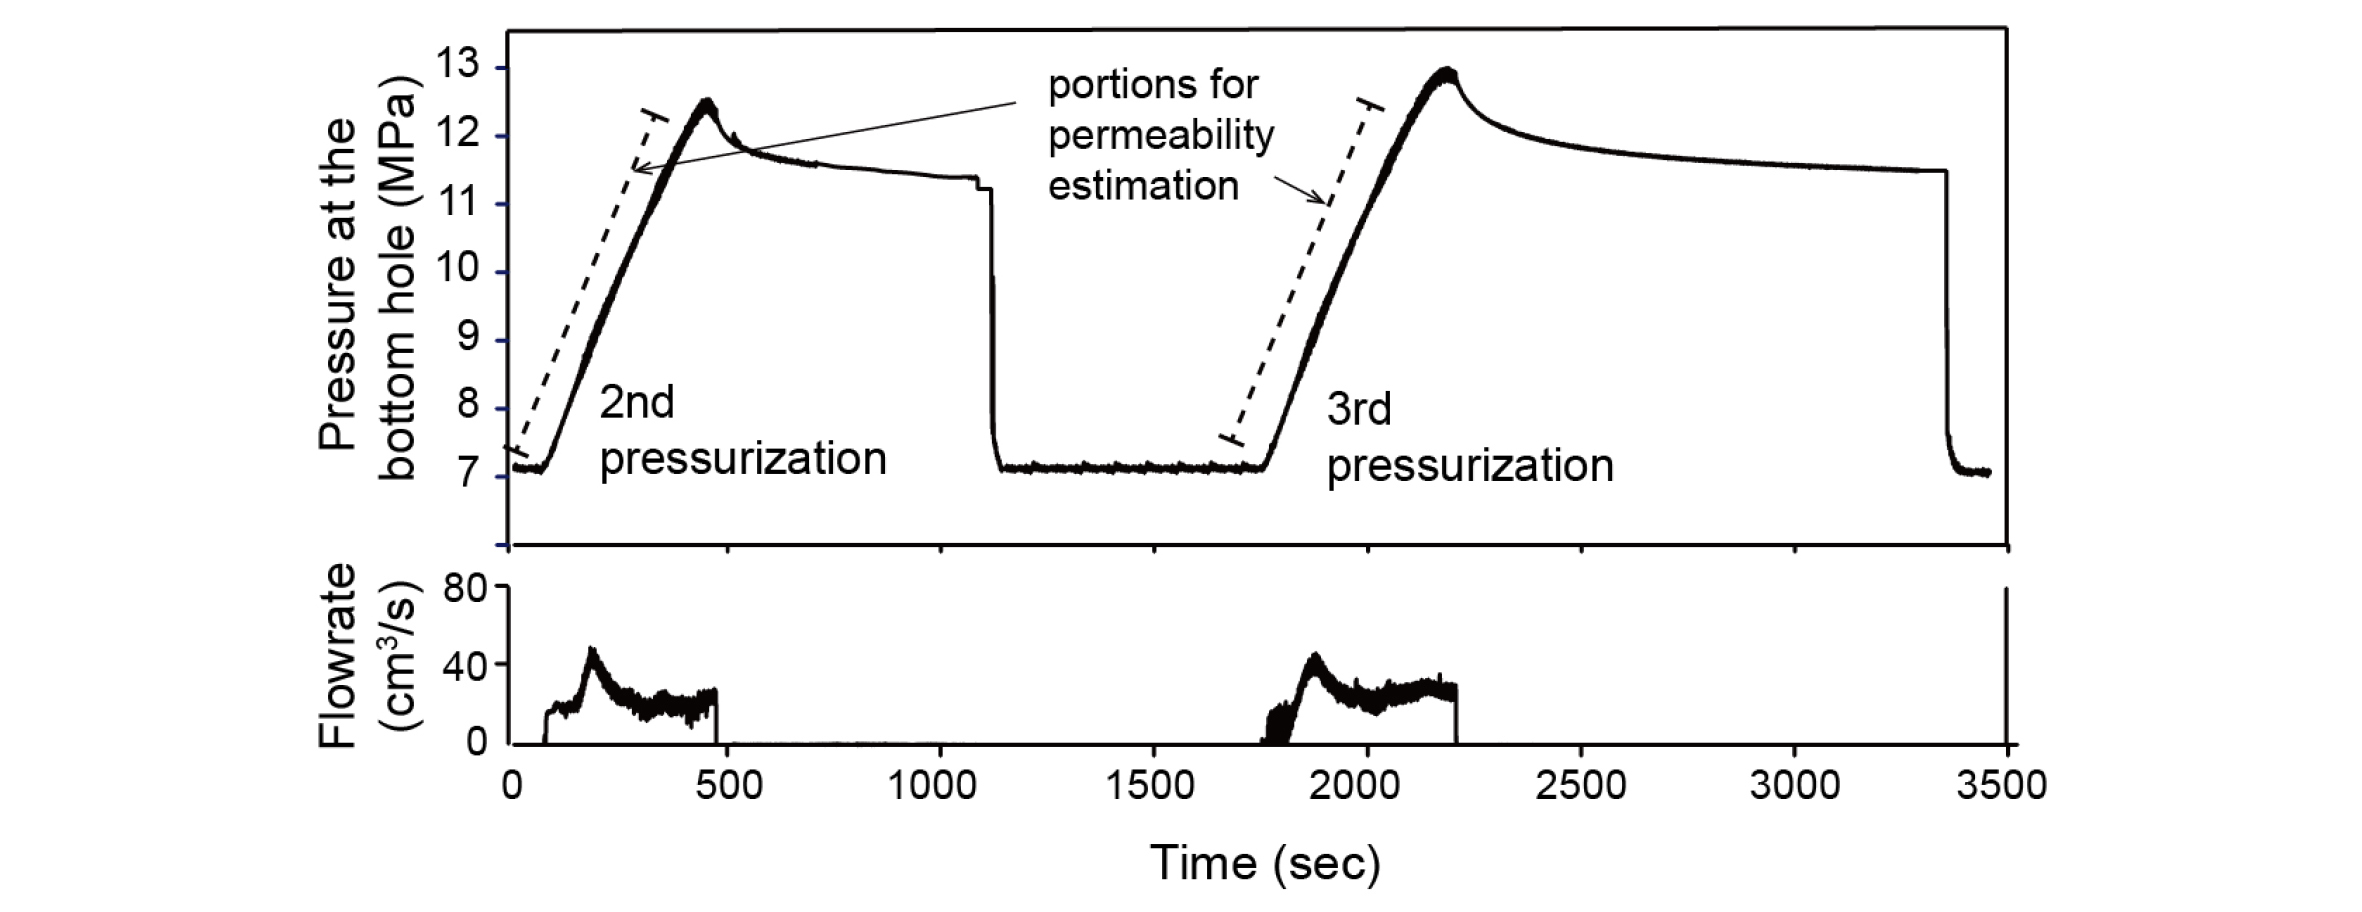
For permeability estimation, we need pressure at the bottom hole and water volume that flows out through the open hole section during pressurization stages. Injected volume of water can be calculated by multiplying flowrate and time. It should be noted, however, that the injected water volume may be different from the water volume that flows out through the open hole section. It is because the casing would undergo elastic expansion during pressurization, which accommodates water in the borehole. Thus, the flowing-out water volume through open-hole interval should be total injected volume minus volume expansion in the casing. To check the significance of casing volume expansion due to pressurization, we use linear elastic parameters for the steel casing to calculate the volume expansion within the casing due to pressure increment (with a help of a commercial finite element method software). The expanded volume in the 700 m long casing is calculated to be approximately 9% of injected water volume. We substract these values from the injected volume of water to estimate the water volume that flows out through the open hole section.
We simply overlap the calculated pressure-water volume data in the plot of theoretical curves shown in Fig. 2b. Although there is some difference in the shape of pressure rise with injected water volume between real data and theoretically derived curves, the comparison provides an estimate of permeability, which is in a range between (3-7)×10-16 m2 from two repeat injection tests. This value corresponds to the upper bound of the typical range of mudstone permeability (10-23-10-16 m2) (Neuzil, 1994; Yang and Aplin, 2007).
Quantitative Risk Assessment
The diffusion equation enables us to estimate in situ rock permeability through the injection tests beyond their purpose. It means that those available fluid injection tests could be useful methods for measuring in situ permeability at low risk and cost instead of conventional permeability tests. However, the in situ permeability measurements have major shortcomings attributed to uncertainty in parameters used in the diffusion equation, such as total compressibility of fluid and rock matrix, formation porosity, and even the length of open hole section which is measured often inaccurately.
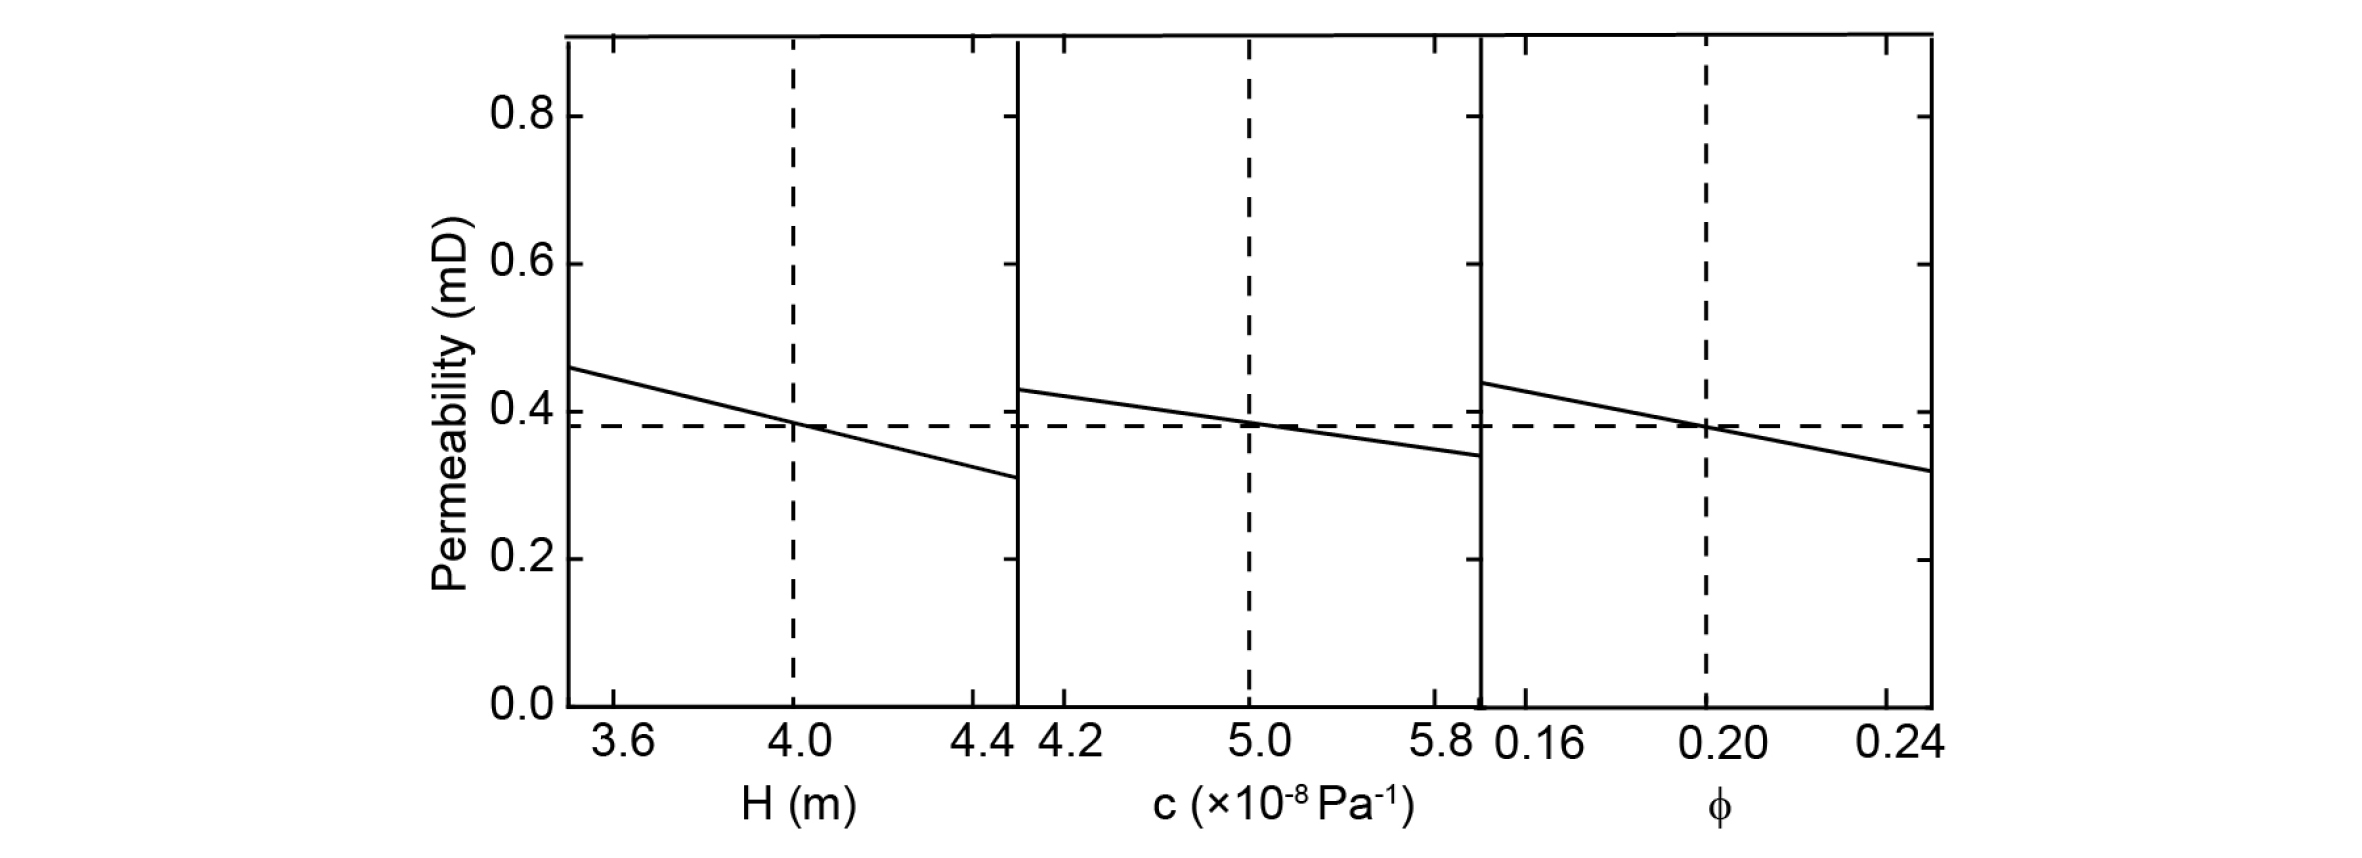
To gain insight into the effect of the uncertainty in such parameters on permeability estimation, we conduct the quantitative risk assessment (QRA), which has been applied to many aspects in petroleum industry for the purpose of casing design and wellbore stability analysis (Liang, 2002; Moos et al., 2003; Zoback, 2007). We use the probability distribution functions to take minimum, maximum, and the most likely values of individual parameters. By varying a parameter while keeping the others constant, we calculate permeability variation with the varying parameter. As expected, permeability varies depending on how we assume individual parameters (Fig. 5). The slope of line in Fig. 5 corresponds to sensitivity of permeability to a parameter. Given the range of probability, however, permeability estimation is relatively less sensitive to total compressibility (c) and porosity (Φ) than length of open hole section (H). This indicates that the geometrical dimension of the test interval should be measured as accurately as possible to obtain reliable permeability estimates.
Conclusions
We attempted to utilize fluid injection test results to estimate permeability in borehole. The diffusion equation was incorporated to interpret the test results in terms of permeability. The permeability in mudstone formation was estimated to be (3-7)×10-16 m2, which is a little high, but within a range of values reported previously.
The use of fluid injection test such as leak-off test for estimating permeability may be cost-effective since leak-off tests are routinely conducted in deep drilling for the purpose of assessing casing integrity. There would be no need to spend additional time for running independent permeability test. Also, a benefit to use borehole injection tests is its ability to estimate permeability in a rock mass significantly larger than that used in laboratory. More tests and data should be available to make sure the reliability of the measurements. However, our preliminary QRA indicates that an accurate measurement of test interval size is important to enhance the reliability of results.
