Research Article

The Journal of Engineering Geology. 30 September 2022. 377-388
https://doi.org/10.9720/kseg.2022.3.377

ABSTRACT


MAIN

  • 서 론

  • 연구방법

  •   지진 카탈로그와 시공간 윈도우 설정

  •   차원 확장

  •   자료 전처리

  •   차원 축소

  • 결 과

  •   차원 확장 및 전처리 결과

  • 토의 및 결론

서 론

지진 카탈로그는 지진의 발생 시점, 진원의 위치, 규모에 대한 정보를 포함하는 일차적인 지진 자료로서, 이로부터 다양한 경험적 법칙이 유도되었다. 예를 들어, 수정된 Omori 법칙은 멱급수에 따라 여진 발생이 감소하고 전진 발생이 증가하는 현상을 설명한다(Kagan and Knopoff, 1978; Utsu and Ogata, 1995). 지진 발생 빈도와 규모의 관계를 나타내는 Gutenberg-Richter 법칙의 b-value는 일정한 시공간적 범위 내에서 대규모 지진(예, 2011 M9.0 Tohoku-Oki earthquake, 2004 M8.1 Sumatra Andaman earthquake) 발생 전에 급격히 감소하였다(Nuannin et al., 2005; Nanjo et al., 2012). 이와 같은 경험 법칙은 지진 활동 양상을 설명하기 위해 중요한 역할을 수행했지만, 최근 지수적으로 증가하고 있는 대량의 지진 자료를 분석하기 위한 방법의 필요성이 제기되고 있다(Marone, 2018; Beroza et al., 2021).

최근 다수의 연구는 대량의 지구물리/지진 자료를 효율적이고 정확하게 분류하고, 자료 사이의 관계를 파악하기 위해서 기계학습을 활용하고 있다(Bergen et al., 2019; Kong et al., 2019). 기계학습은 기존의 대량으로 축적된 지진파 기록을 학습하여 효율적이고 정확한 위상 발췌(Zhu and Beroza, 2019), 지진파 신호/잡음 구분(Meier et al., 2019)을 위해 사용되었다. 기계학습은 전문적이고 반복적인 지진 자료 처리를 자동화하였으며(Li et al., 2018; Chen, 2020), 기존에 탐지 하지 못했던 미소지진을 인지하여 고해상도 지진 카탈로그 구성을 가능하게 하였다(Huang et al., 2020; Liu et al., 2020). 최근 다수의 연구가 본진으로 인해 활성화된 복잡한 단층 구조를 규명하고(Tan et al., 2021), 여진 탐지 능력을 향상시키기 위해(Bregman and Rabin, 2019) 기계학습 기반의 고해상도 지진 카탈로그를 활용하고 있다.

원본 자료로부터 자료 전체를 대표하는 특징을 생성하고 추출하는 과정은 기계학습 모델의 성능을 향상시키기 위해 중요하다(Zhao et al., 2021; Di and Abubakar, 2022). 원본 자료를 가공하기 위한 대표적인 기법으로는 자료를 구성하는 특징 사이의 통계량 또는 관계식을 활용하여 자료의 특징 수를 증가시키는 차원 확장(feature expansion, Jung et al., 2021)과 특징 수를 감소시키면서 모델 학습에 중요한 특징을 보존하여 자료를 단순화하는 차원 축소(dimensional reduction, Vasan and Surendiran, 2016)가 있다. 본 연구는 지진 카탈로그에 차원 확장과 차원 축소를 적용하여 기계학습에 활용가능한 형태로 변환하였다. Global Centroid Moment Tensor카탈로그로부터 일정한 시공간 영역 내에서 발생했던 지진 정보(예, 지진 발생 시점, 진원의 위치, 지진 규모)를 수집한 후, 이를 대변하는 통계량으로 새로운 자료를 구성함으로써 원본 카탈로그의 차원을 확장하였다(Rouet-Leduc et al., 2017; McBeck et al., 2020). 각 특징의 상위한 단위로 인한 영향을 최소화하기 위해서 다양한 전처리 방법(예, 표준화, 최대-최소화)을 적용하였으며, 전처리 기법이 자료 변환에 미치는 영향과 결과를 조사하였다(Nolan et al., 2016; Li et al., 2018; Lv et al., 2021). 자료의 크기를 감소시키면서 주요 성분을 유지하기 위해서 전처리가 적용된 자료에 비지도 기계학습 기법 중 하나인 주성분 분석(principal component analysis)을 수행하고(Paolucci et al., 2017; Bolton et al., 2019; Giallini et al., 2021), 각 전처리 기법에 따른 주요 특징을 보존하기 위해 필요한 주성분 수를 비교하였다. 본 연구에서 적용한 차원 확장과 차원 축소 기법은 기계학습을 활용하여 일정한 시공간 영역에서 발생한 다수의 지진 사건의 정보를 효과적으로 분석하기 위해 사용될 수 있을 것이다.

연구방법

지진 카탈로그와 시공간 윈도우 설정

학습과 평가 자료는 높은 완성도의 지진 정보(예, 지진 발생 시간, 진원의 위치, 지진 규모 등)를 제공하는 Global Centroid Moment Tensor(GCMT) 카탈로그로 구성하였다(Kagan, 2003). 개선된 Centroid Moment Tensor(CMT) 알고리듬이 적용되어 M < 6.5인 지진 사건 비율이 증가한 2004년 이후의 GCMT 카탈로그로부터(Ekström et al., 2012) 다양한 규모의 지진 정보를 획득하였으며, 이로부터 지진 발생 시간, 진앙의 위도와 경도, 진원의 깊이, 지진의 규모 정보를 포함하는 36,699개의 전지구적 지진 사건을 수집하였다(Fig. 1의 Step 1). 이 중 M ≥ 6.5인 강진(Guerrieri et al., 2010)을 중심으로 위도와 경도가 3°인 사각형 영역을 설정하고(Fig. 1의 Step 2), 이 영역 내에서 M ≥ 6.5인 강진을 중심으로 10년간(Feng et al., 2015; Chamberlain et al., 2021) 발생한 지진 사건을 수집하였다(Fig. 1의 Step 3). 수집한 지진 사건의 최소 규모는 4.3이다. 윈도우의 공간 영역은 지진이 주변 단층의 응력 상태에 영향을 미치는 공간적 거리가 ~300 km인 것을 고려하였다(Lomnitz, 1996; Kilb et al., 2002). Toda et al.(2005)은 1992 M = 7.3 랜더스(Landers) 지진을 중심으로 300 km × 310 km의 공간 영역에서 발생한 M > 6.0의 지진이 해당 지역의 지진 활동을 변동시켰음을 보인 바 있다. 공간 윈도우 안에서 수집된 지진 사건은 시간 순서에 따라 50개씩 다수의 윈도우에 할당되었다(Nuannin et al., 2005; Fig. 1의 빨간 사각형). 하나의 윈도우를 생성한 후, 이 윈도우 안에서 가장 먼저 발생한 지진 사건을 제외하고 새로운 지진 사건을 추가하여 다음 윈도우를 생성한다. 예를 들어, n번째 윈도우는 n번째에서 n+49번째의 지진을 포함하고, 그 다음 n+1번째 윈도우는 n번째 지진을 제거하고 n+1에서 n+50번째의 지진 사건을 포함한다. 본 연구는 전지구적으로 발생한 모든 M ≥ 6.5 지진에 대해서 이와 같은 방식으로 39,780개의 시공간 윈도우를 생성하였으며, 이 중 80%를 주성분 분석 모델의 학습을 위해 사용하였고, 나머지 20%를 학습을 완료한 주성분 분석 모델을 평가하기 위해 활용하였다. 시공간 윈도우 내의 지진 사건의 정보는 Table 1에 수록되었다.
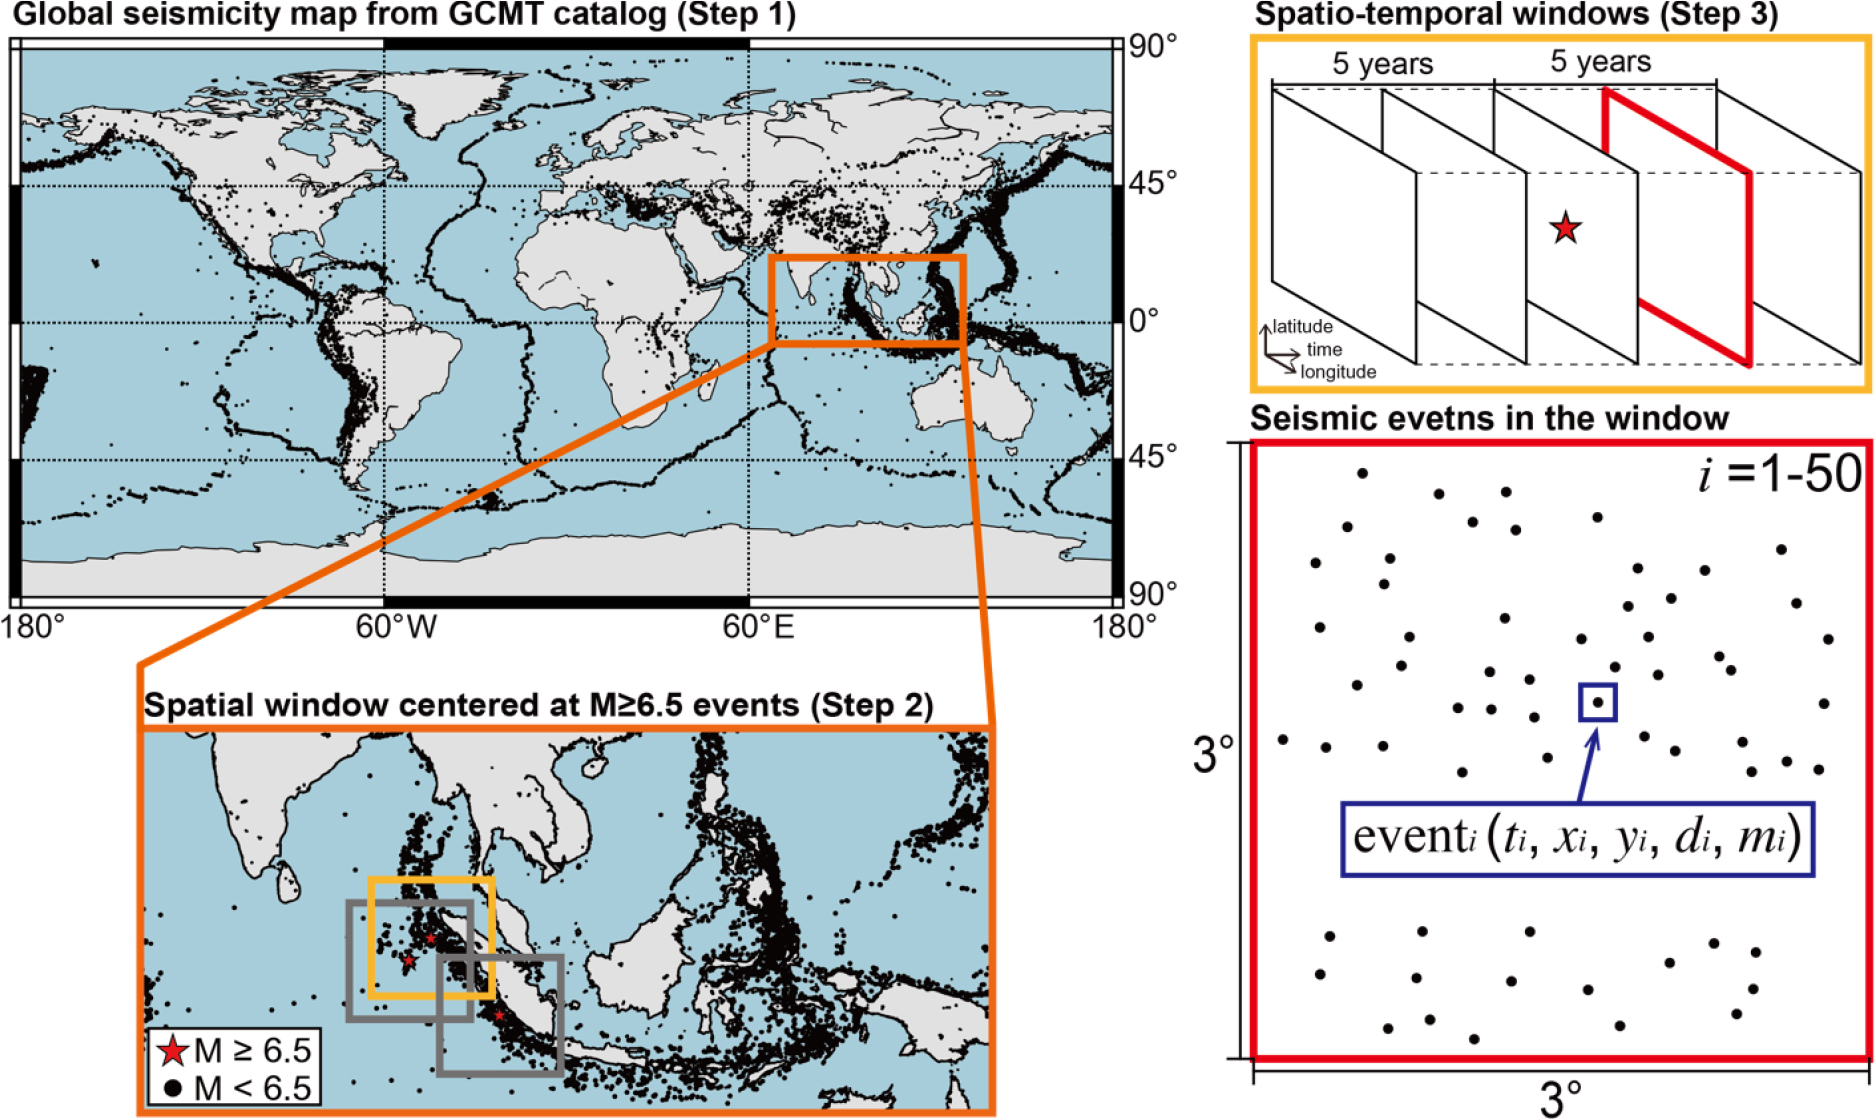
https://static.apub.kr/journalsite/sites/kseg/2022-032-03/N0520320305/images/kseg_32_03_05_F1.jpg
Fig. 1.

The global seismicity from the Global Centroid Moment Tensor (GCMT) catalog and spatio-temporal windows. The GCMT catalog provides 36,699 seismic events (Step 1). The spatial windows (yellow and gray square) are located at the center of M ≥ 6.5 event (red star) in the orange square (Step 2). The spatio-temporal windows comprise seismic events which occur before and after M ≥ 6.5 event for five years from the spatial window in step 2 (Step 3). The length of the temporal window is 3°, and all events in spatio-temporal windows are allocated to several windows by 50 events (see the red square), producing 39,780 windows. ith seismic events in the window contains the information of occurrence time (ti), longitude (xi), latitude (yi), depth (di), and magnitude (mi).

Table 1.

Variables of seismic events in the spatio-temporal window

Descriptions Symbols Descriptions Symbols
Occurrence time of i-th event ti Set of (xi-xj)2+(yi-yj)2(j>i)S
Occurrence time of first event ts Set of diD
Occurrence time of last event te Set of miM
Longitude of i-th event xi Set of dimiD/M
Latitude of i-th event yi Maximum value of SSmax
Hypocentral depth of i-th event di Set of SmaxdiS/D
Magnitude of i-th event mi Set of SmaxmiS/M
Set of ti+1 - tiT Set of diD

차원 확장

본 연구는 각 윈도우가 포함하는 지진 사건의 시간, 위치, 규모의 통계량을 이용하여 원본 자료의 차원을 확장하였다. 자료의 차원 확장을 통해서, 시공간 윈도우가 포함하는 i번째 지진의 발생시간(ti), 경도(xi), 위도(yi), 깊이(di), 규모(mi)의 통계량(Fig. 1의 빨간 사각형)을 활용하여 총 39개의 특징을 얻었다. 차원 확장에 활용한 통계량은 최대값, 최솟값, 평균, 표준편차, 첨도, 왜도이며, 이를 통해 계산한 특징을 Table 2에 정리하였다. 전체 자료 행렬(L)을 구성하는 k번째 표본 lk는 윈도우 내에서 발생한 지진 사건의 250개 정보로부터 계산한 39개의 특징(fik)으로 구성된 벡터이며, 식 (1)로 정의된다.

(1)
lk=[f0k,f1k,,f36k,f38k]

여기서, 전체 자료 행렬(L)은 39780개의 표본(lk)을 수직으로 배열하여 구성되며, 그 크기가 39780 × 39이다.

Table 2.

The expended features of the spatio-temporal window

Descriptions Feature index Symbol Descriptions Feature index Symbol
Maximum value of S 0 Smax Maximum value of S/D 20 S/Dmax
Average value of S 1 Smean Minimum value of S/D 21 S/Dmin
Maximum value of D 2 Dmax Average of S/D 22 S/Dmean
Minimum value of D 3 Dmin Standard deviation of S/D 23 S/Dstd
Average of D 4 Dmean Kurtosis of S/D 24 S/Dkurt
Standard deviation of D 5 Dstd Skewness of S/D 25 S/Dskew
Kurtosis of D 6 Dkurt Maximum value of S/M 26 S/Mmax
Skewness of D 7 Dskew Minimum value of S/M 27 S/Mmin
Maximum value of M 8 Mmax Average of S/M 28 S/Mmean
Minimum value of M 9 Mmin Standard deviation of S/M 29 S/Mstd
Average of M 10 Mmean Kurtosis of S/M 30 S/Mkurt
Standard deviation of M 11 Mstd Skewness of S/M 31 S/Mskew
Kurtosis of M 12 Mkurt Maximum value of T 32 Tmax
Skewness of M 13 Mskew Minimum value of T 33 Tmin
Maximum value of D/M 14 D/Mmax Average of T 34 Tmean
Minimum value of D/M 15 D/Mmin Standard deviation of T 35 Tstd
Average of D/M 16 D/Mmean Kurtosis of T 36 Tkurt
Standard deviation of D/M 17 D/Mstd Skewness of T 37 Tskew
Kurtosis of D/M 18 D/Mkurt Temporal length of window (te - ts) 38 wL
Skewness of D/M 19 D/Mskew

자료 전처리

자료를 구성하는 특징의 단위가 상이할수록, 큰 단위의 특징이 기계학습 모델 학습에 지배적인 영향력을 가지기 때문에 표본(lk)을 구성하는 특징값의 분포를 조절할 필요가 있다(Li et al., 2018). 스케일링은 학습 자료로부터 평균, 분산, 최댓값, 최솟값을 얻고, 이를 fik에 적용하여 Fik로 변환한다. 본 연구는 표준화(standardization)와 최대-최소화(max-min) 스케일링 기법을 도입하였다. 표준화 스케일링은 Li번째 열의 값으로 구성된 벡터(ui)의 평균과 표준 편차를 각각 0과 1로 변환하며, 식 (2)를 따른다.

(2)
Fik=fik-μσ

여기서, μσ는 각각 ui의 모집단으로부터 계산한 평균과 표준편차이다. 최대-최소 스케일링은 ui의 최댓값과 최솟값이 각각 1과 0이 되도록 조정한다(식 (3)).

(3)
Fik=fik-min(ui)max(ui)-min(ui)

여기서, max(ui)max(ui)은 각각 ui에 대한 최댓값과 최솟값이다.

학습 자료로부터 계산한 μ, σ, max(ui), max(ui)은 각각 학습과 평가 자료에 적용되어 자료의 분포를 조정한다. 본 연구는 원본과 전처리가 적용된 자료의 특징 분포를 비교함으로써, 각 전처리 기법이 차원 확장이 적용된 지진 카탈로그의 상이한 단위로 인한 영향을 감소시킨 정도를 비교하였다.

차원 축소

주성분 분석은 자료의 특성을 지배하는 성분을 더 작은 차원의 공간에 투영함으로써 자료의 차원을 낮춘다(Abdi and Williams, 2010). 차원 확장과 전처리가 적용된 39차원의 자료를 n차원으로 축소하기 위해서 전체 자료 행렬(L)의 공분산 행렬로부터 39개의 고윳값(λi)과 고유벡터(vi)를 계산한 후, 고윳값이 큰 순서대로 정렬한 n개의 고유벡터로 행렬(Vn) 을 구성하였다(식 (4)).

(4)
Vn=[v0v1vn-1vn]

n차원 공간으로 투영되어 자료의 차원이 축소된 자료 행렬(Ln)은 다음 식을 따른다(식 (5)).

(5)
Ln=LVn

본 연구는 각 전처리 방식에 따른 차원 확장된 지진 카탈로그의 정보를 보존하기 위해 필요한 주성분 수를 조사하기 위해서, 특징 추출을 위해 사용한 주성분 수에 따른 자료의 분산을 비교하였다.

결 과

본 연구는 지진의 시공간 윈도우가 포함하는 지진 정보로부터 계산된 통계량을 활용하여 자료의 차원을 확장하였다. 차원이 확장된 자료에 표준화와 최대-최소화 기법을 적용하고, 각 전처리에 따른 자료 값의 분포를 비교하였다. 그 후, 주성분 분석을 이용하여 자료의 차원을 감소시키고, 전처리 기법에 따른 주성분이 원본 자료의 특징을 반영하는 정도를 비교하였다.

차원 확장 및 전처리 결과

본 연구는 Global Centroid Moment Tensor(GCMT) catalog로부터 36,699개의 지진 사건의 정보를 얻은 후, 차원 확장을 통해 39개의 특징으로 구성된 39,780개 자료를 획득하였다. 차원 확장이 적용되기 전의 지진 카탈로그는 지진 사건의 발생 시점, 위도, 경도, 깊이, 규모의 정보를 포함한다. 대부분의 지진 사건은 약 30 km 이하의 깊이에서 발생하였으며(Fig. 2a), M4.9~M5.1 사이의 지진의 발생 빈도가 가장 높았다(Fig. 2b). 차원 확장 후, 각 윈도우 내에서 발생한 지진 사건 사이의 평균 거리(Smean)은 대부분 100~150 km이며, 다음 지진이 발생하는데 소요된 시간의 평균(Tmean)은 대부분 0~20일이었다(Fig. 2c and 2d). 시공간 윈도우가 포함하는 지진의 깊이의 평균(Dmean)과 규모의 평균(Mmean)은 대부분 0~100 km와 5.2~5.4사이에 각각 분포하였다(Fig. 2e and 2f).
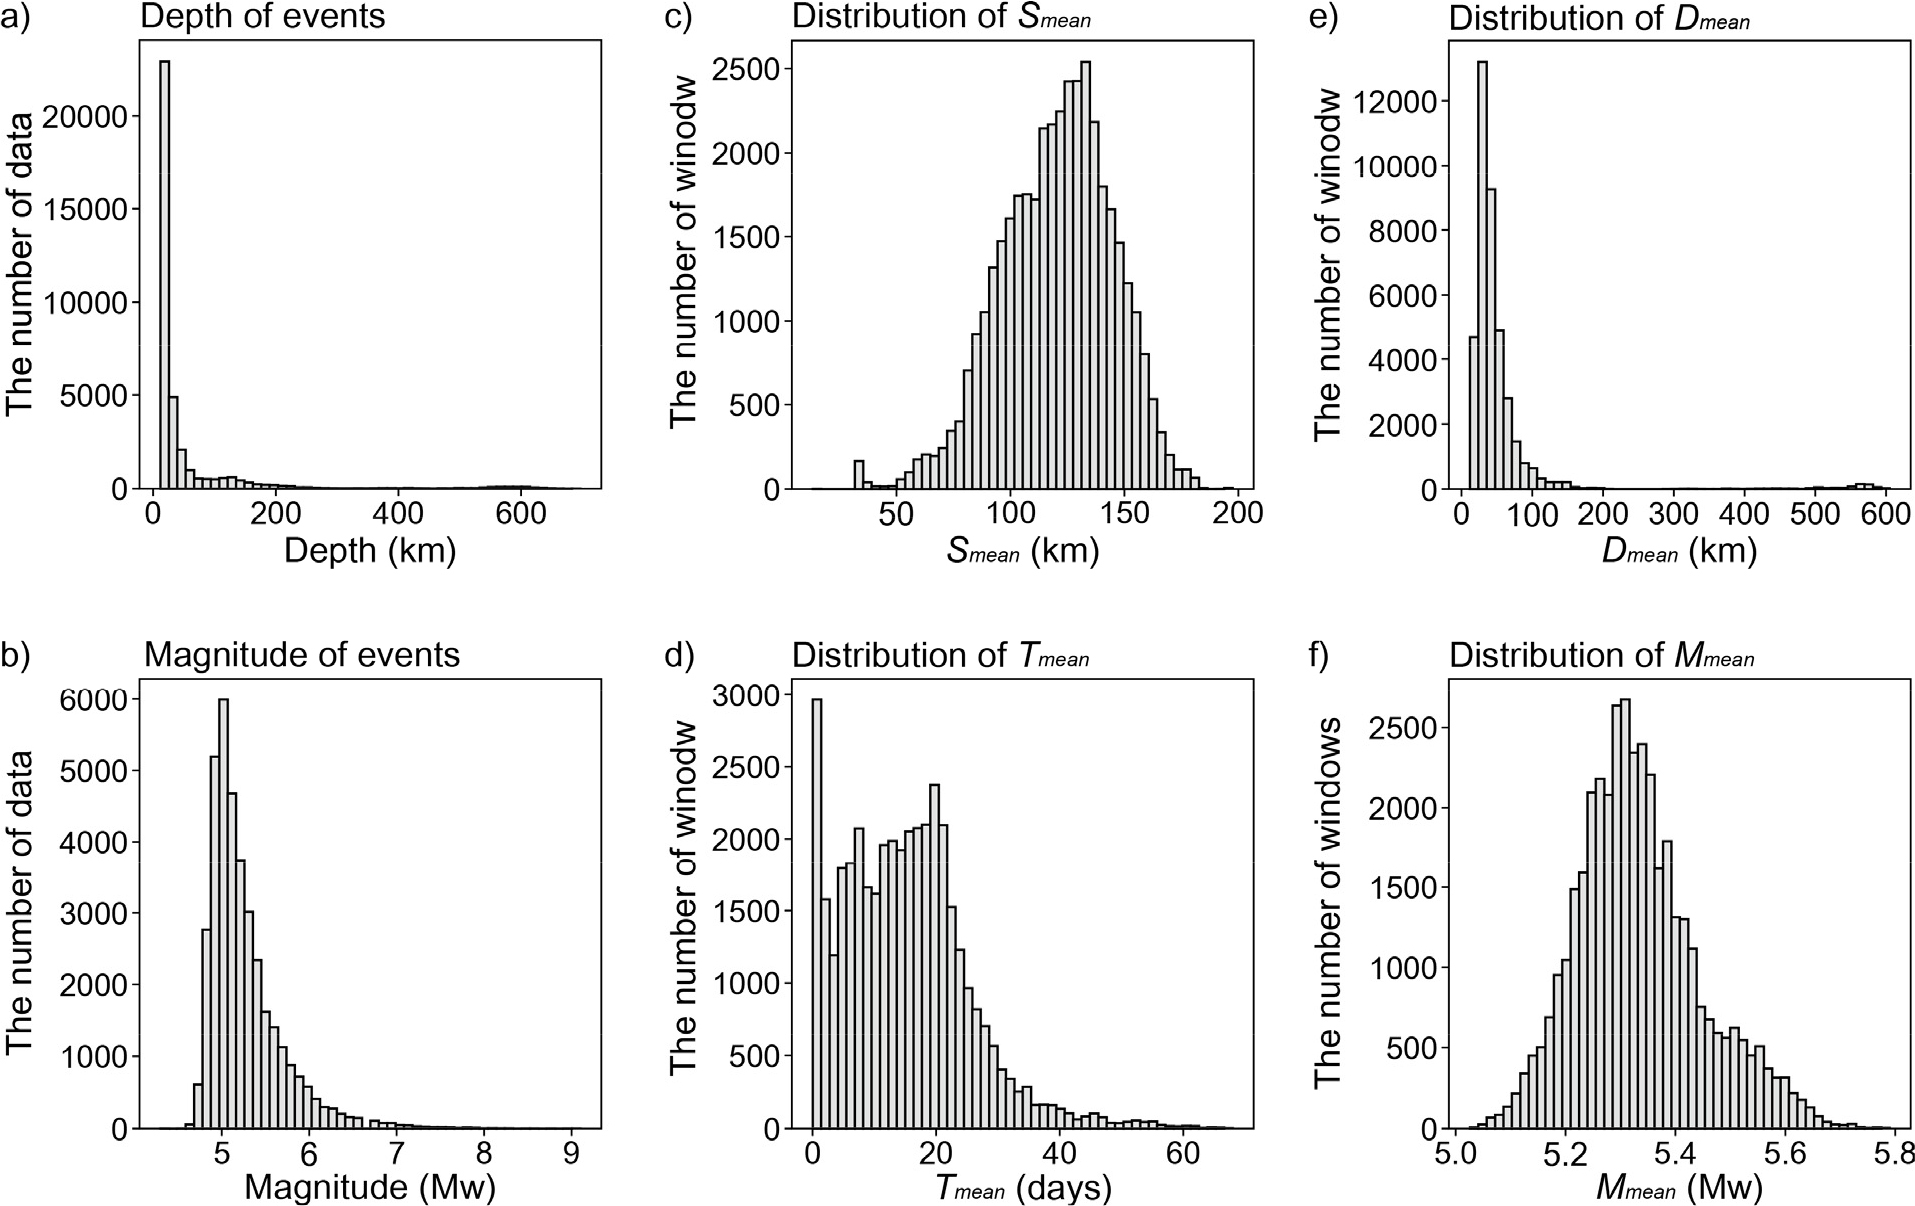
https://static.apub.kr/journalsite/sites/kseg/2022-032-03/N0520320305/images/kseg_32_03_05_F2.jpg
Fig. 2.

Histogram describing the features before/after dimensional expansion (DE). (a-b) Hypocentral depth and magnitude before DE. (c-d) the distance between each event in windows (Smean) and the difference time for the next event in window (Tmean). (e-f) mean depth (Dmean) and magnitude (Mmean) of seismic events in windows after DE.

Fig. 3은 원본 자료와 표준화, 최대-최소, 정규화 스케일링이 적용된 학습 자료의 지진 사이의 거리의 평균(Smean), 다음 지진이 발생하는데 걸리는 시간의 평균(Tmean), 깊이의 평균(Dmean), 규모의 평균(Mmean)의 분포를 나타낸다. 원본 자료를 구성하는 특징의 단위는 km, day, km, Mw이며, SmeanDmean의 중앙값(상자의 중앙선)은 약 117.0의 차이를 보였다(Fig. 3a). 표준화 스케일링을 적용한 자료는 네 개의 특징 모두 중앙값과 25와 75 백분위수가 유사한 값을 보였다(Fig. 3). 최대-최소 스케일링은 특징의 중앙값 분포가 다소 편차가 있는 결과를 보였지만, 중앙값의 차이가 최대 0.3으로서 원본 자료에 비해서 균일한 분포를 보였다(Fig. 3c).
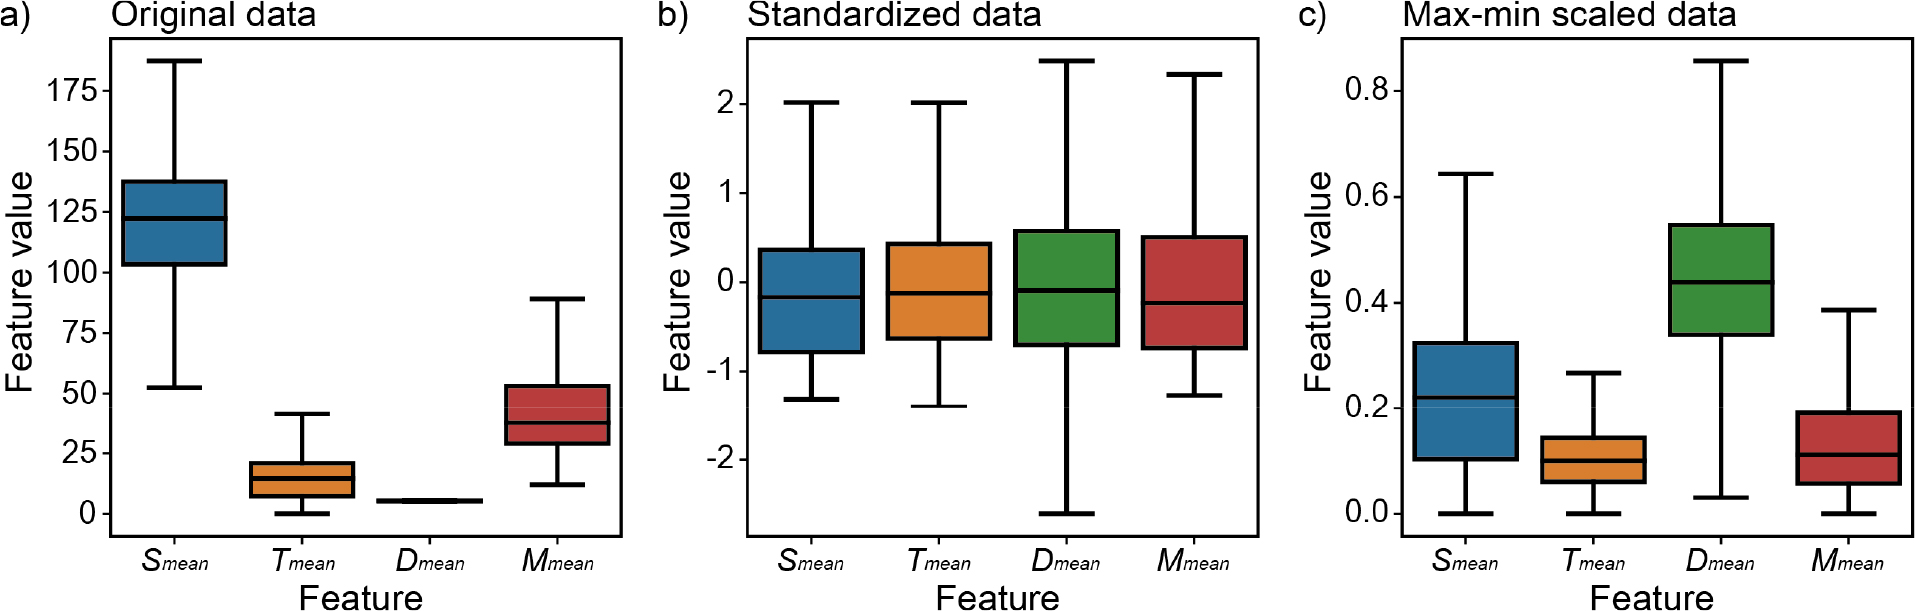
https://static.apub.kr/journalsite/sites/kseg/2022-032-03/N0520320305/images/kseg_32_03_05_F3.jpg
Fig. 3.

Boxplots with the original and scaled features. The middle, upper, and bottom lines indicate median, 25 percentile, and 75 percentile, respectively. The tails of box represent maximum and minimum values. Feature distribution of (a) without scaler, (b) with standard scaler, (c) with max-min scaler. Feature without scaling represent up to 117 differences between each feature by its units. The scalers reduce difference of feature values to ~0.6.

주성분 분석을 이용해서 자료를 39개의 성분으로 분해하고, 추출한 주성분이 원본 자료의 분포를 반영하는 비율(φ)을 조사하였다(Fig. 4). 여기서, 추출한 주성분의 수(n)와 자료의 공분산 행렬로부터 얻은 고윳값(eigenvalue, λ)에 대해서, φ식 (6)과 같이 정의된다(Partridge and Calvo, 1998).

(6)
φ=i=0nλii=037λi,whereλ0>λ1>>λ37>λ38

자료의 공분산 행렬로부터 얻은 고윳값이 클수록 고유벡터 방향의 자료의 분산이 증가하기 때문에, φ가 클수록 누적된 주성분은 원본 자료의 정보를 더 보존한다(Macciotta et al., 2010). 스케일링이 적용되지 않은 원본자료의 경우, 6개의 주성분을 사용하여 원본 학습자료의 99%를 재구성하였다(Fig. 4의 파란색 선). 표준화와 최대-최소화를 적용한 학습 자료는 각각 16개와 14개 이상의 주성분이 원본 학습 자료의 분산 98%를 설명하였다(Fig. 4의 주황색과 초록색 선). 이는 스케일링 방식에 상관없이 39개의 특징 중 16개의 주성분을 사용하여 전체 자료의 특징을 대부분 반영할 수 있음을 나타낸다.
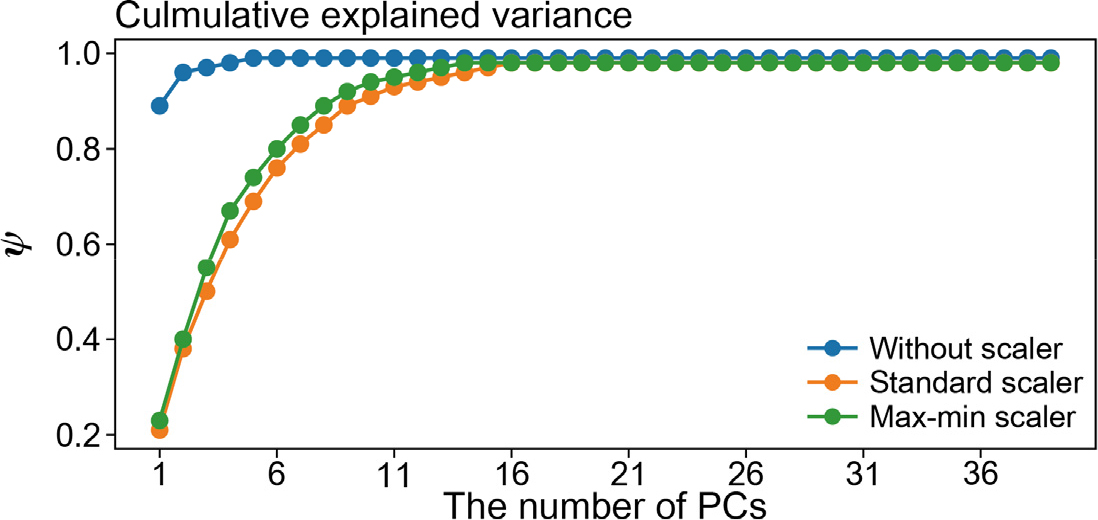
https://static.apub.kr/journalsite/sites/kseg/2022-032-03/N0520320305/images/kseg_32_03_05_F4.jpg
Fig. 4.

The cumulative explained variance (φ) of original and scaled training data with the number of principal components (PCs). The reconstructed training data without scaler (blue line) explains 0.99 of the original features with six PCs. With the standardization and max-min scaler, the sixteen PCs represent ~0.98 of the original data.

평가 자료로부터 추출한 주성분을 원본의 차원으로 재구성한 후, 원본과 재구성된 평가 자료를 비교하기 위해서 각 특징의 최댓값(Fig. 5의 위 실선), 최소값(Fig. 5의 아래 실선), 평균(Fig. 5의 점선)을 비교하고, Root Mean Square Error(RMSE)를 사용하여 두 자료 사이의 유사도를 평가하였다(Hodgkinson et al., 2013). La,bRa,b는 원본 자료 행렬(L)과 주성분으로 재구성된 자료 행렬(R)의 ab열 원소이며, RL에 대한 RMSE는 식 (7)과 같이 정의된다.

(7)
RMSE=139780×39i=039779j=038[La,b-Ra,b]2

여섯 개의 주성분을 사용한 경우, 스케일링을 적용하지 않은 원본과 재구성된 평가자료의 특징 값은 유사한 최댓값, 최솟값, 평균을 보였으며, RMSE는 3.7119이었다. 반면, 표준화와 최대-최소화가 적용된 자료의 RMSE는 각각 0.4928과 0.0581이었으며, 스케일링이 적용되지 않은 경우에 비해서 상대적으로 낮은 값을 보였다(Fig. 5b and 5c). 열여섯 개의 주성분을 사용하여 재구성된 평가자료는 여섯 개의 주성분으로 재구성된 평가자료보다 특징 값의 최댓값, 최솟값, 평균이 원본 자료의 값에 더욱 근접하였으며, RMSE 역시 더 적은 값을 보였다.
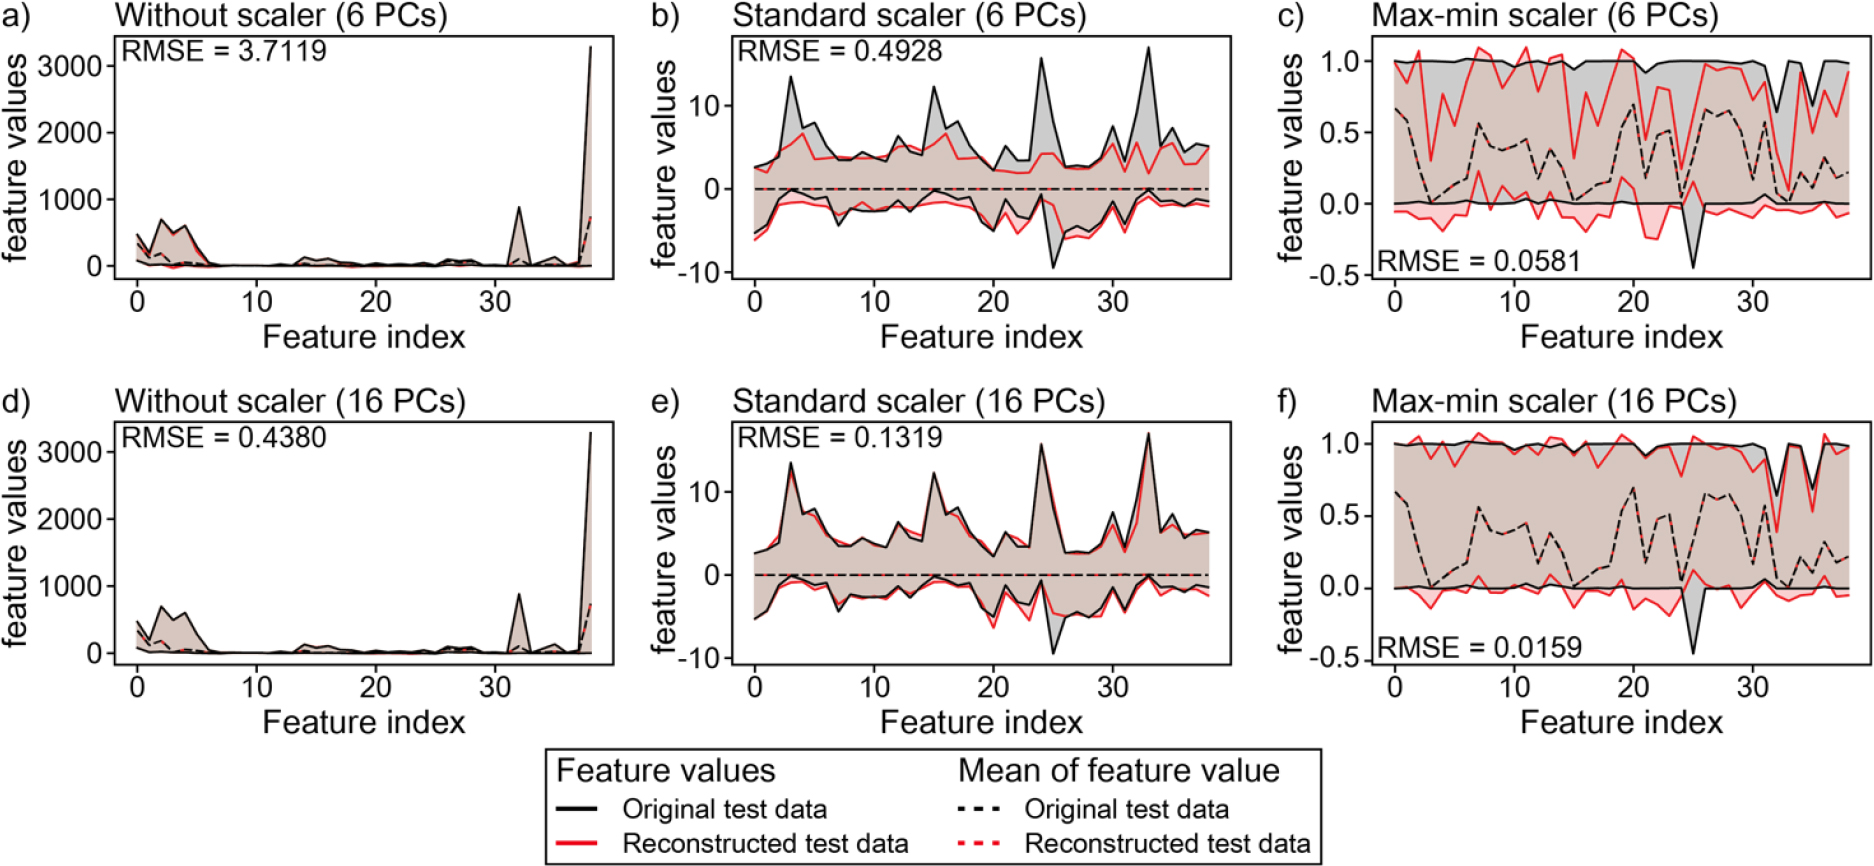
https://static.apub.kr/journalsite/sites/kseg/2022-032-03/N0520320305/images/kseg_32_03_05_F5.jpg
Fig. 5.

The feature values of original and reconstructed test data with 6 and 16 principal components (PCs). We compared both data using maximum (upper solid line), minimum (bottom solid line), and mean values (dashed line). Root Mean Square Error (RMSE) is used to quantify the difference between the original and reconstructed data. (a-c) the feature values of the original test data and reconstructed test data with 6 PCs. (d-f) the feature values of the original test data and reconstructed test data with 16 PCs.

토의 및 결론

최근 대량으로 축적된 지진학 자료를 처리하고, 이로부터 지진 재해에 대한 함의를 찾기 위해 다수의 연구가 기계학습을 활용하고 있다(Kong et al., 2019; Beroza et al., 2021). 효율적이고 정확한 기계학습 모형을 구축하기 위해서, 각 자료의 특성을 파악하고, 이에 적합한 전처리를 수행해야 한다. 본 연구는 기계학습에 활용할 자료를 제작하기 위해서, 다수의 지진이 포함하는 특성을 대변하는 지진 정보의 통계량을 계산하였으며, 차원 축소를 통해 자료의 주요 특징을 추출하였다.

지진 카탈로그를 구성하는 정보의 서로 다른 단위로 인한 영향을 최소화하기 위해서 차원이 확장된 자료에 표준화와 최대-최소화를 적용하였다. 표준화를 적용한 경우, 각 특징의 중앙값과 25와 75백분위가 균일하였다. 표준화와 최대-최소화 스케일링을 적용한 자료의 정보를 보존하기 위해서 열여섯 개의 주성분이 필요하였지만, 스케일링을 적용하지 않은 자료는 정보를 보존하기 위해서 여섯 개의 주성분이 필요하였다. 이는 스케일링이 적용되지 않은 원본자료가 서로 다른 단위를 가지기 때문이다. 본 연구의 차원이 확장된 자료는 지진의 일차적인 정보의 통계량으로 구성되어 있으며, 각각의 통계량은 다수의 지진 정보를 대변한다. 결정 나무 기반의 기계학습은 분류 규칙 형성에 기여한 특징의 중요도를 정량화할 수 있으며, 이를 이용하여 중요도가 높은 특징 위주로 학습 및 평가 자료를 재구성할 수 있다. 이와 같은 접근법은 학습 모델이 전체적인 분류 규칙을 형성하는 과정을 설명할 수 있지만, 각 표본과 특징 중요도의 상관성에 대해서 설명하기가 어렵다(Lundberg and Lee, 2017).

최근 암석 파괴 실험과 수치 모형을 활용한 실험은 대규모 지진 발생에 영향을 미치는 요인의 중요도를 계산하기 위해 SHapley Additive exPlanations(SHAP)(Lundberg et al., 2020)를 도입하고 있으며, SHAP 값을 통해 각 특징의 값과 중요도 사이의 관계를 분석함으로써 기존 방법보다 일관된 특징 중요도를 계산하였다(Ren et al., 2019; McBeck et al., 2020). 본 연구에서 활용한 차원 확장이 적용된 지진 카탈로그에 설명가능한 기계학습을 적용함으로써 진원의 분포, 지진의 규모, 지진 발생률과 기계학습이 예측한 결과 사이의 관계를 정량적으로 분석할 수 있을 것으로 예상된다. 더욱이, 결정 나무 기반의 기계학습으로부터 중요도를 계산할 수 있었던 기존의 방식과 달리, 심층학습을 포함한 다양한 기계학습에 적용하여 더 효율적이고 정확한 분류기를 구축할 수 있을 것이다. 또한 본 연구에서 제시하는 자료 구성 기법은 진원 기구해가 포함하는 단층 정보(예, 주향, 경사, 미끄러짐 각도)를 활용함으로써 지진 후 응력 분포, 여진 분포 예측, 단층 구조 파악을 위한 기계학습 연구에 활용할 수 있을 것으로 기대된다(Ross et al., 2019; Wang and Zhan, 2020; Kuang et al., 2021).

본 연구는 지진의 발생 시간, 위치, 규모의 정보를 확장하여 기계학습에 적용 가능한 자료를 제작하기 위해, Global Centroid Moment Tensor 카탈로그로부터 얻은 지진 정보의 통계량으로 자료를 구성하였다. 각 특징의 상이한 단위로 인한 영향을 최소화하기 위해 다양한 스케일링 기법(예, 표준화, 최대-최소화 스케일링)을 적용하였으며, 주성분 분석을 활용하여 자료의 주요 특징을 추출하였다. 표준화와 최대-최소화는 각 특징의 단위에 의한 영향을 최소화하였다. 주성분 분석은 원본 자료의 약 42%의 특징을 사용하여 원본 자료의 정보를 재구성하였다. 본 연구는 기계학습에 활용 가능한 차원 확장된 지진 자료를 생성하였으며, 이는 대량의 지진 자료를 효율적으로 분석할 수 있는 방법을 제시할 것이다.

Acknowledgements

본 연구는 “행정안전부 방재안전분야 전문인력 양성”사업과 한국연구재단 중견연구지원사업(2022R1A2C1009742)과 중점연구소지원 사업(No. 2019R1A6A1A03033167), 한국해양과학기술원의 지원을 받아 수행되었다(PEA0084). 바쁘신 가운데도 불구하고 아낌없는 조언을 주신 세 명의 심사위원께 감사를 표합니다.

References

1
Abdi, H., Williams, L.J., 2010, Principal component analysis, Wiley Interdisciplinary Reviews: Computational Statistics, 2(4), 433-459. 10.1002/wics.101
2
Bergen, K.J., Johnson, P.A., de Hoop, M.V., Beroza, G.C., 2019, Machine learning for data-driven discovery in solid Earth geoscience, Science, 363(6433), eaau0323. 10.1126/science.aau032330898903
3
Beroza, G.C., Segou, M., Mostafa Mousavi, S., 2021, Machine learning and earthquake forecasting-next steps, Nature Communication, 12(1), 1-3. 10.1038/s41467-021-24952-634362887PMC8346575
4
Bolton, D.C., Shokouhi, P., Rouet-Leduc, B., Hulbert, C., Rivière, J., Marone, C., Johnson, P.A., 2019, Characterizing acoustic signals and searching for precursors during the laboratory seismic cycle using unsupervised machine learning, Seismological Research Letters, 90(3), 1088-1098. 10.1785/0220180367
5
Bregman, Y., Rabin, N., 2019, Aftershock identification using diffusion maps, Seismological Research Letters, 90(2A), 539-545. 10.1785/0220180291
6
Chamberlain, C.J., Frank, W.B., Lanza, F., Townend, J., Warren-Smith, E., 2021, Illuminating the pre-, co-, and post-seismic phases of the 2016 M7.8 Kaikōura earthquake with 10 years of seismicity, Journal of Geophysical Research: Solid Earth, 126(8), e2021JB022304. 10.1029/2021JB022304
7
Chen, Y., 2020, Automatic microseismic event picking via unsupervised machine learning, Geophysical Journal International, 222(3), 1750-1764. 10.1093/gji/ggaa186
8
Di, H., Abubakar, A., 2022, Estimating subsurface properties using a semisupervised neural network approach, Geophysics, 87(1), IM1-IM10. 10.1190/geo2021-0192.1
9
Ekström, G., Nettles, M., Dziewoński, A.M., 2012, The global CMT project 2004-2010: Centroid-moment tensors for 13,017 earthquakes, Physics of the Earth and Planetary Interiors, 200, 1-9. 10.1016/j.pepi.2012.04.002
10
Feng, L., Hill, E.M., Banerjee, P., Hermawan, I., Tsang, L.L., Natawidjaja, D.H., Suwargadi, B.W., Sieh, K., 2015, A unified GPS-based earthquake catalog for the Sumatran plate boundary between 2002 and 2013, Journal of Geophysical Research: Solid Earth, 120(5), 3566-3598. 10.1002/2014JB011661
11
Giallini, S., Paolucci, E., Sirianni, P., Albarello, D., Gaudiosi, I., Polpetta, F., Simionato, M., Stigliano, F., Tsereteli, N., Gogoladze, Z., Moscatelli, M., 2021, Reconstruction of a reference subsoil model for the seismic microzonation of Gori (Georgia): A procedure based on Principal Component Analysis (PCA), Bulletin of the Seismological Society of America, 111(4), 1921-1939. 10.1785/0120200341
12
Guerrieri, L., Baer, G., Hamiel, Y., Amit, R., Blumetti, A.M., Comerci, V., Manna, A., M., Michetti, A., Salamon, A., Mushkin, G., Vittori, E., 2010, InSAR data as a field guide for mapping minor earthquake surface ruptures: Ground displacements along the Paganica Fault during the 6 April 2009 L’Aquila earthquake, Journal of Geophysical Research: Solid Earth, 115(B12). 10.1029/2010JB007579
13
Hodgkinson, K., Langbein, J., Henderson, B., Mencin, D., Borsa, A., 2013, Tidal calibration of plate boundary observatory borehole strainmeters, Journal of Geophysical Research: Solid Earth, 118(1), 447-458. 10.1029/2012JB009651
14
Huang, H., Meng, L., Bürgmann, R., Wang, W., Wang, K., 2020, Spatio-temporal foreshock evolution of the 2019 M 6.4 and M 7.1 Ridgecrest, California earthquakes, Earth and Planetary Science Letters, 551, 116582. 10.1016/j.epsl.2020.116582
15
Jung, D., Lee, J., Park, H., 2021, Feature expansion of single dimensional time series data for machine learning classification, Proceedings of the 2021 Twelfth International Conference on Ubiquitous and Future Networks (ICUFN), IEEE, 96-98. 10.1109/ICUFN49451.2021.9528690
16
Kagan, Y., Knopoff, L., 1978, Statistical study of the occurrence of shallow earthquakes, Geophysical Journal International, 55(1), 67-86. 10.1111/j.1365-246X.1978.tb04748.x
17
Kagan, Y.Y., 2003, Accuracy of modern global earthquake catalogs, Physics of the Earth and Planetary Interiors, 135(2-3), 173-209. 10.1016/S0031-9201(02)00214-5
18
Kilb, D., Gomberg, J., Bodin, P., 2002, Aftershock triggering by complete Coulomb stress changes, Journal of Geophysical Research: Solid Earth, 107(B4), ESE-2. 10.1029/2001JB000202
19
Kong, Q., Trugman, D.T., Ross, Z.E., Bianco, M.J., Meade, B.J., Gerstoft, P., 2019, Machine learning in seismology: Turning data into insights, Seismological Research Letters, 90(1), 3-14. 10.1785/0220180259
20
Kuang, W., Yuan, C., Zhang, J., 2021, Real-time determination of earthquake focal mechanism via deep learning, Nature Communications, 12(1), 1-8. 10.1038/s41467-021-21670-x33664244PMC7933283
21
Li, Z., Meier, M., Hauksson, E., Zhan, Z., Andrews, J., 2018, Machine learning seismic wave discrimination: Application to earthquake early warning, Geophysical Research Letters, 45(10), 4773-4779. 10.1029/2018GL077870
22
Liu, M., Zhang, M., Zhu, W., Ellsworth, W.L., Li, H., 2020, Rapid characterization of the July 2019 Ridgecrest, California, earthquake sequence from raw seismic data using machine-learning phase picker, Geophysical Research Letters, 47(4), e2019GL086189. 10.1029/2019GL086189
23
Lomnitz, C., 1996, Search of a worldwide catalog for earthquakes triggered at intermediate distances, Bulletin of the Seismological Society of America, 86(2), 293-298. 10.1785/BSSA0860020293
24
Lundberg, S.M., Erion, G., Chen, H., DeGrave, A., Prutkin, J.M., Nair, B., Katz, R., Himmelfarb, J., Bansal, N., Lee, S.I., 2020, From local explanations to global understanding with explainable AI for trees, Nature Machine Intelligence, 2(1), 56-67. 10.1038/s42256-019-0138-932607472PMC7326367
25
Lundberg, S.M., Lee, S.I., 2017, A unified approach to interpreting model predictions, Advances in Neural Information Processing Systems, 30.
26
Lv, A., Cheng, L., Aghighi, M.A., Masoumi, H., Roshan, H., 2021, A novel workflow based on physics-informed machine learning to determine the permeability profile of fractured coal seams using downhole geophysical logs, Marine and Petroleum Geology, 131, 105171. 10.1016/j.marpetgeo.2021.105171
27
Macciotta, N.P.P., Gaspa, G., Steri, R., Nicolazzi, E.L., Dimauro, C., Pieramati, C., Cappio-Borlino, A., 2010, Using eigenvalues as variance priors in the prediction of genomic breeding values by principal component analysis, Journal of Dairy Science, 93(6), 2765-2774. 10.3168/jds.2009-302920494186
28
Marone, C., 2018, Training machines in Earthly ways, Nature Geoscience, 11(5), 301-302. 10.1038/s41561-018-0117-5
29
McBeck, J., Aiken, J.M., Ben-Zion, Y., Renard, F., 2020, Predicting the proximity to macroscopic failure using local strain populations from dynamic in situ X-ray tomography triaxial compression experiments on rocks, Earth and Planetary Science Letters, 543(C), 116344. 10.1016/j.epsl.2020.116344
30
Meier, M.A., Ross, Z.E., Ramachandran, A., Balakrishna, A., Nair, S., Kundzicz, P., Li, Z., Andrews, J., Yue, Y., 2019, Reliable real-time seismic signal/noise discrimination with machine learning, Journal of Geophysical Research: Solid Earth, 124(1), 788-800. 10.1029/2018JB016661
31
Nanjo, K.Z., Hirata, N., Obara, K., Kasahara, K., 2012, Decade-scale decrease in b value prior to the M9-class 2011 Tohoku and 2004 Sumatra quakes, Geophysical Research Letters, 39(20). 10.1029/2012GL052997
32
Nolan, R.H., Boer, M.M., Resco de Dios, V., Caccamo, G., Bradstock, R.A., 2016, Large-scale, dynamic transformations in fuel moisture drive wildfire activity across southeastern Australia, Geophysical Research Letters, 43(9), 4229-4238. 10.1002/2016GL068614
33
Nuannin, P., Kulhanek, O., Persson, L., 2005, Spatial and temporal b value anomalies preceding the devastating off coast of NW Sumatra earthquake of December 26, 2004, Geophysical Research Letters, 32(11). 10.1029/2005GL022679
34
Paolucci, E., Lunedei, E., Albarello, D., 2017, Application of the principal component analysis (PCA) to HVSR data aimed at the seismic characterization of earthquake prone areas, Geophysical Journal International, 211(1), 650-662. 10.1093/gji/ggx325
35
Partridge, M., Calvo, R.A., 1998, Fast dimensionality reduction and simple PCA, Intelligent Data Analysis, 2(3), 203-214. 10.3233/IDA-1998-2304
36
Ren, C.X., Dorostkar, O., Rouet-Leduc, B., Hulbert, C., Strebel, D., Guyer, R.A., Johnson, P.A., Carmeliet, J., 2019, Machine learning reveals the state of intermittent frictional dynamics in a sheared granular fault, Geophysical Research Letters, 46(13), 7395-7403. 10.1029/2019GL082706
37
Ross, Z.E., Idini, B., Jia, Z., Stephenson, O.L., Zhong, M., Wang, X., Zhan, Z., Simons, M., Fielding, E., J., Jung, J., 2019, Hierarchical interlocked orthogonal faulting in the 2019 Ridgecrest earthquake sequence, Science, 366(6463), 346-351. 10.1126/science.aaz010931624209
38
Rouet-Leduc, B., Hulbert, C., Lubbers, N., Barros, K., Humphreys, C.J., Johnson, P.A., 2017, Machine learning predicts laboratory earthquakes, Geophysical Research Letters, 44(18), 9276-9282. 10.1002/2017GL074677
39
Tan, Y.J., Waldhauser, F., Ellsworth, W.L., Zhang, M., Zhu, W., Michele, M., Chiaraluce, L., Beroza, G., C., Segou, M., 2021, Machine-learning-based high-resolution earthquake catalog reveals how complex fault structures were activated during the 2016-2017 Central Italy sequence, The Seismic Record, 1(1), 11-19. 10.1785/0320210001
40
Toda, S., Stein, R.S., Richards-Dinger, K., Bozkurt, S.B., 2005, Forecasting the evolution of seismicity in southern California: Animations built on earthquake stress transfer, Journal of Geophysical Research: Solid Earth, 110(B5). 10.1029/2004JB003415
41
Utsu, T., Ogata, Y., 1995, The centenary of the Omori formula for a decay law of aftershock activity, Journal of Physics of the Earth, 43(1), 1-33. 10.4294/jpe1952.43.1
42
Vasan, K.K., Surendiran, B., 2016, Dimensionality reduction using principal component analysis for network intrusion detection, Perspectives in Science, 8, 510-512. 10.1016/j.pisc.2016.05.010
43
Wang, X., Zhan, Z., 2020, Seismotectonics and fault geometries of the 2019 Ridgecrest sequence: Insight from aftershock moment tensor catalog using 3-D Green’s functions, Journal of Geophysical Research: Solid Earth, 125(5), e2020JB019577. 10.1029/2020JB01957733282617PMC7685155
44
Zhao, L., Zou, C., Chen, Y., Shen, W., Wang, Y., Chen, H., Geng, J., 2021, Fluid and lithofacies prediction based on integration of well-log data and seismic inversion: A machine-learning approach, Geophysics, 86(4), M151-M165. 10.1190/geo2020-0521.1
45
Zhu, W., Beroza, G.C., 2019, PhaseNet: A deep-neural-network-based seismic arrival-time picking method, Geophysical Journal International, 216(1), 261-273. 10.1093/gji/ggy423
페이지 상단으로 이동하기